[toc]
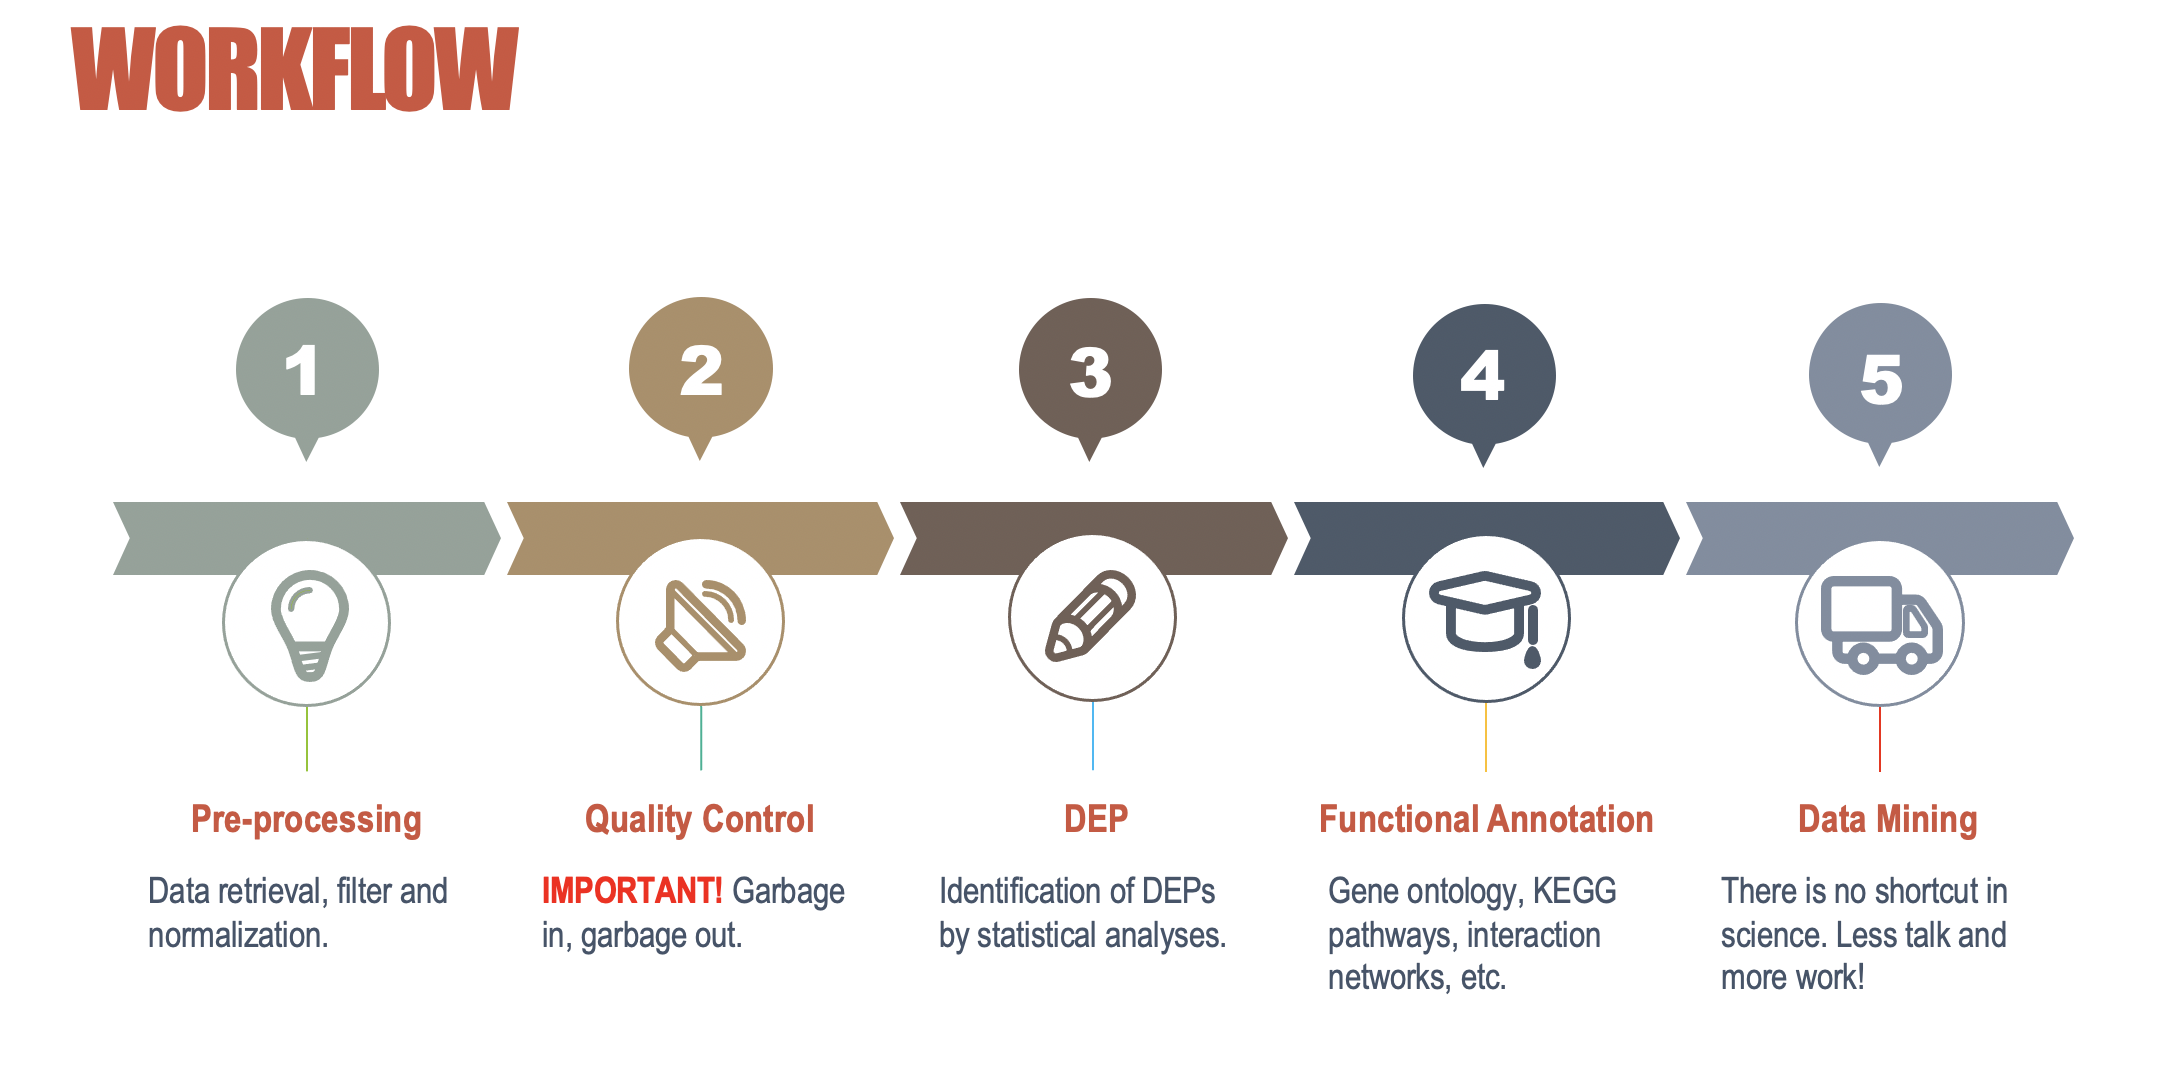
Workflow
Contents
Differentially expressed proteins and representation
Gene Ontology based Functional annotation by Blast2GO
KEGG based Pathway annotation by KOALA
IntAct based Interaction networks by CytoScape
DEPs & REPRESENTATION
DEPS
VOLCANO PLOT
HIERARCHICAL CLUSTERING
Terminalogies
Fold change
A measure describing how much a quantity changes between groups
Fold change (Treatment/Control) = Average (Treatment) / Average (Control)
Significance level
Student’s t-test
One-way Analysis of Variance (ANOVA)
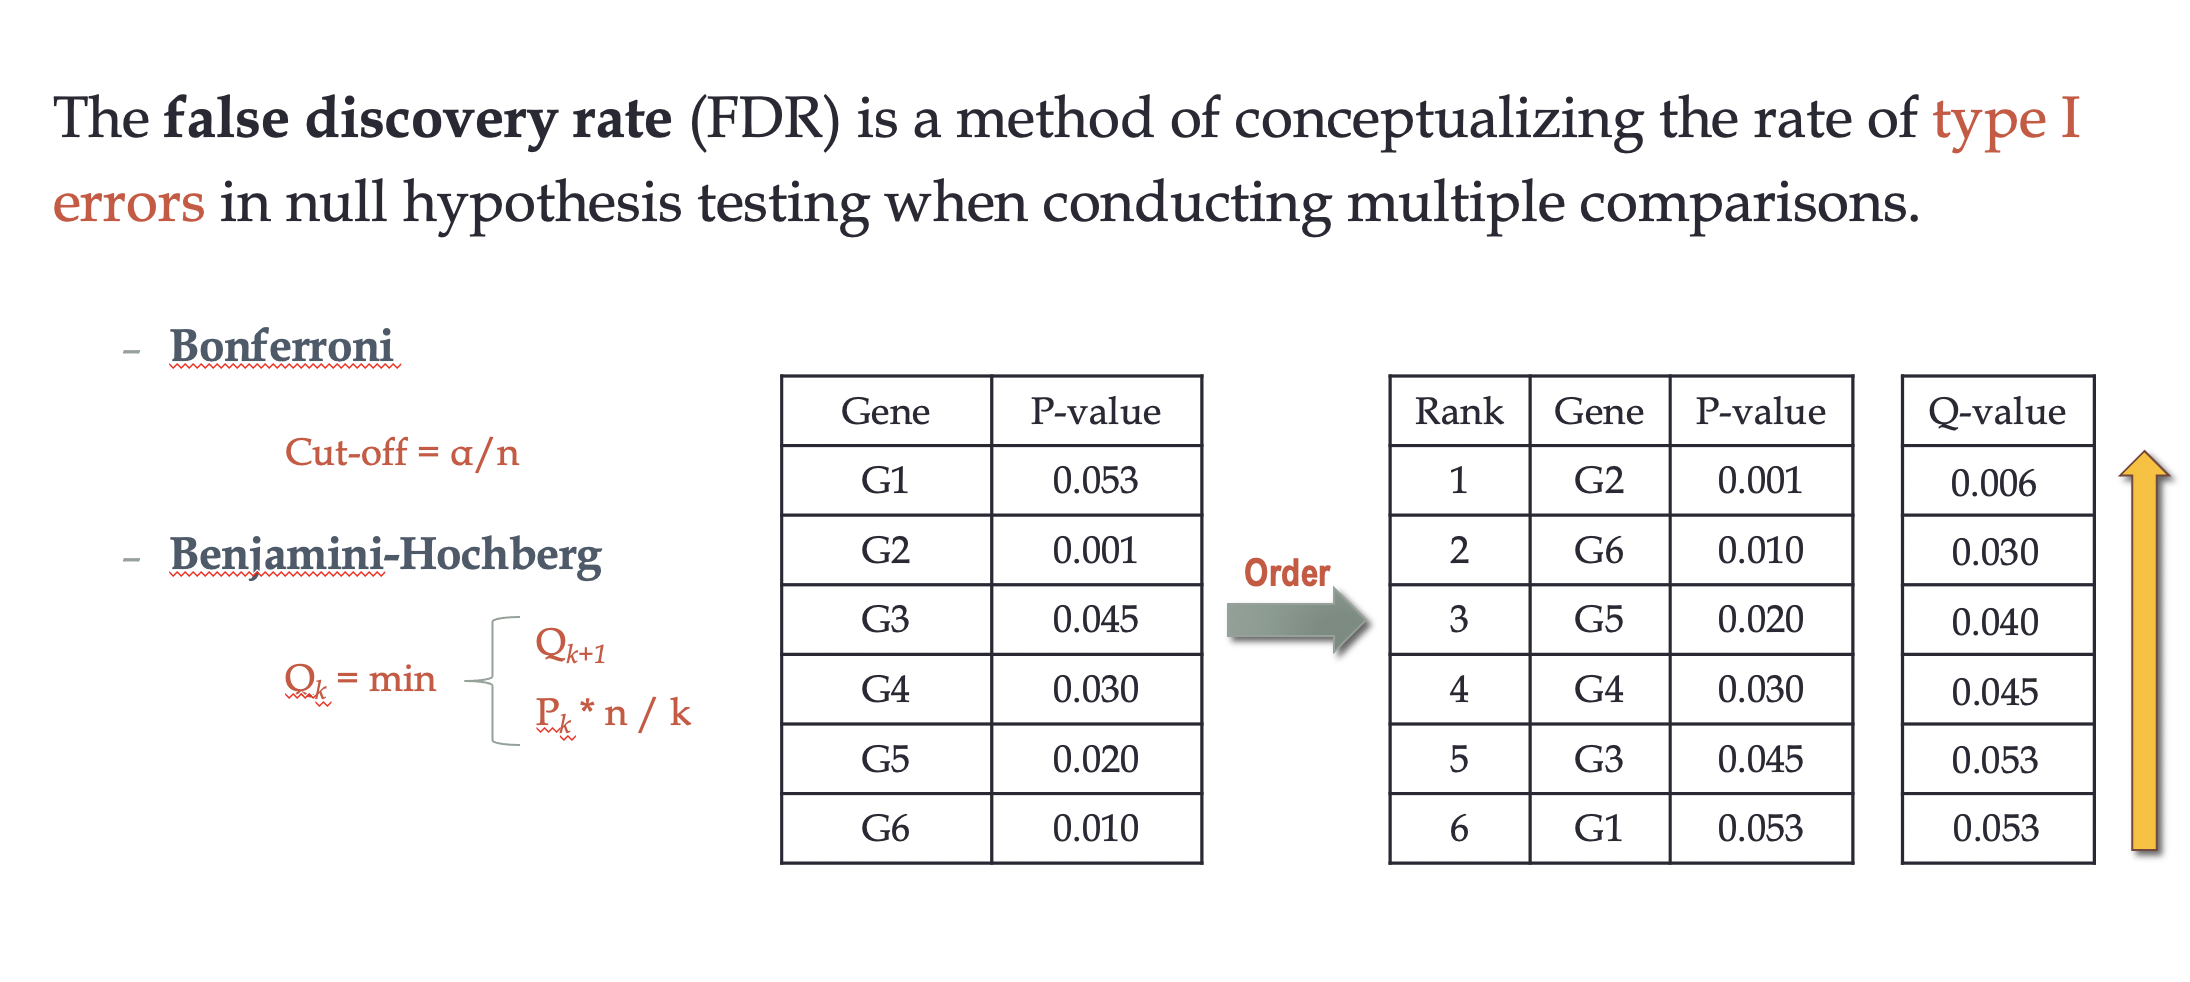
False Discovery Rate (FDR)
DEPs steps
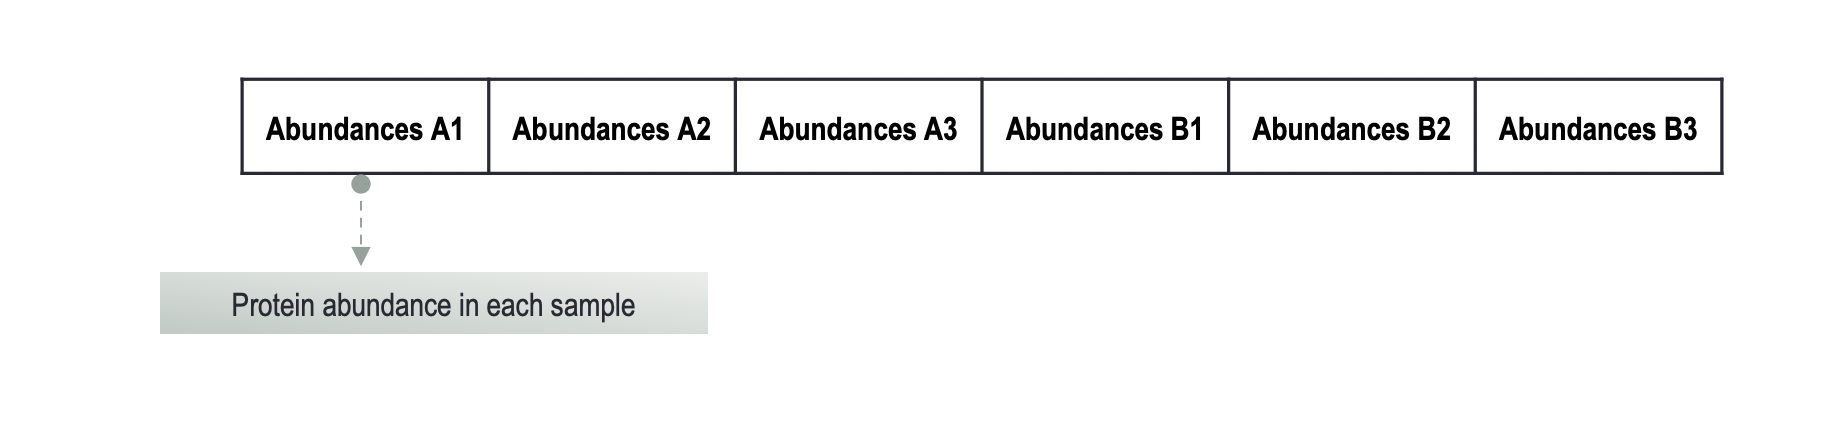
- Download BIO316_L4.xlsx on LMO. This is a a real set of data from a LC-MS/MS based proteomic experiment, pre-processed by Proteome DiscovererTM, with quantitative profile for each of the identified proteins.
A = Control Group, B = Treatment Group, Organism = Mouse
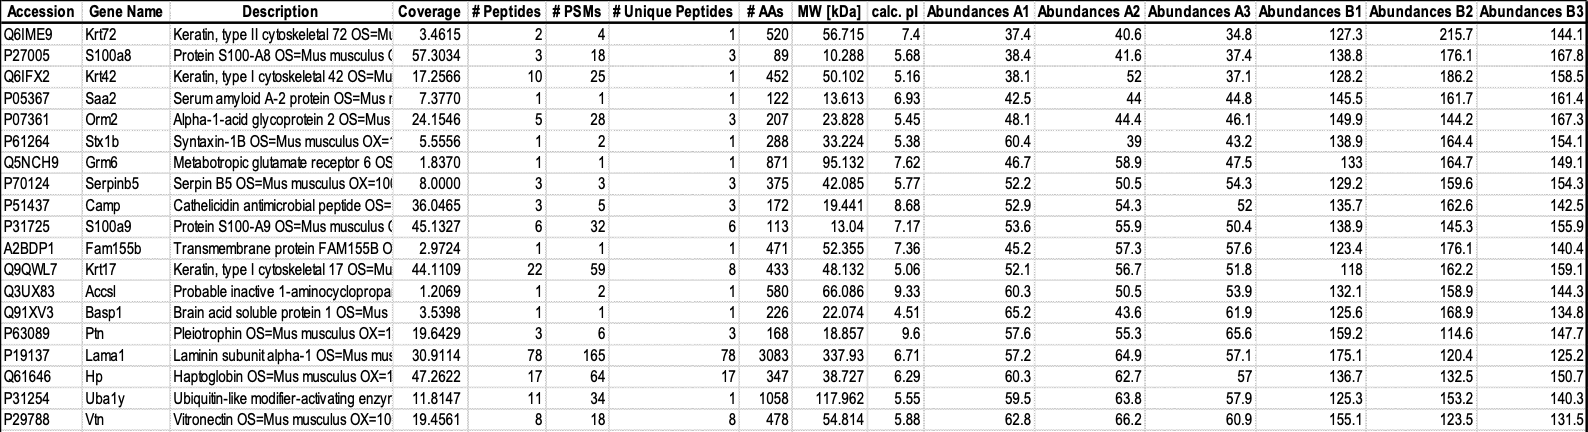
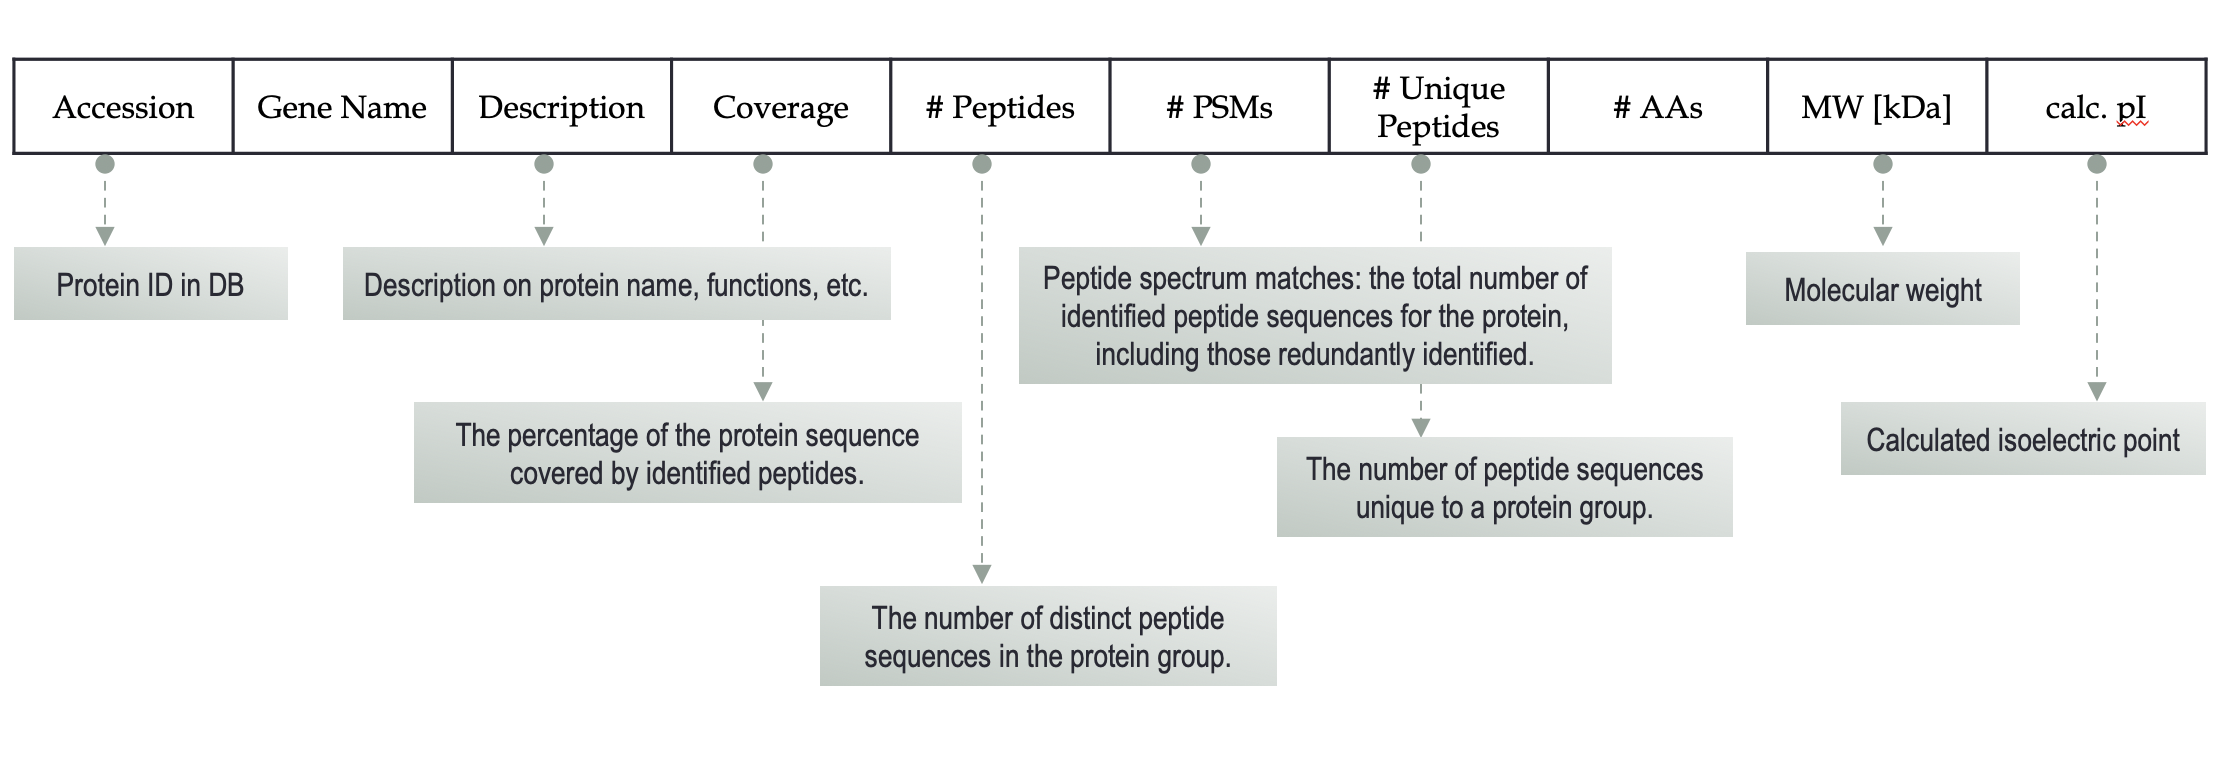
The explanation of each column and its function
- Calculate the Fold Change for each protein.
Fold Change (B vs A) = Average(B) / Average(A)
In this case, for the first protein Q6IME9, use the Excel imbedded function:
=AVERAGE(N2:P2)/AVERAGE(K2:M2)
- Evaluate the significance (P-value) of difference between group A and B by student’s t-test.
Assumingly the expression intensities of each protein follow a normal distribution
Assumingly the variances of the two groups are equal
In this case, for the first protein Q6IME9, use the Excel imbedded function:
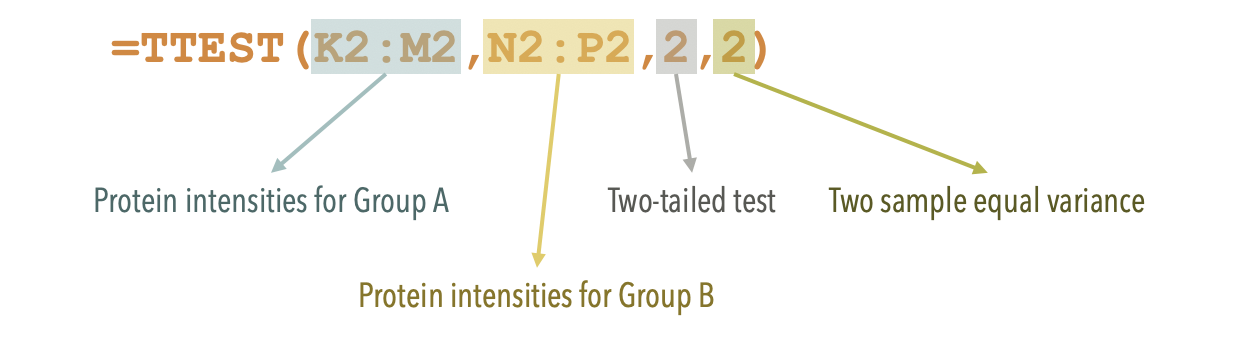
Student’s t-test:
determine if the means of two sets of data are significantly different from each other.
ANOVA:
provides a statistical test of whether the population means of several groups are equal, and therefore generalizes the t-test to more than two groups. ANOVA is useful for comparing three or more group means for statistical significance.
FDR (false discovery rate):
a method of conceptualizing the rate of type I errors in null hypothesis testing when conducting multiple comparisons
- FDR = Q-value = corrected p-value
p-value:衡量一次检验假阳性率的指标(False positive rate) ;
q value:衡量错误发现率的指标(False discovery rate,简称FDR,所有检验中假阳性的概率)。即使用Q value的这个参 数预估FDR。Q value 需要利用公式从p value 校正计算后得到,所以Q value 通常又被称为adjusted p value。所以一般情况下:我们可以认为Q value = FDR = adjusted p value,即三者是一个东西,虽然有些定义上的细微区别,但是问题也不大。作者:caokai001
链接:https://www.jianshu.com/p/949626b18e69
来源:简书
著作权归作者所有。商业转载请联系作者获得授权,非商业转载请注明出处。
- Derivate the differentially expressed proteins.
Fold Change >= 1.2 (up-regulated) or <= 1/1.2 (0.833333, down-regulated)
P-value < 0.05
This results in 275 proteins up-regulated and 146 down-regulated in Group B relative to A.
‼️There is no golden standard for Fold Change setting. Usually, for iTRAQ, it is ideal to set the Fold Change cut-off to be above 1.5 folds (e.g. 1.5 folds, 2.0 folds). 1.2 folds is the minimum threshold recognized by peers.
‼️Ideally, the t-test P-value should be adjusted by Benjamini-Hochberg method. But only very few DEPs will be derived with FDR < 0.05.
Tips:
- DEP mainly calculates two parameters: fold change & p values
- Derive the differentially expressed proteins based on the fold change & p-values obtained in previous steps
- Determine and label the gene name in either up-regulated or down-regulated
- Fold Change >= 1.2 (up-regulated) or <= 1/1.2 (0.833333, down-regulated) P-value < 0.05
Select significant genes ( gene expression profiling experiments)
common objective :
identify those genes that exhibit differential expression (an increased or decreased steady state abundance) under a particular treatment relative to the expression levels of those genes in the control samples
- genes exhibiting a relative
fold changegreater than some arbitrary cutoff
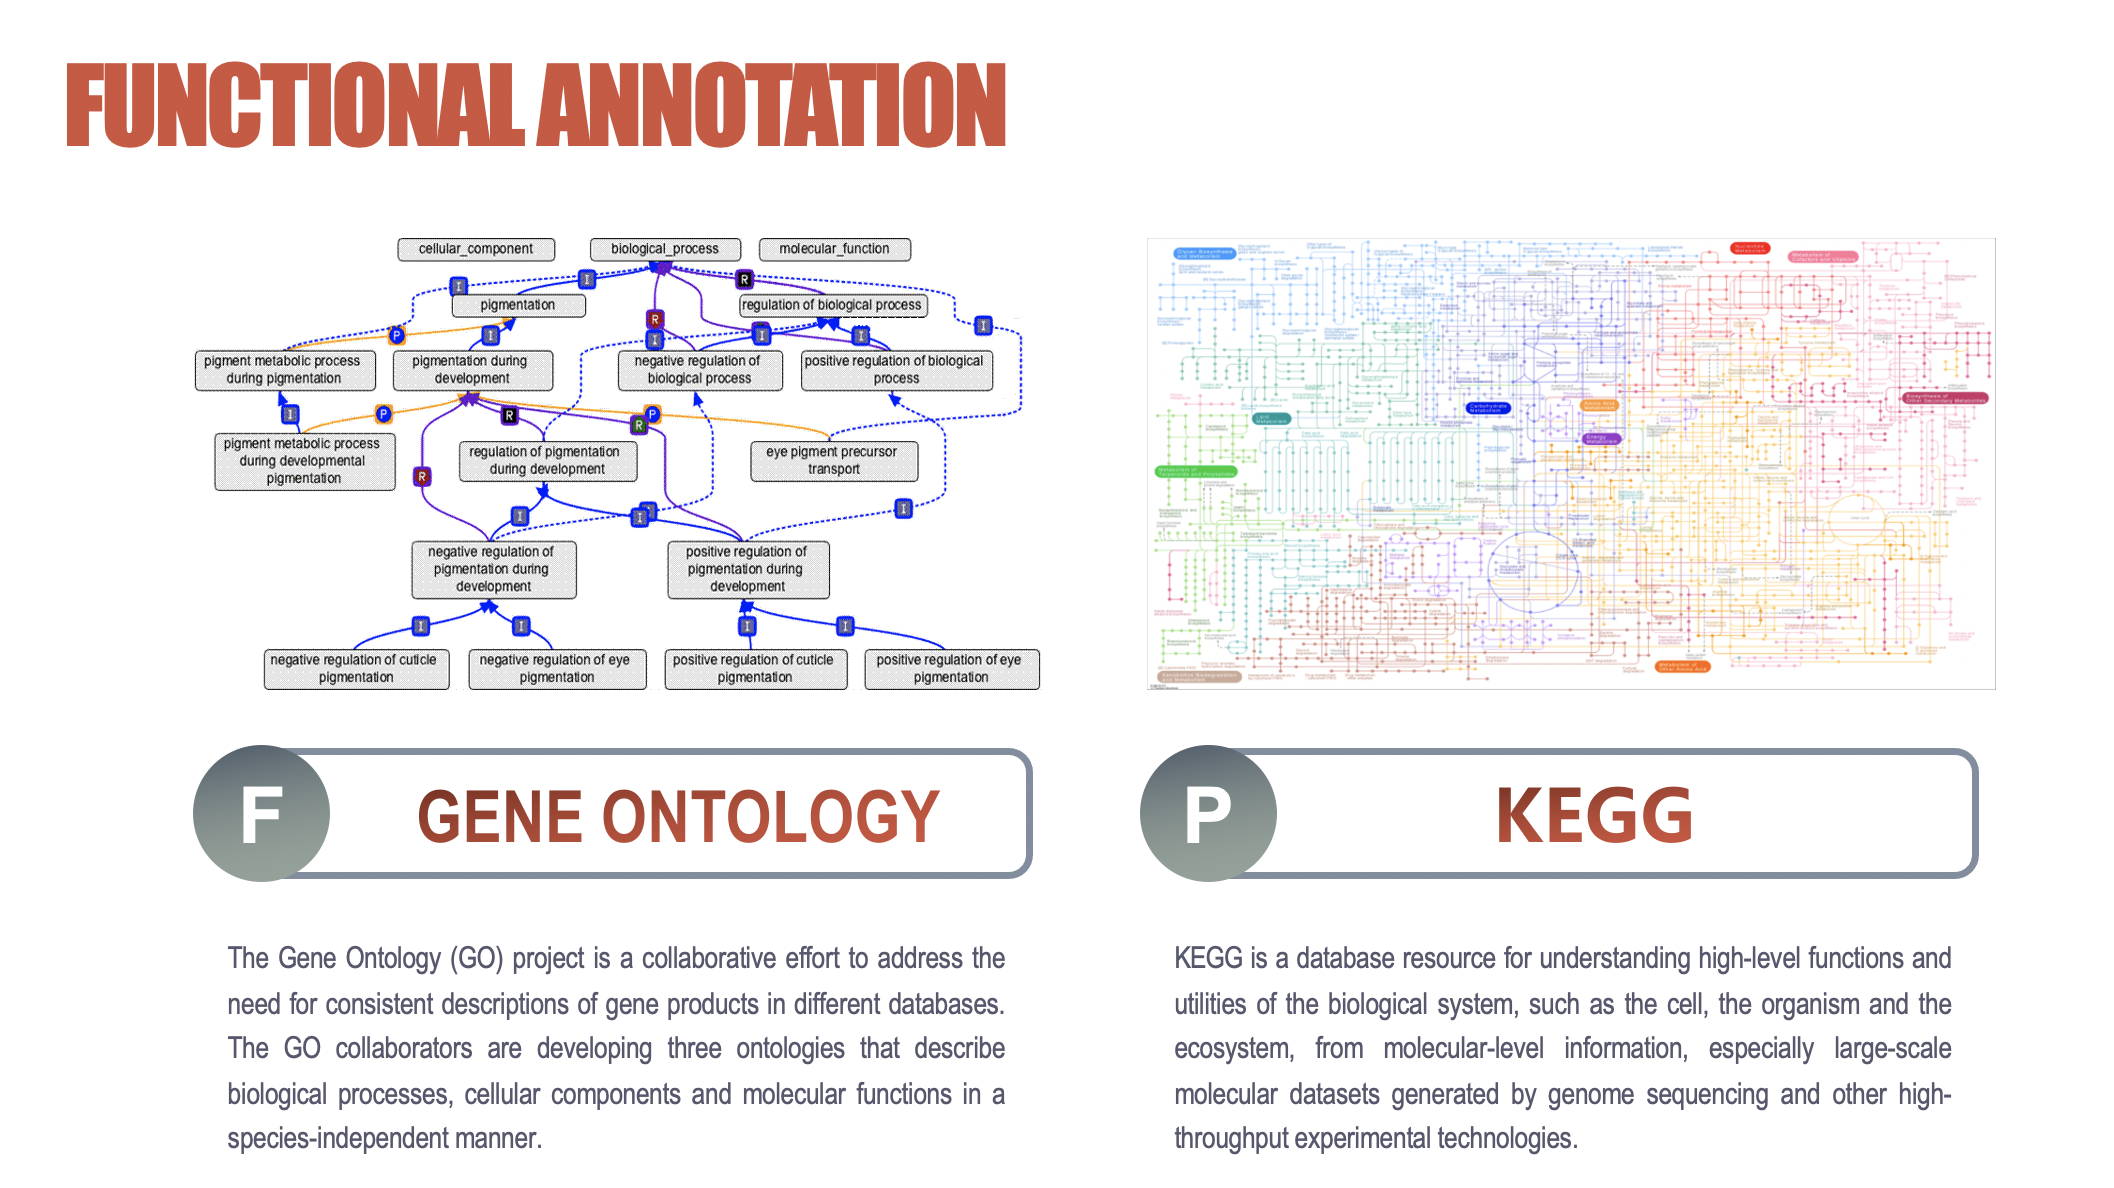
GO&KEGG
KEGG (https://www.kegg.jp/kegg/pathway.html) is a **database resource **for understanding high-level functions and utilities of the biological system, such as the cell, the organism and the ecosystem, from molecular-level information, especially large-scale molecular datasets generated by genome sequencing and other high-throughput experimental technologies.
GO:a major bioinformatics initiative to unify the representation of gene and gene product attributes across all species
- maintain and develop its controlled vocabulary of gene and gene product attributes
- annotate genes and gene products, and assimilate and disseminate annotation data;
- provide tools for easy access to all aspects of the data provided by the project
- enable functional interpretation of experimental data using the GO
Enrichment module gives you the answer of which pathways, diseases, and GO terms is statistically significant associated with the genes/proteins you just input.
Volcano Plot
a volcano plot is a type of scatter-plot that is used to quickly ==identify changes in large data sets composed of replicate data==.
- plots
significanceversusfold-changeon the y and x axes, respectively
A volcano plot combines:
- a measure of statistical significance from a statistical test (e.g., a P-value from an ANOVA model)
- the magnitude of the change, enabling quick visual identification of those data-points (genes, etc.) that display large magnitude changes that are also statistically significant. (Fold change)
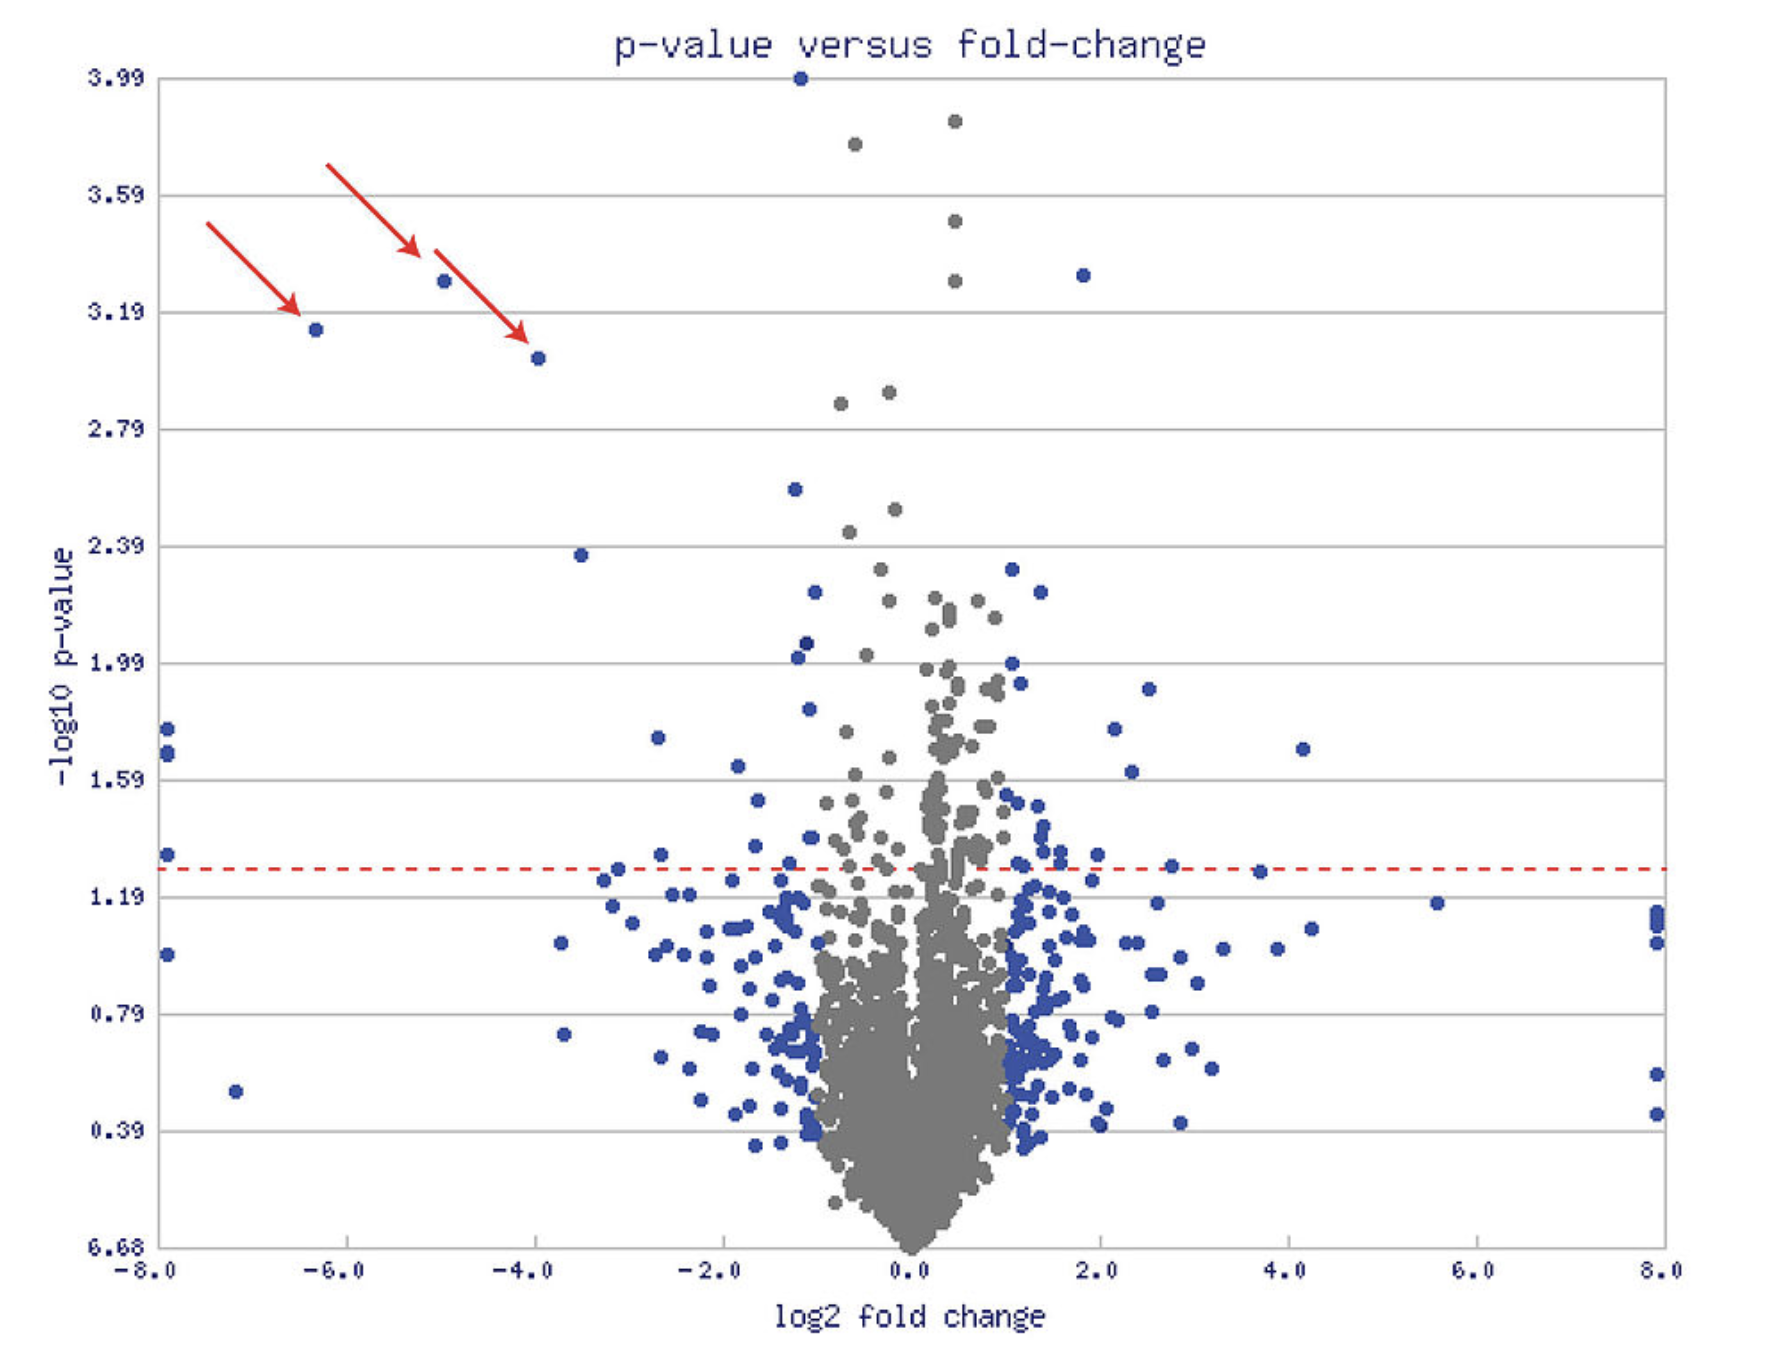
values that display large magnitude fold changes (hence being left or right of center) as well as high statistical significance (hence being toward the top).
Functional annotation
Proteomics Data anlysis
Essay 1: Given a set of proteins, briefly describe the steps for conducting GO annotation by Blast2GO. (20 points) Interpret the significance and potential application of GO annotation. (20 points) Use your own words (a maximum of 500 words).
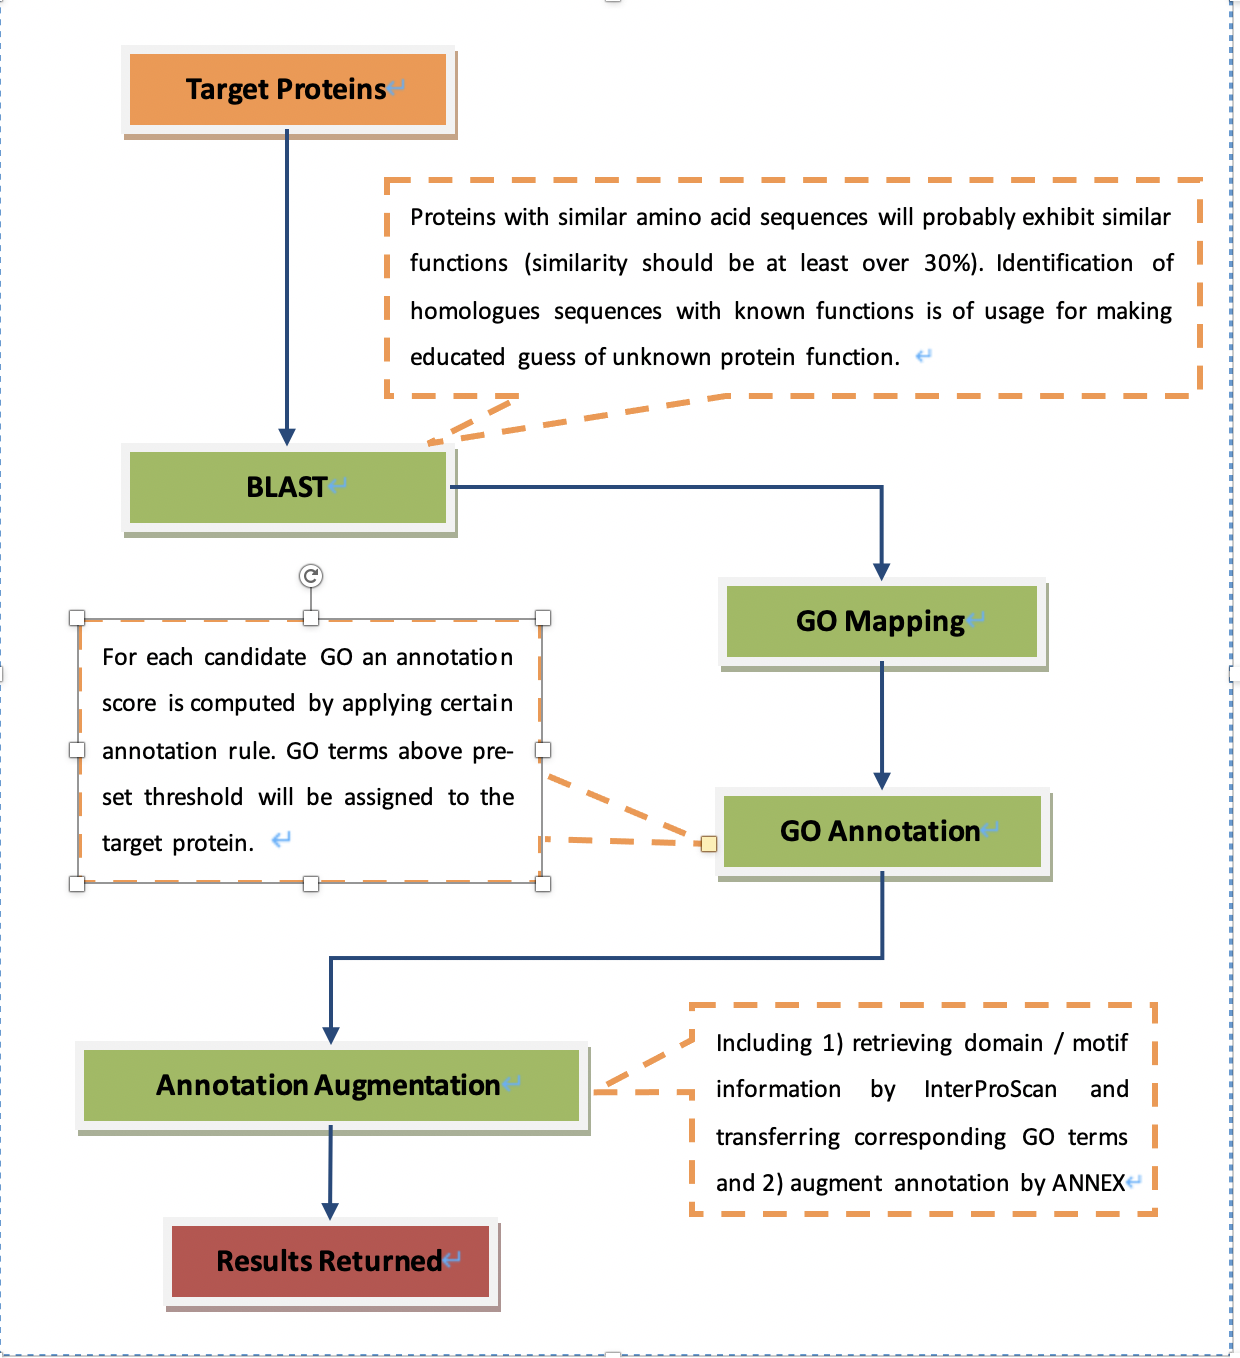
- To provide knowledge of roles in biological processes, molecular functions and cellular components for each target protein.
- To provide knowledge of significantly altered biological processes, molecular functions and cellular components and associated target proteins.
DAVID
Blast2GO
Similarity – at least 30%
GO evidence codes - to indicate how the annotation to a particular term is supported
- experimental evidence
- phylogenetic evidence
- computational evidence
- author statements
- curatorial statements
- automatically generated annotations
Essay 2: Given a set of proteins, briefly describe the steps for conducting KEGG based pathway annotation by KOALA. (20 points) Interpret the significance and potential application of KEGG annotation. (20 points) Use your own words (a maximum of 500 words).
pathway annotation
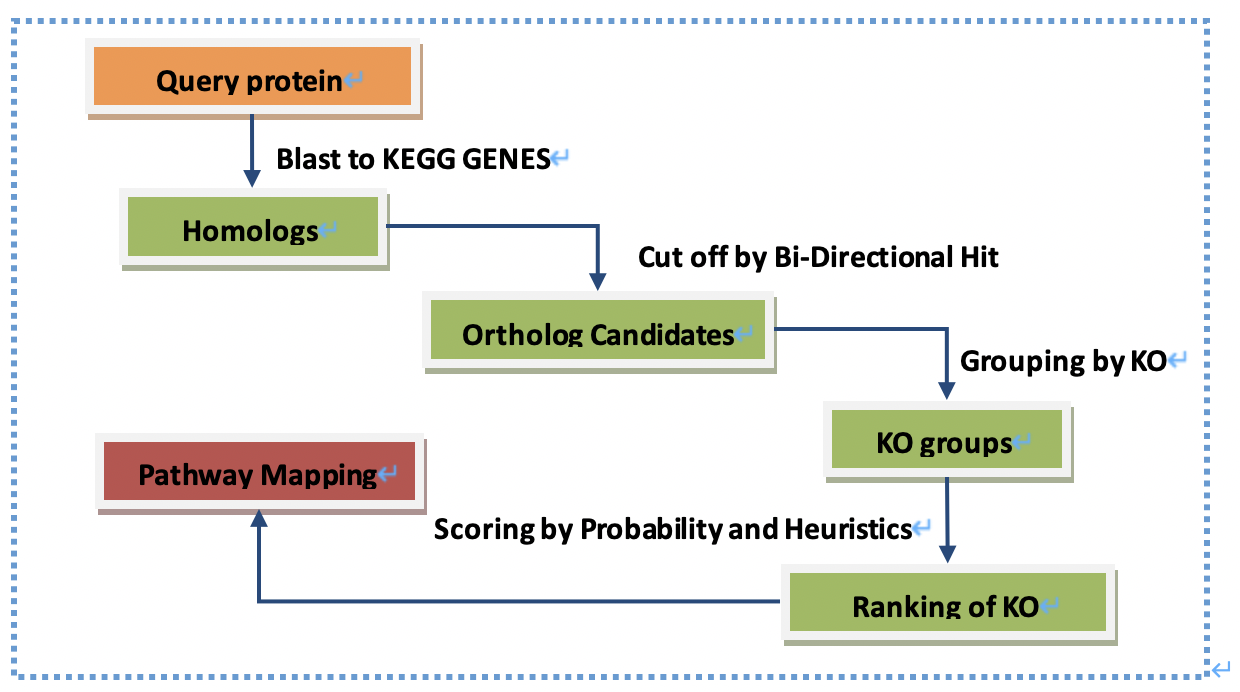
To provide knowledge of roles in biological pathways for each target protein.
To provide knowledge of significantly altered biological pathways and associated target proteins.
Metabolomics Data Analysis
Problem Scenario
The example used is compound concentration data obtained by targeted (i.e. quantitative) metabolic profiling of 1H NMR spectra of urine samples collected from 57 cancer patients.
There are two groups of patients
– Cachexia (Y) refers to the group with significant skeletal muscle loss;
– Cachexia (N) refers to the group with no obvious skeletal muscle loss.
Cachexia is defined as the loss of weight, muscle atrophy, fatigue, weakness and significant loss of appetite in someone who is not actively trying to lose weight.
Cachexia is often seen in end-stage cancer, and in that context is called “cancer cachexia”.
The exact mechanism behind cachexia is poorly understood, but there is probably a role for inflammatory cytokines, such as tumor necrosis factor-alpha (TNF-α) - which is also nicknamed cachexin, Interferon gamma (IFNγ), and Interleukin 6 (IL-6).
The goal here is, by using methods provided ==in MetaboAnalyst==, to identify metabolites that are significantly different between these two groups of cancer patients (cachexic vs. non-cachexic). These metabolites could serve as potential early-stage biomarkers for detecting cachexia and for exploring its underlying metabolic basis. The data file is ready on ICE.
Statistical Analysis
A wide array of commonly used statistical and machine learning methods are available:
- univariate:
- fold change,
- t-test,
- volcano plot,
- ANOVA,
- correlation analysis;
- multivariate:
- principal component analysis (PCA),
- partial least squares-discriminant analysis (PLS-DA)
- orthogonal partial least squares-discriminant analysis (OPLS-DA)
- high-dimensional feature selection - significance analysis of microarrays (and metabolites) (SAM)
- empirical Bayesian analysis of microarrays (and metabolites) (EBAM)
- clustering - dendrogram, heatmap, K-means, and self organizing map (SOM))
- supervised classification - random forests and support vector machine (SVM).
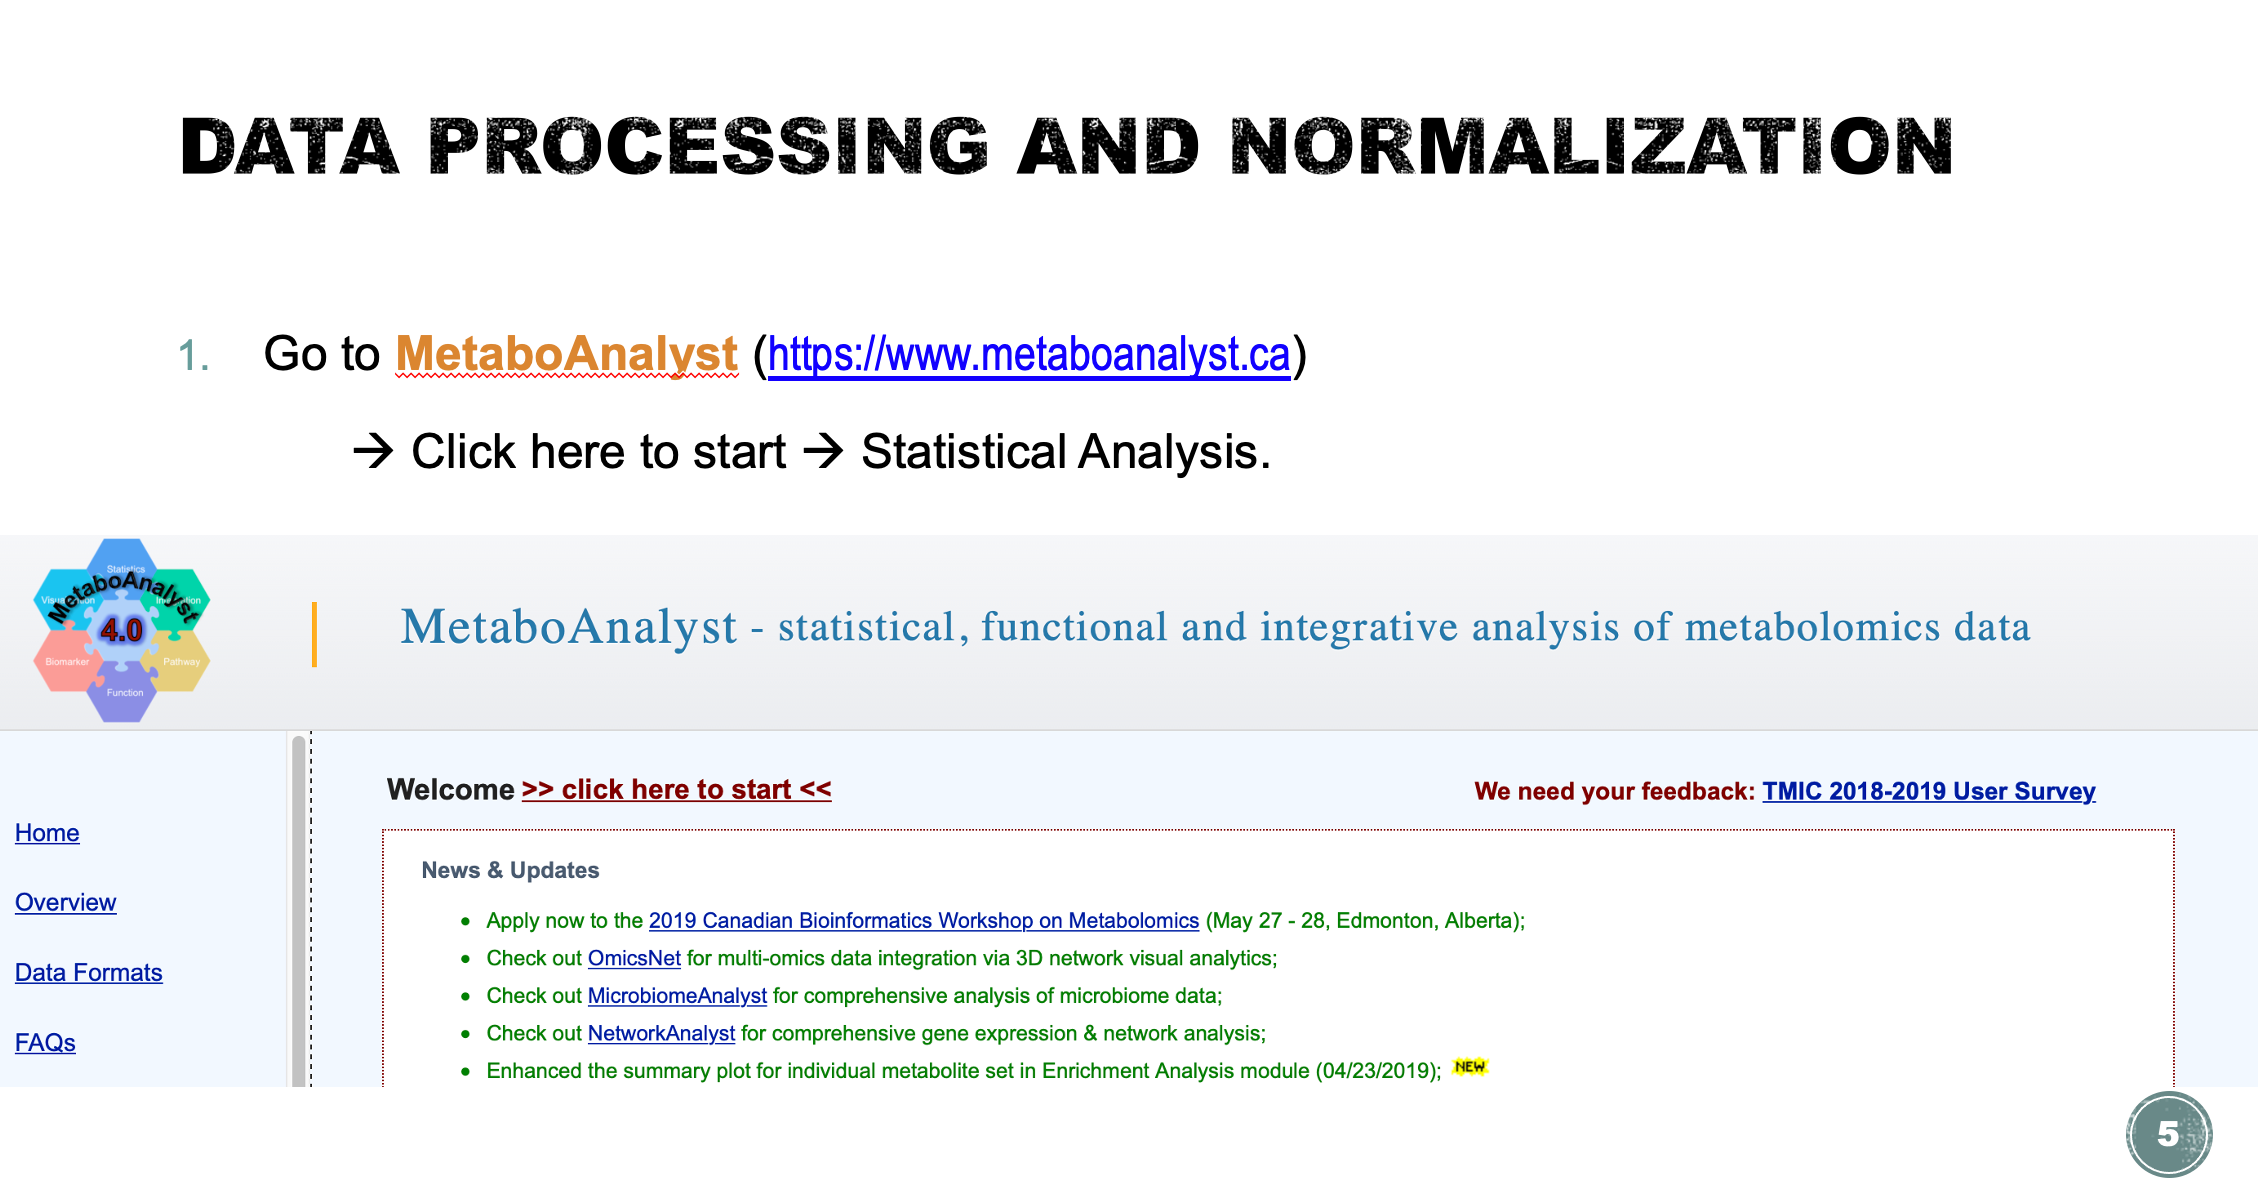
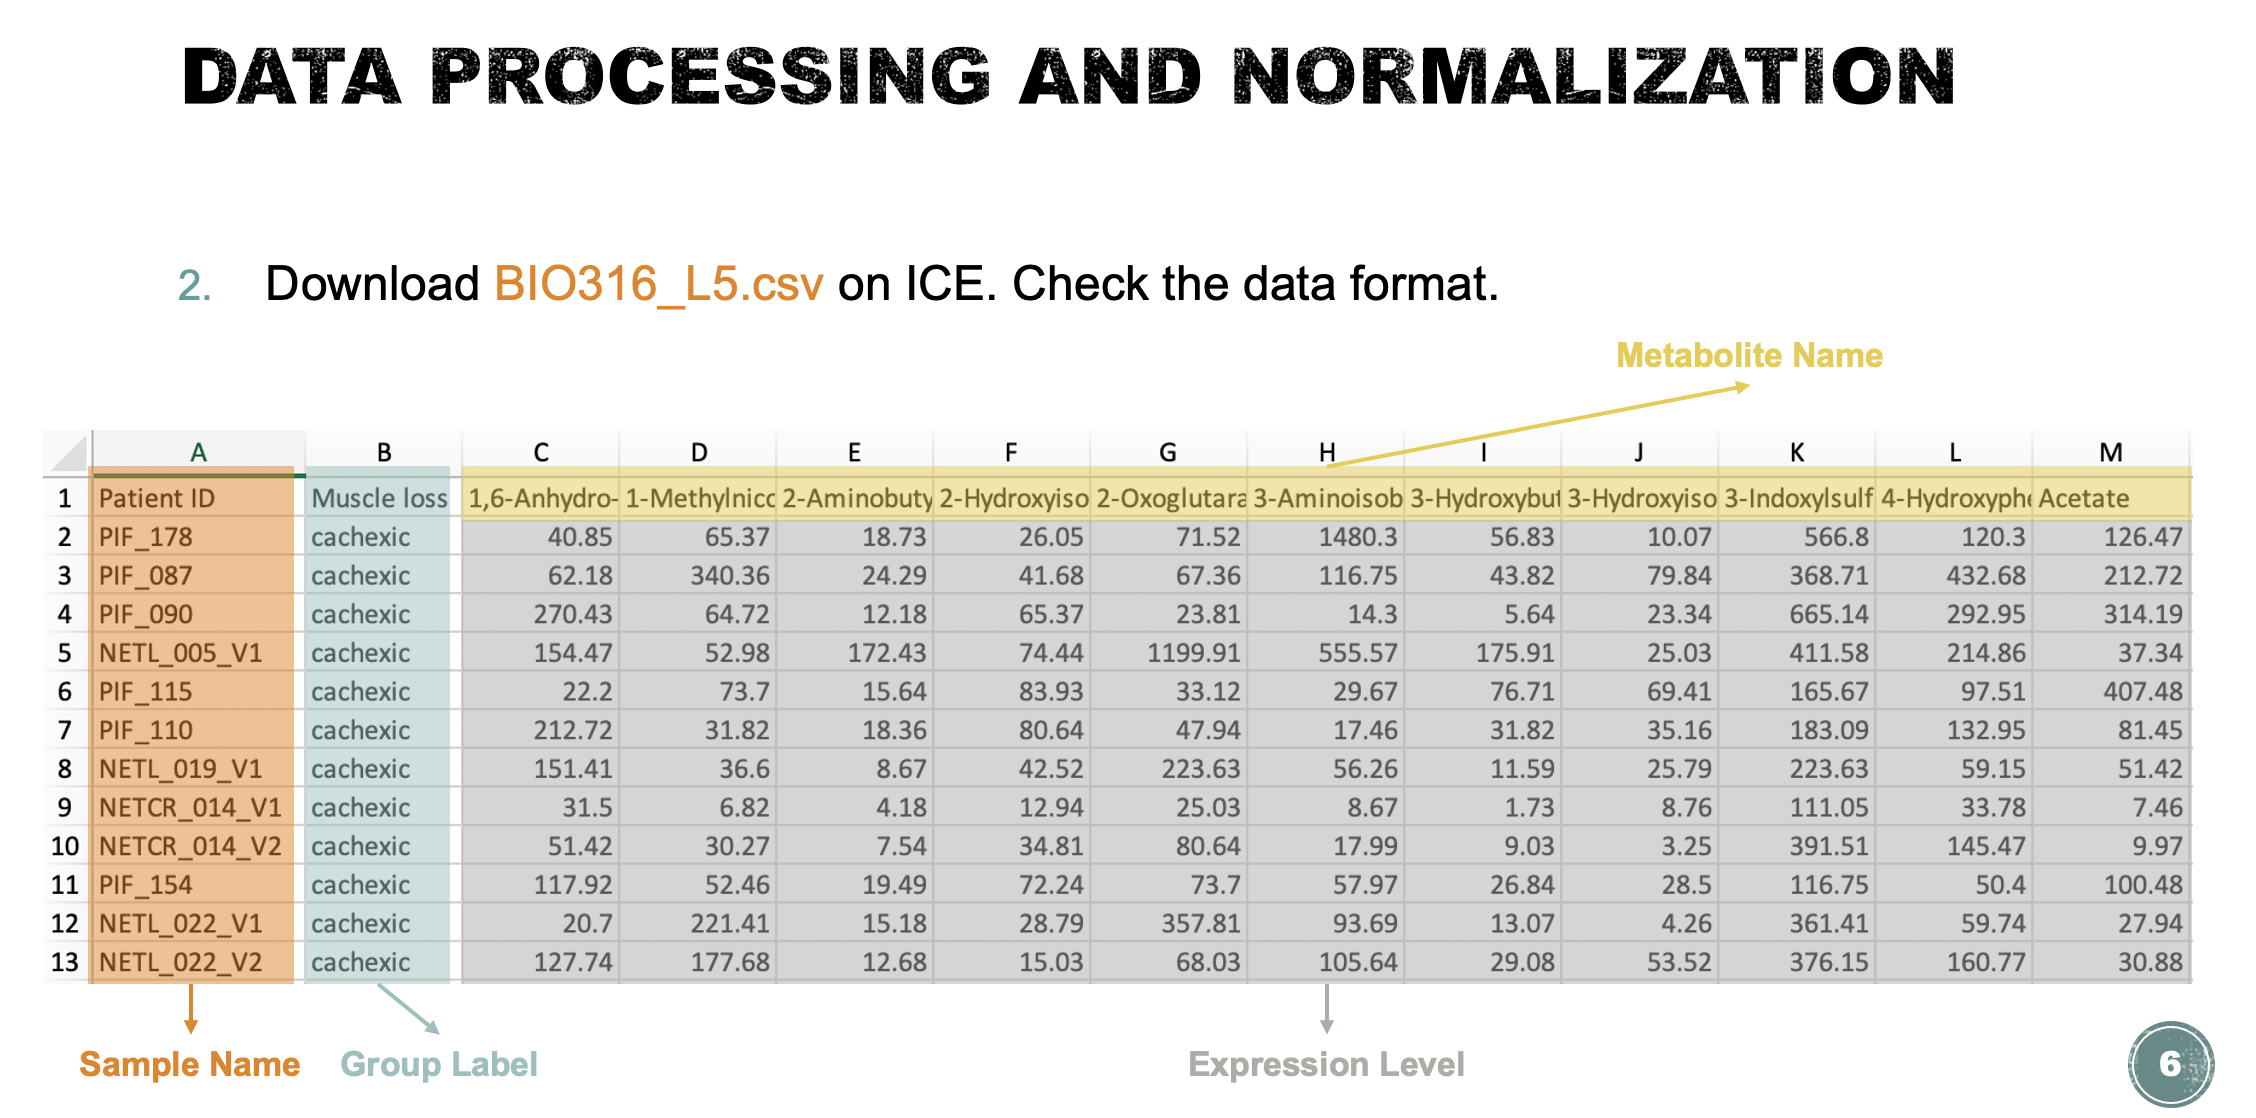
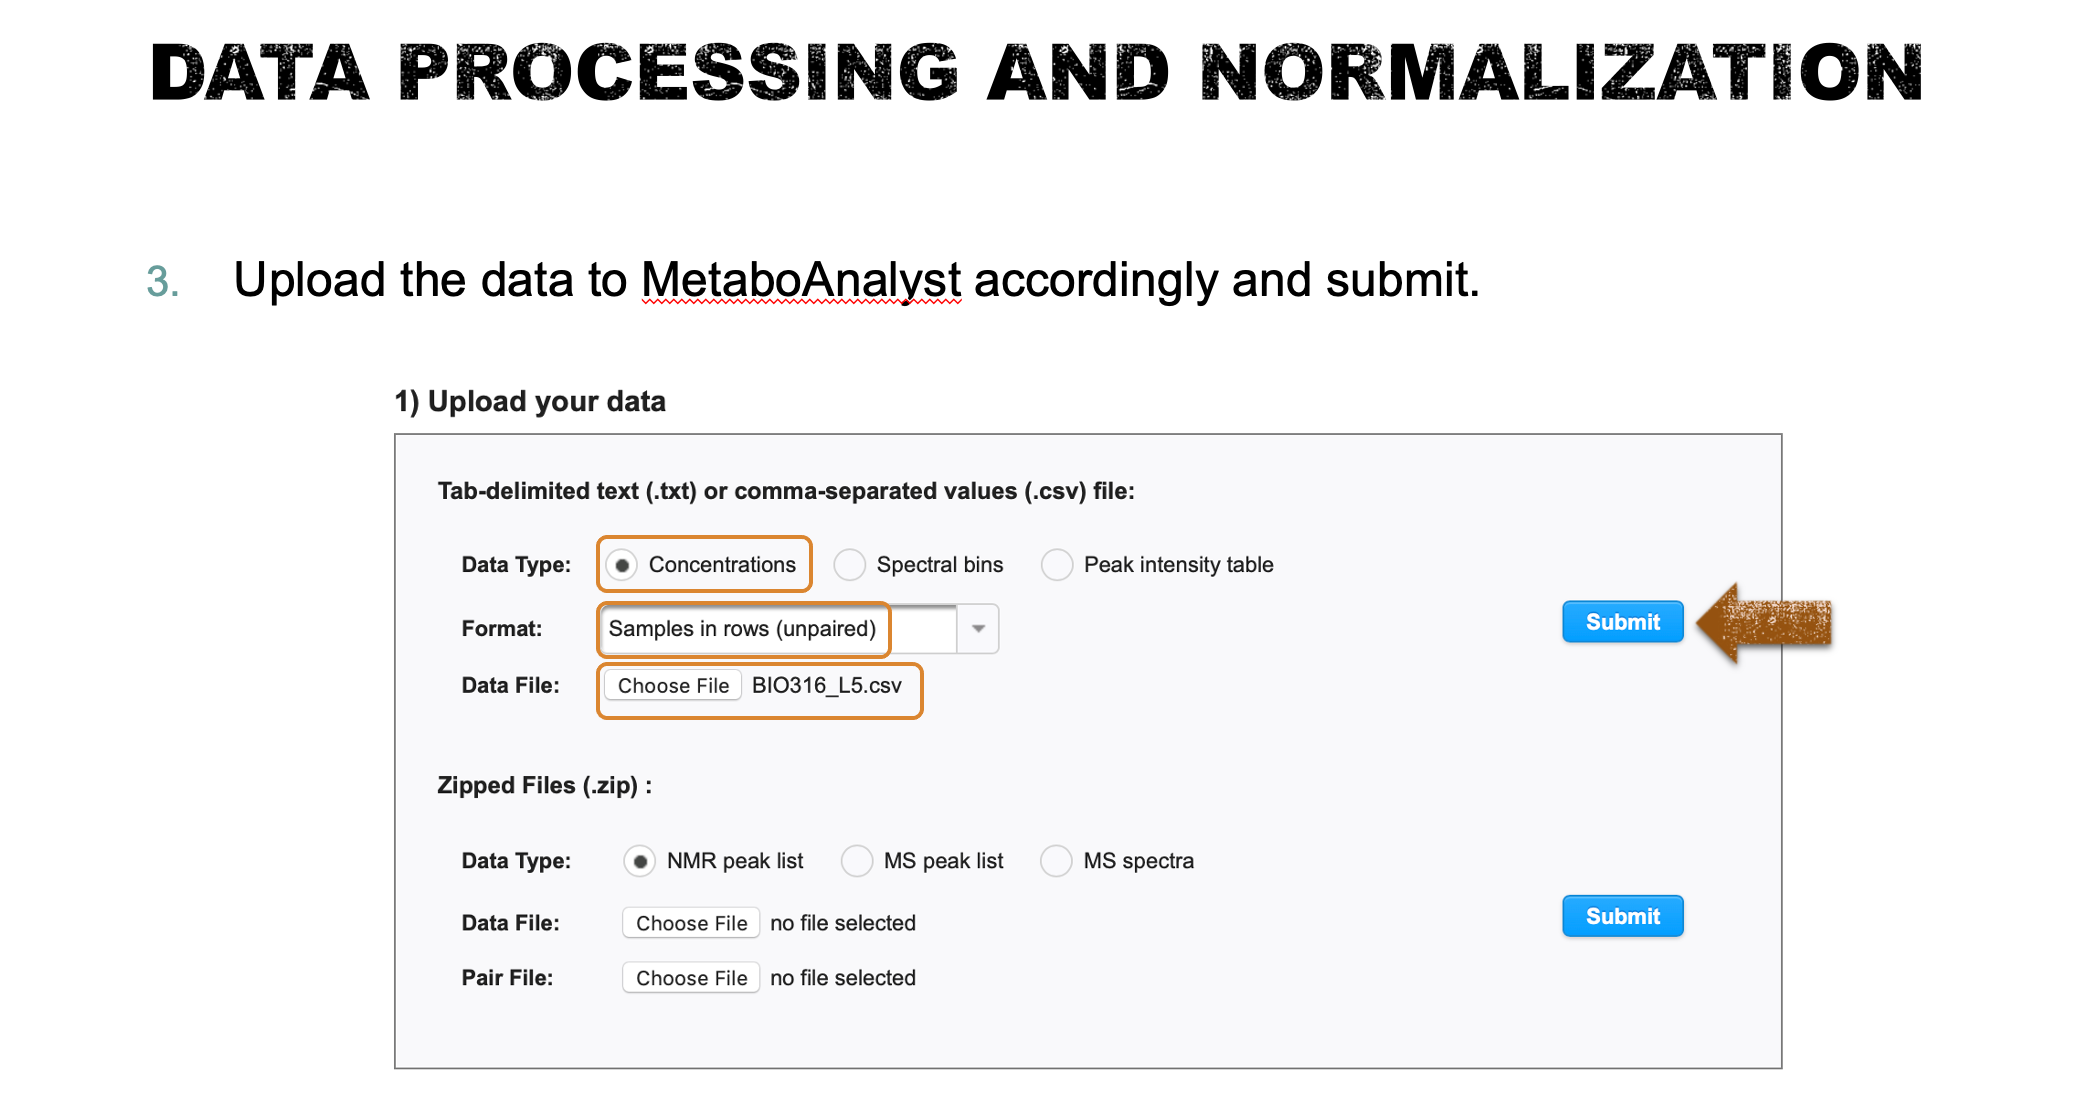
Task 1: Data processing and normalization (Lab demo)
Row-wise normalization: aims to normalize each sample (row) so that they are comparable to each other
column wise normalization aims to make each feature much more comparable in magnitude to each other
Task1 Data processing and normalization (15 points).
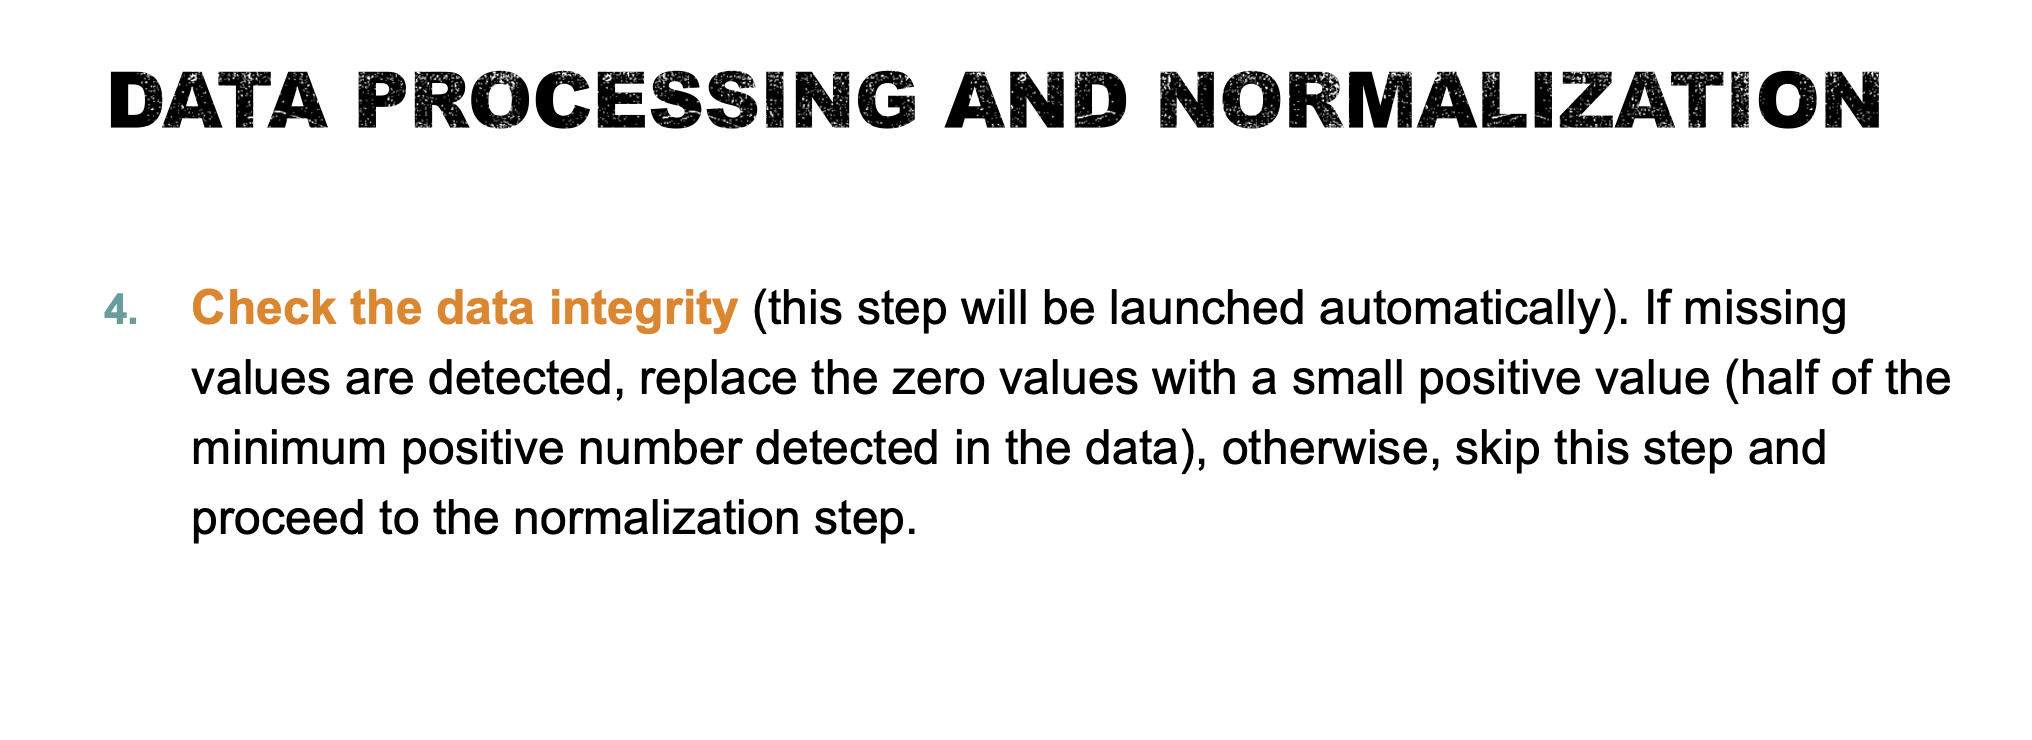
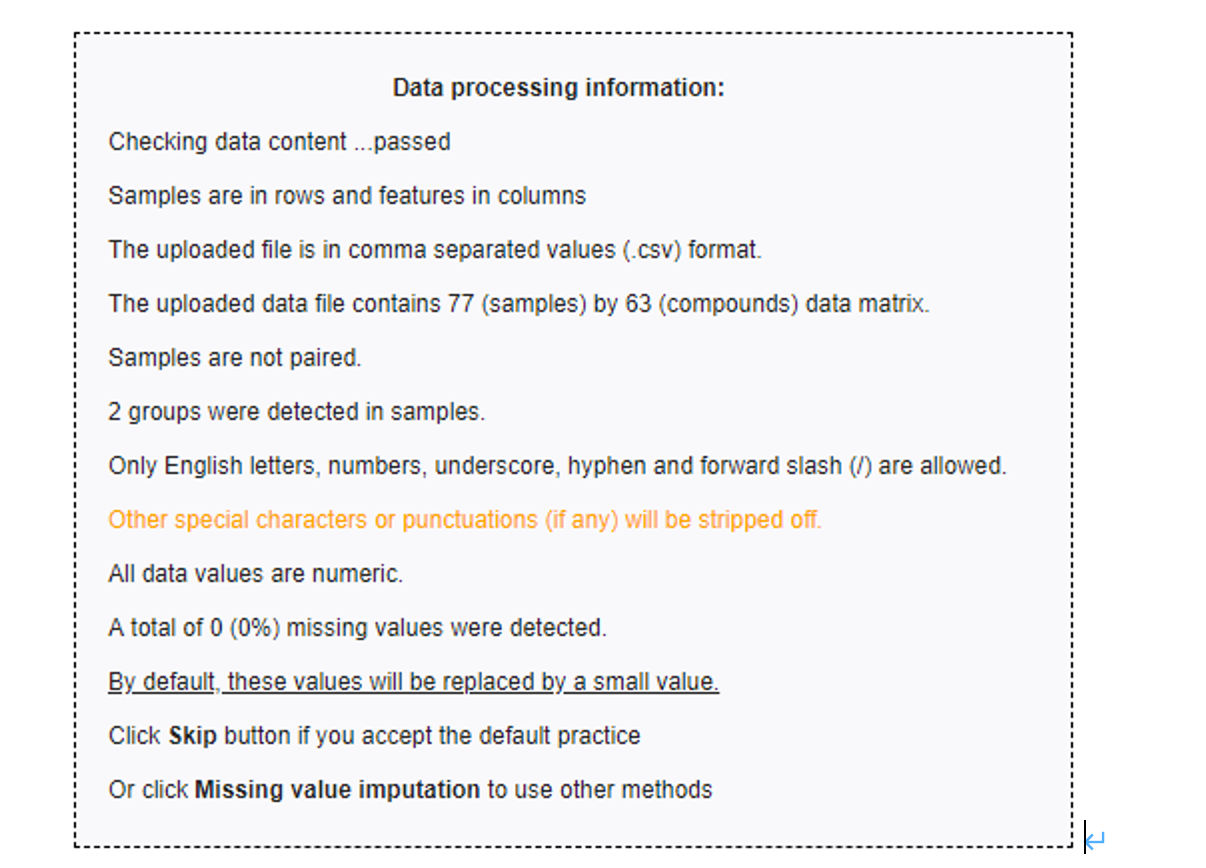
- Check the data format and upload the data to MataboAnalyst. Check the data integrity (this step will be launched automatically) and briefly describe your findings. if missing values are detected, replace the zero values with a small positive value (half of the minimum positive number detected in the data), otherwise, skip this step and proceed to the normalization step (5 points).
The data integrity check run automatically and the result is shown below. For lists of concentrations the data integrity check will assess the content (look for consistent formatting and the presence of two groups), determine whether the data is paired or determine if negative numbers exists. In this case, no missing values were identified in the data. Since zero values may cause some algorithms not to work properly, MetaboAnalyst will replace these values with a small positive value (the half of the minimum positive number detected in the data).
notes
- Assess the content
- determine whether the data is paired
- determine if negative numbers exists
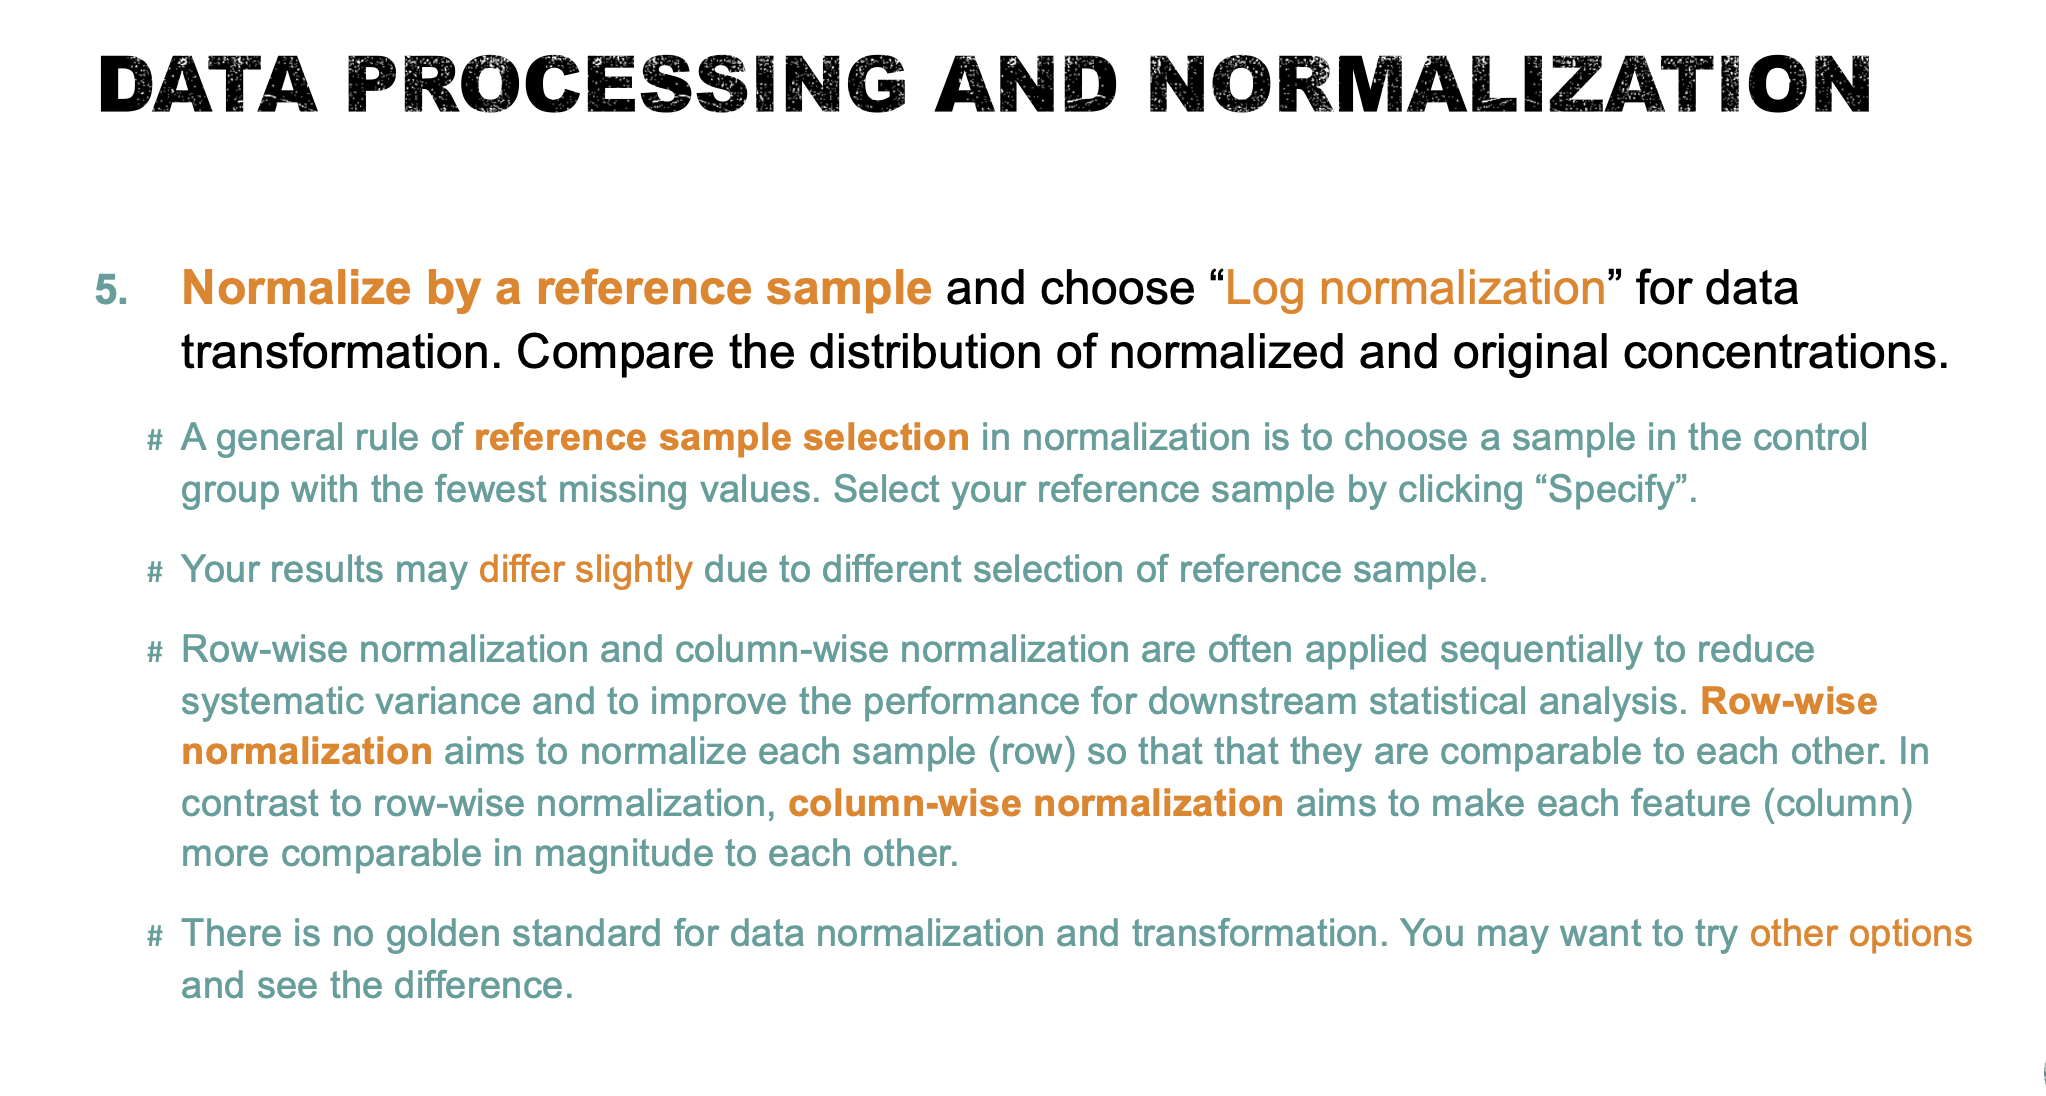
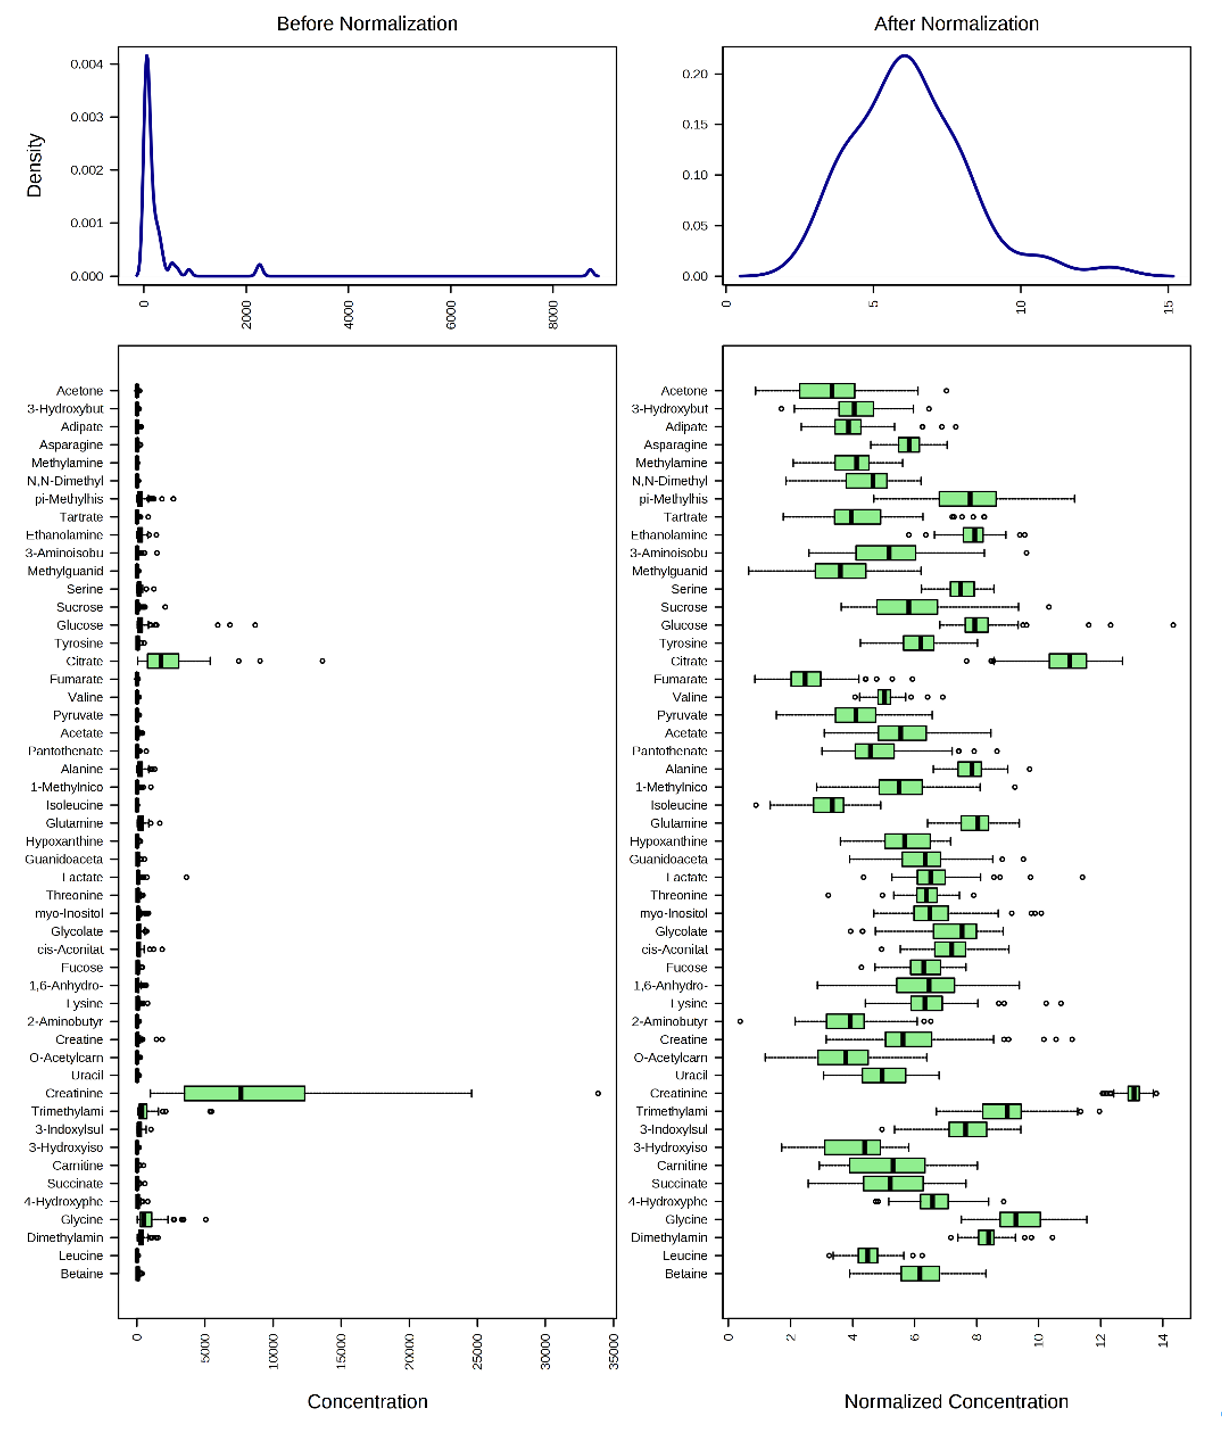
- Normalize to a reference sample (refer to the lab notes for the general rule of reference sample selection) and choose “Log normalization” for data transformation. Compare the distribution of normalized and original concentrations (5 points). Briefly describe the outcome and the purpose of data normalization (5 points).
The distribution of normalized and original concentrations is shown below. A general rule of reference sample selection in normalization is to choose a sample in the control group with the fewest missing values. In this case, NETCR_005_V1 was used as the reference sample for row-wise normalization.
The internal data structure is transformed now to a table with each row representing a urine sample (from a patient) and each column representing a feature (a compound with a concentration). Row-wise normalization and column-wise normalization are often applied sequentially to reduce systematic variance and to improve the performance for downstream statistical analysis. Row-wise normalization aims to normalize each sample (row) so that that they are comparable to each other. In contrast to row-wise normalization, column-wise normalization aims to make each feature (column) more comparable in magnitude to each other.
Task 2: Identification of significantly different metabolites (50 points).
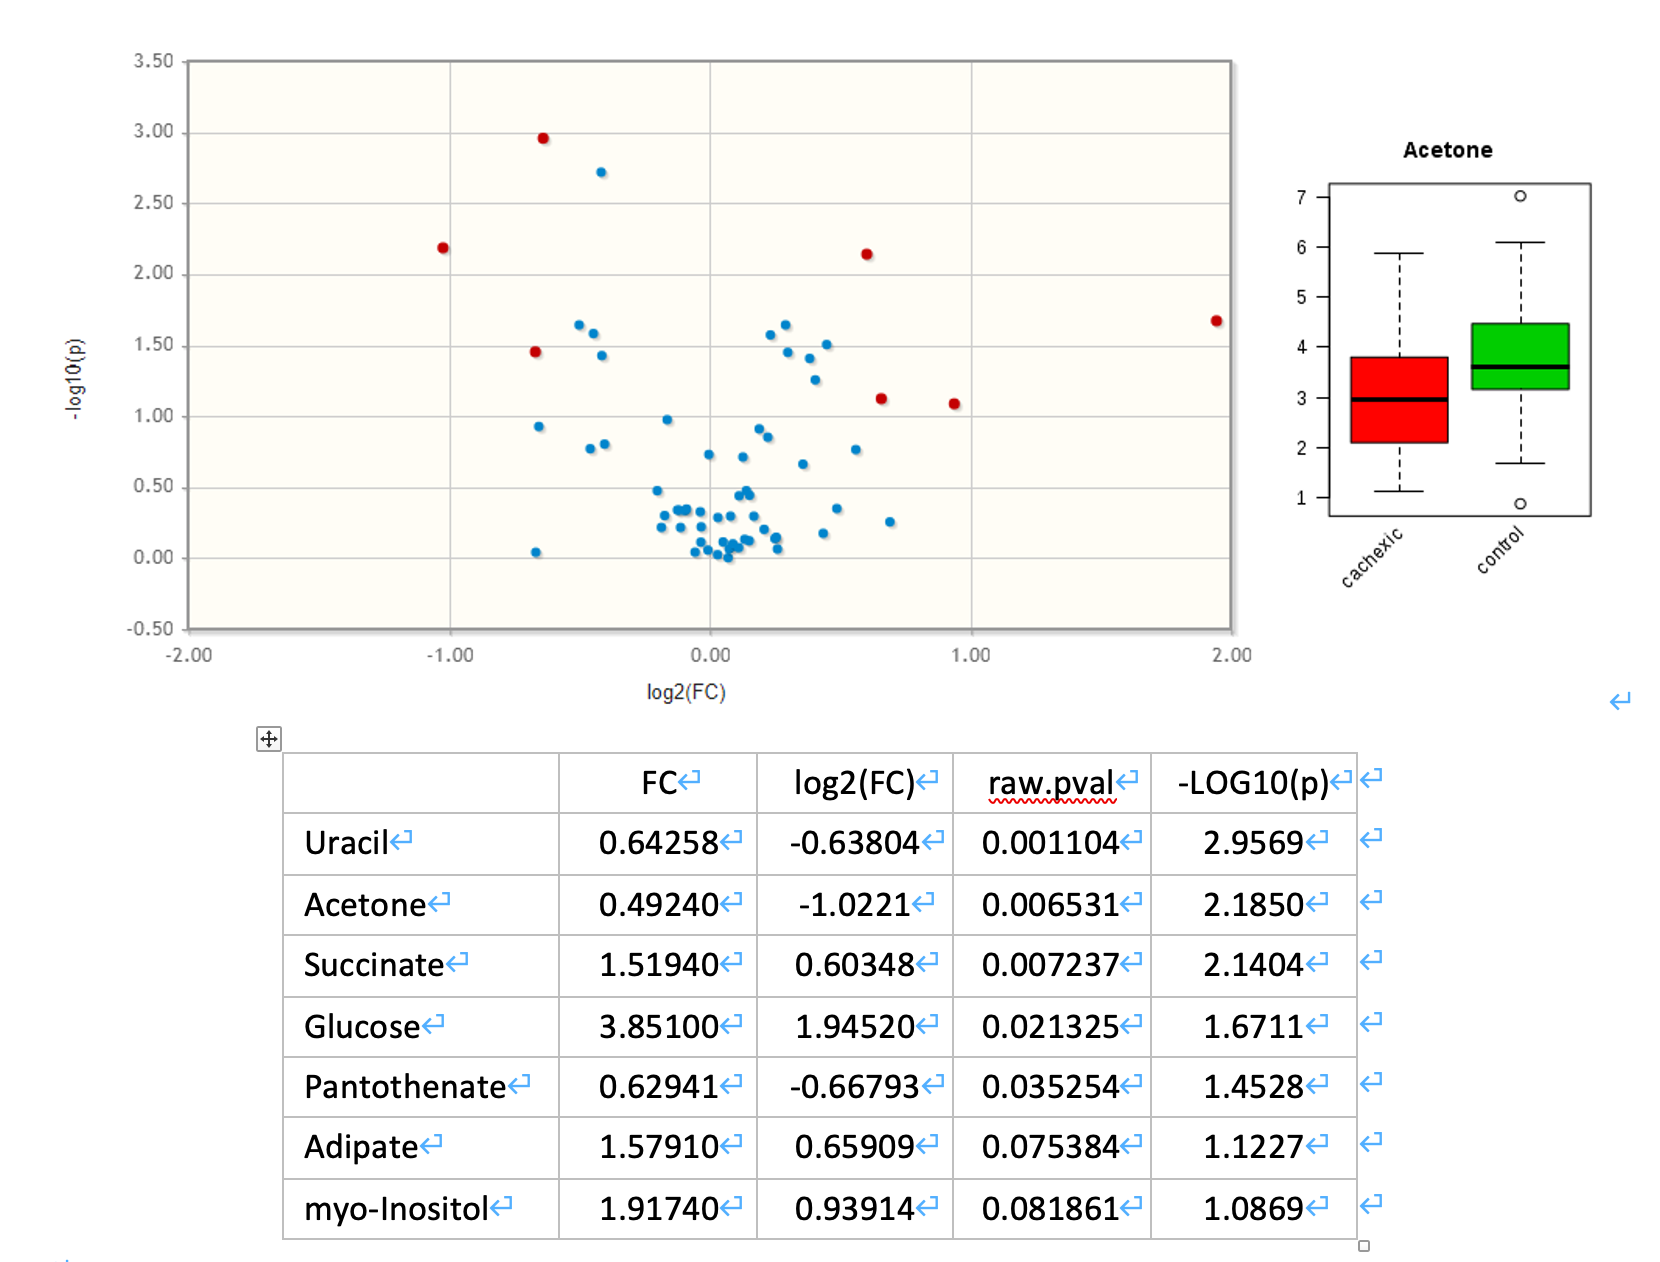
- Use a Volcano Plot to compare the size of the fold change and statistical significance level of metabolites between the two sample groups. Use a fold change threshold 1.5 and adjusted P-value threshold 0.1. Save your results and briefly interpret your findings (10 points).
Volcano plot
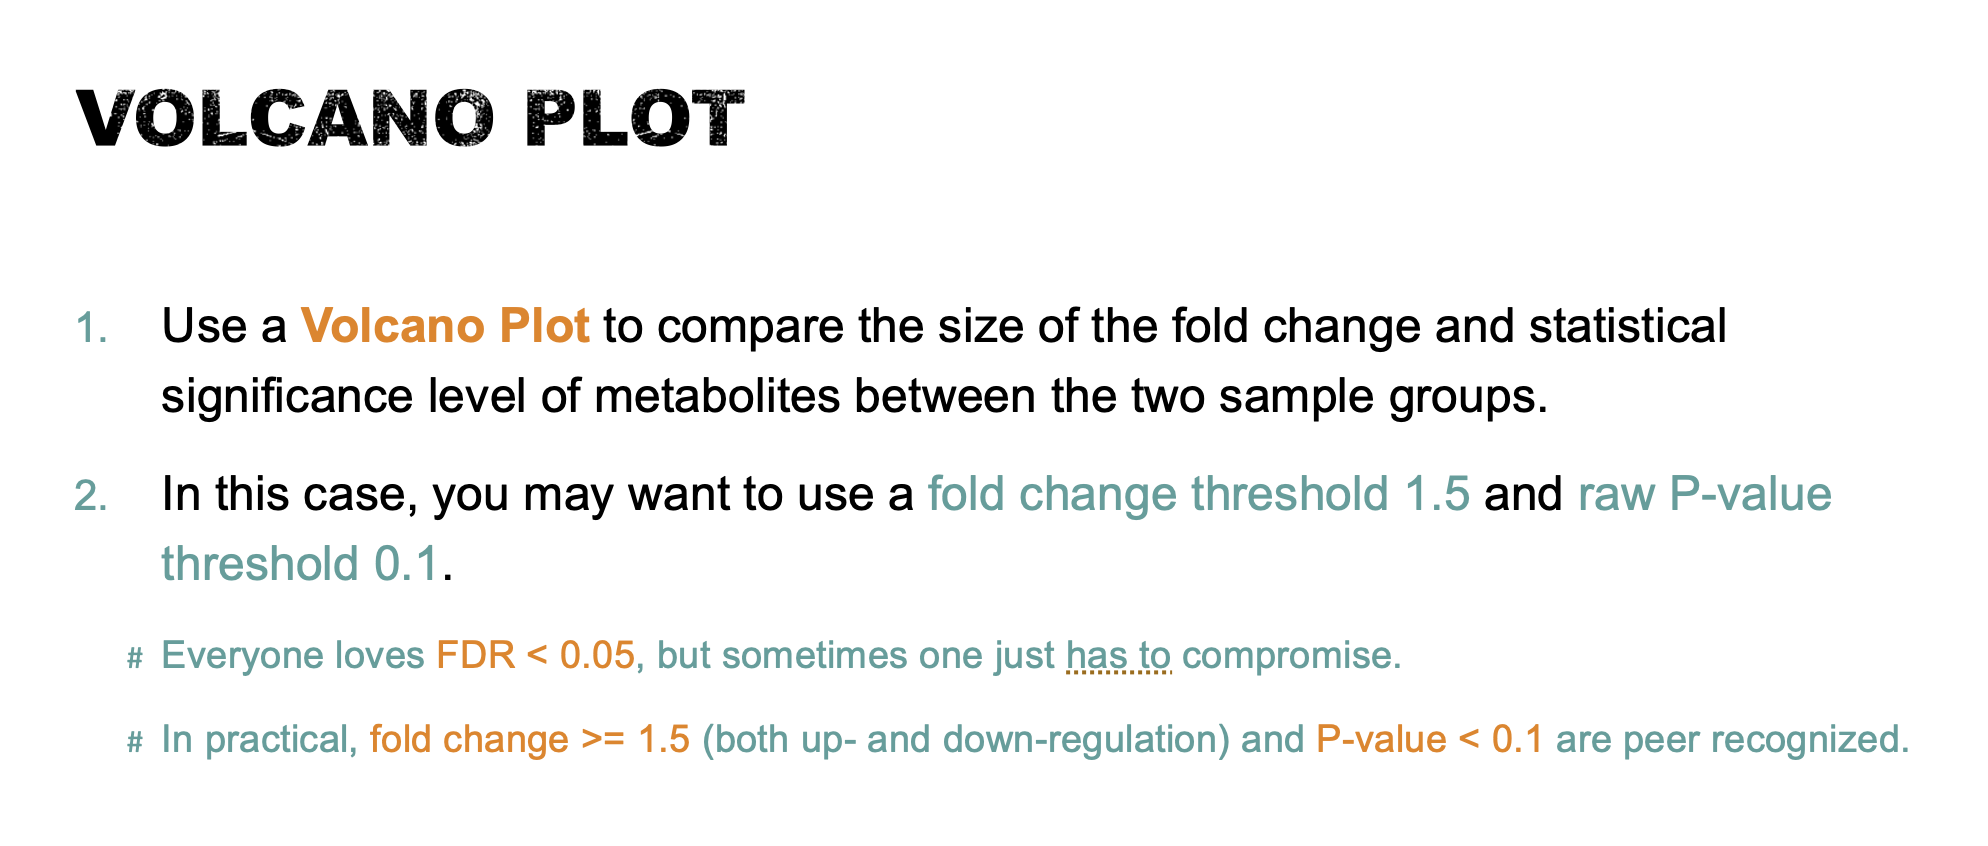
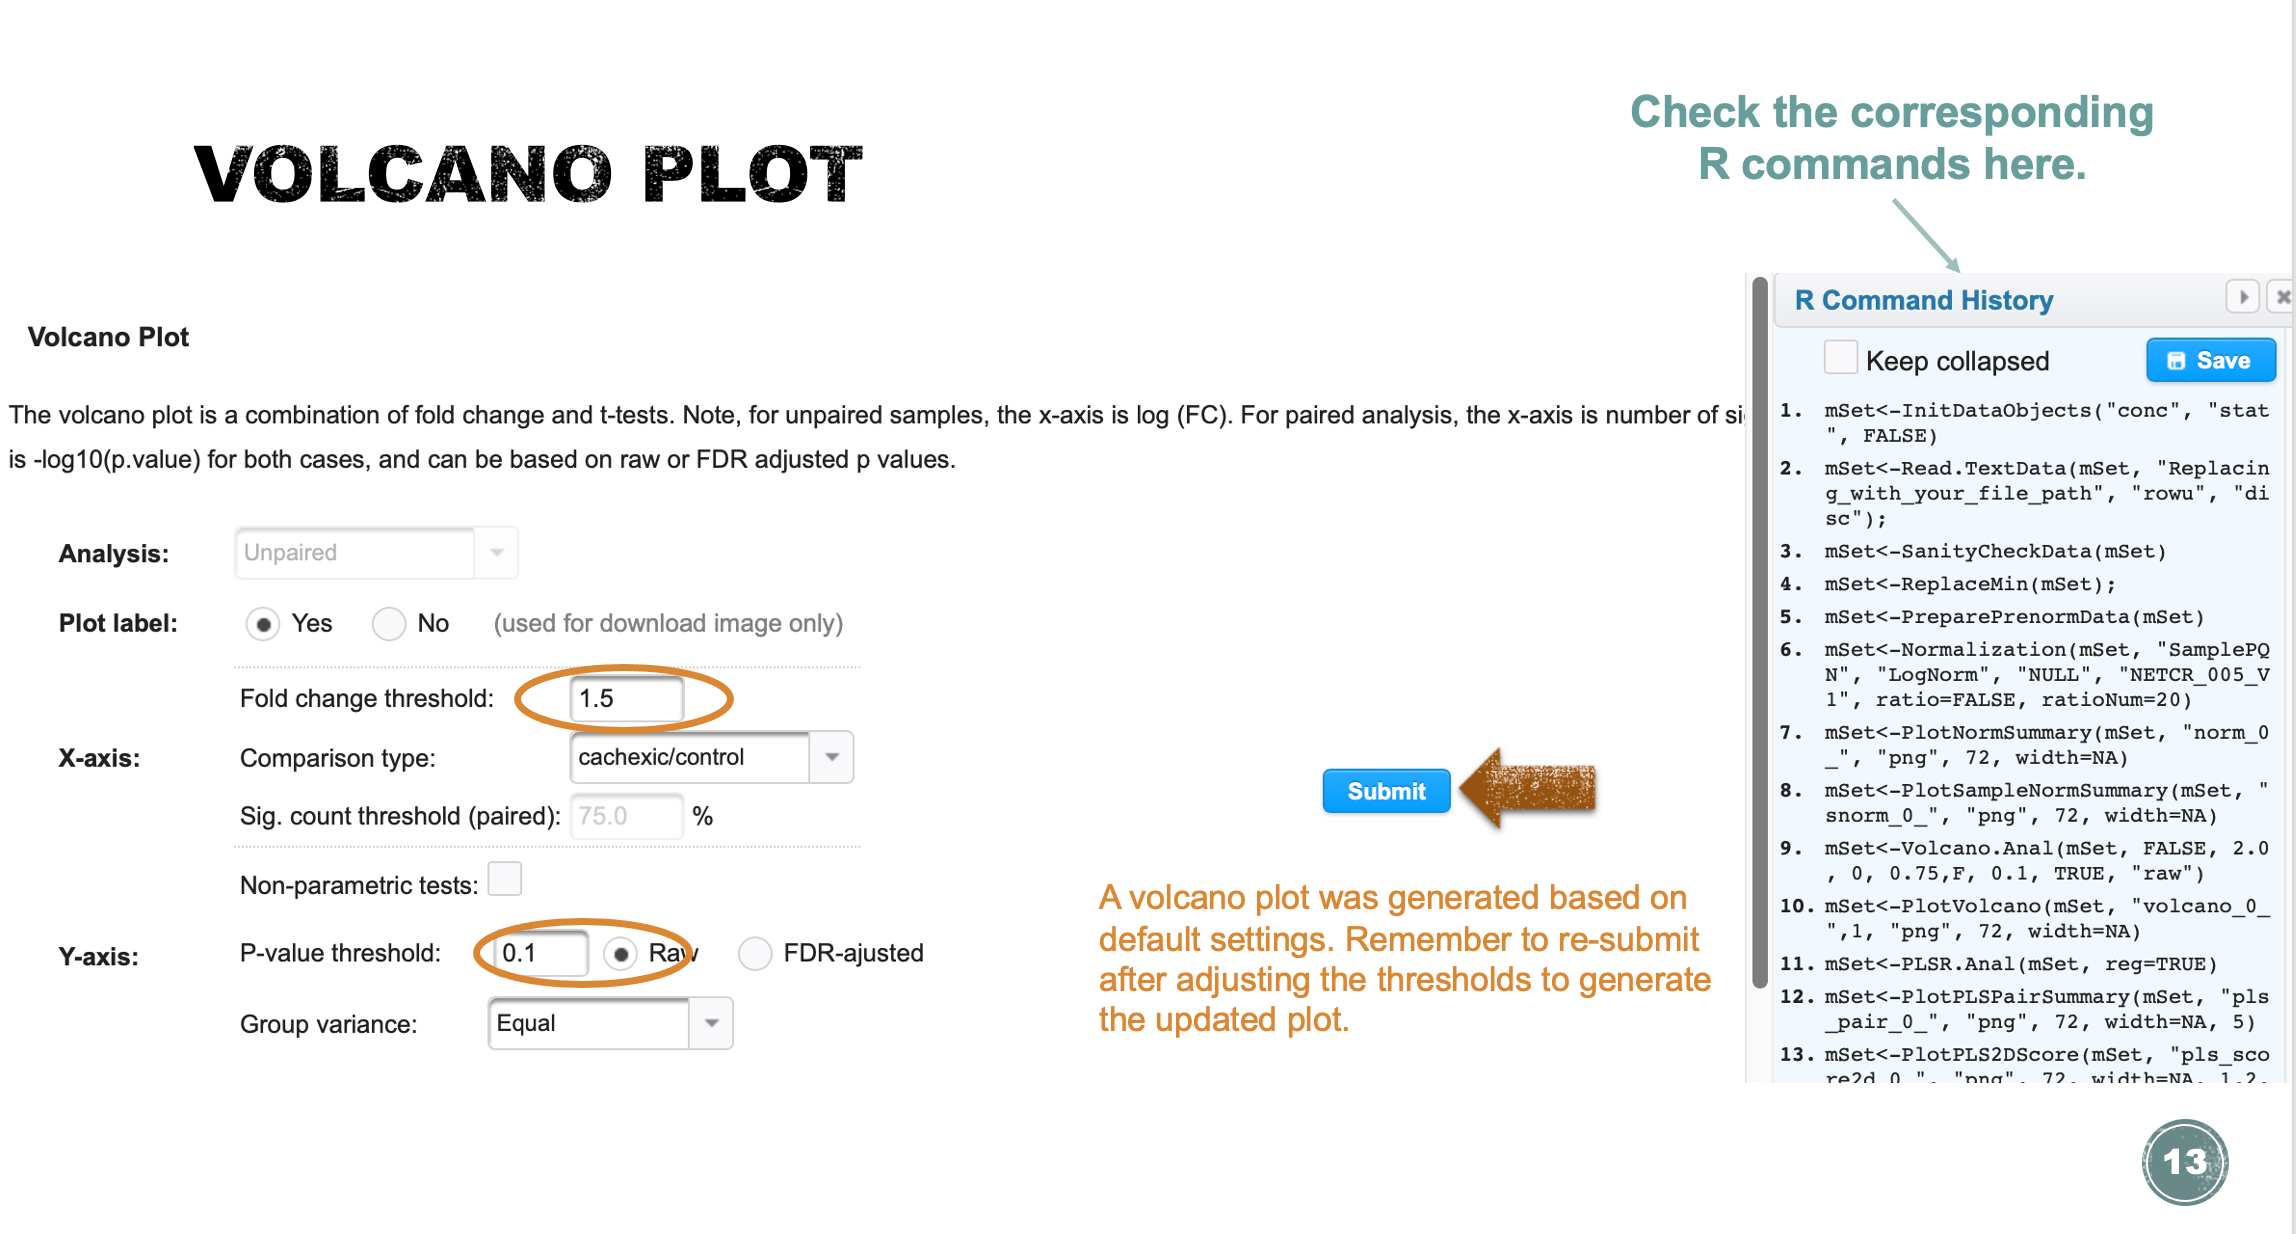
Volcano Plot is a commonly used univariate analysis method that is often first used to obtain an overview of the data or a rough ranking of potentially important features. Volcano plots are used to compare the size of the fold change to the statistical significance level. The X axis plots the fold change between the two groups (on a log scale), while the Y axis represents the p-value for a t-test of differences between samples (on a negative log scale). As a result, seven metabolites were identified as significantly different between the two groups by Volcano Plot analysis (see the table below).
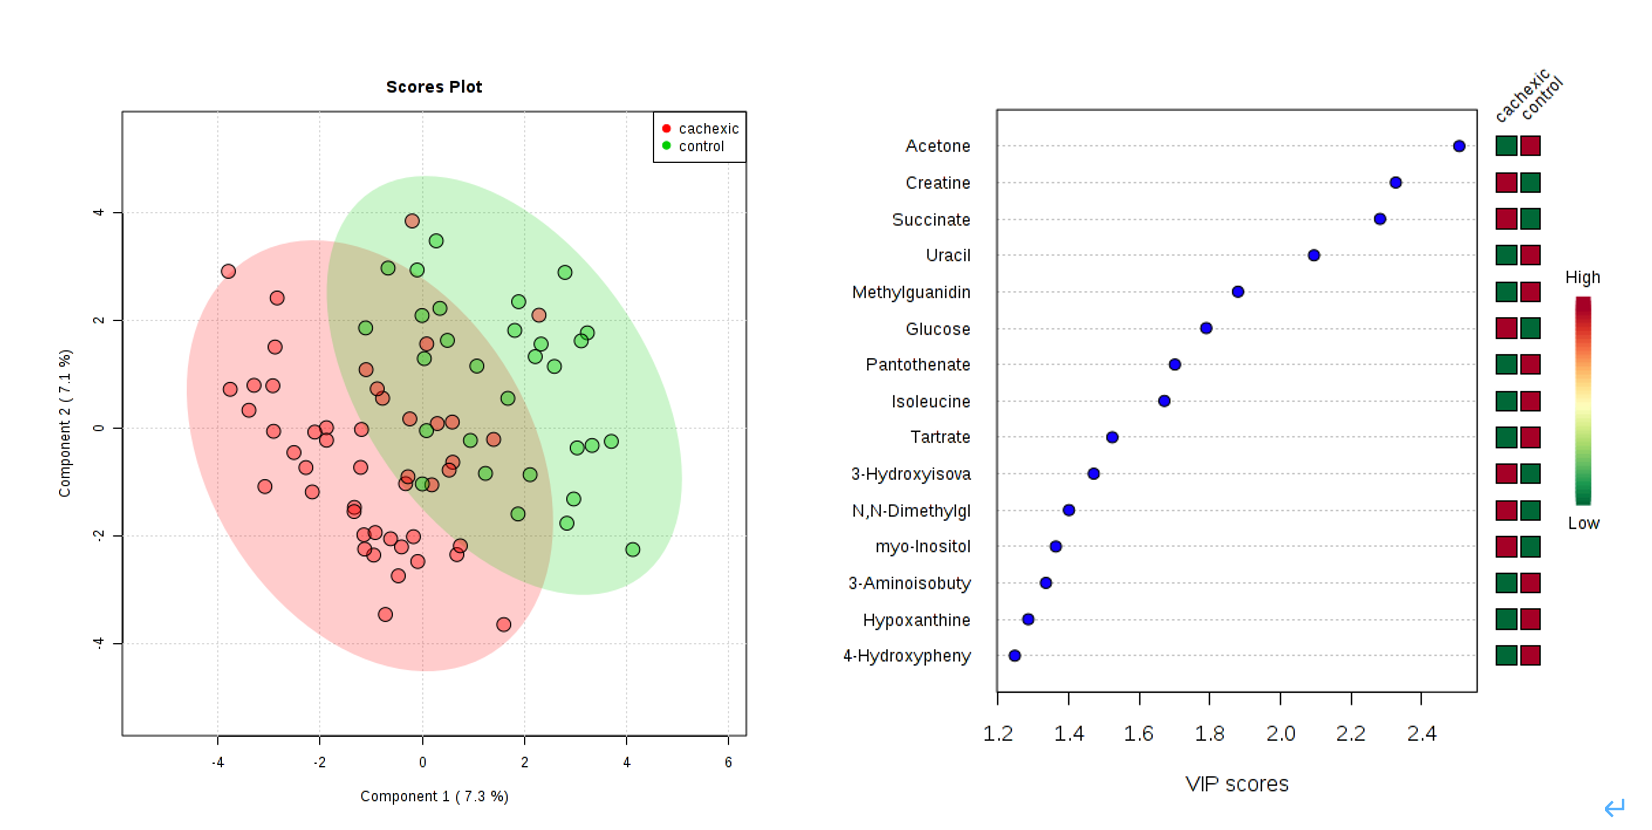
PLS-DA(lab explanation)
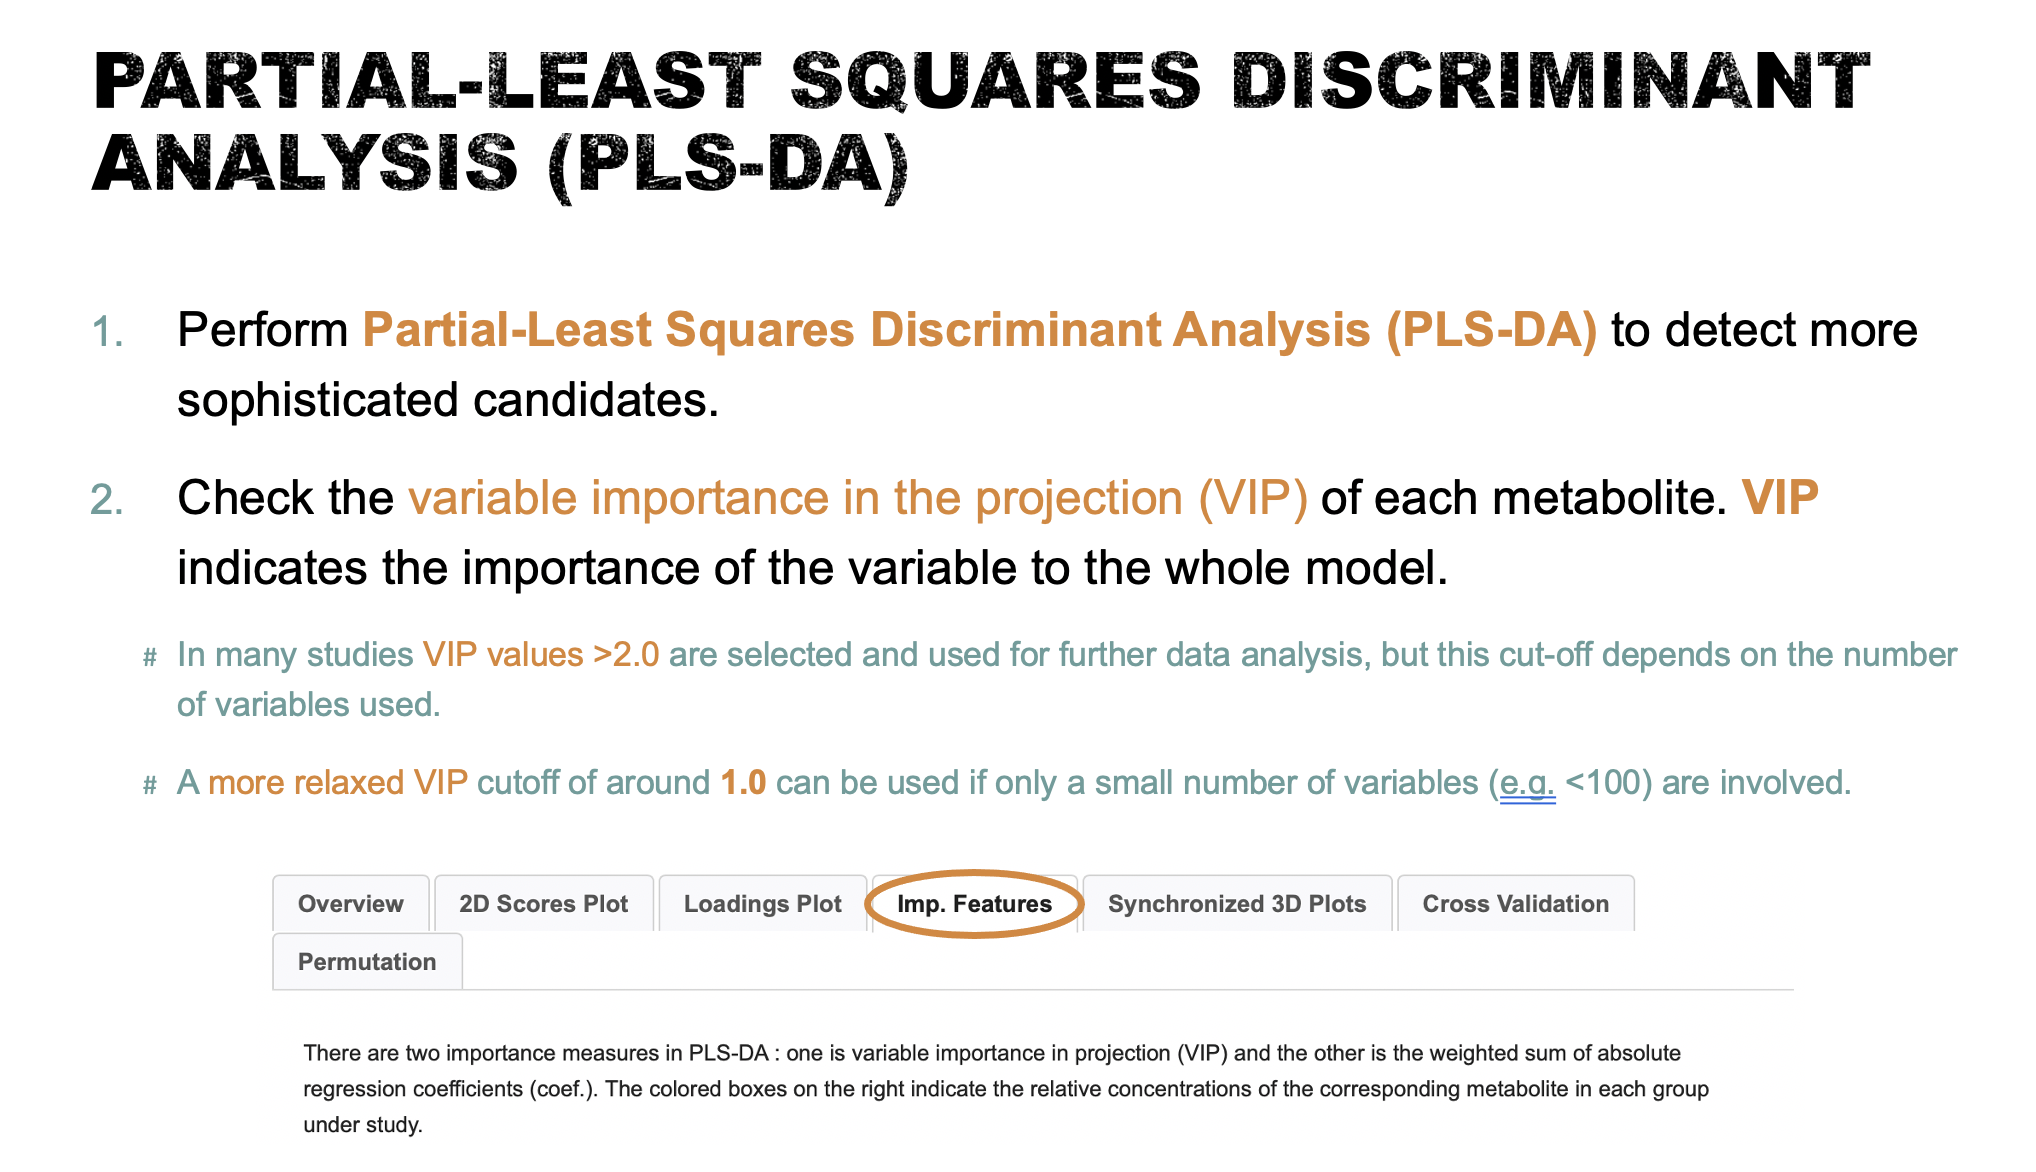
- Perform
Partial-Least Squares Discriminant Analysis (PLS-DA)as a more sophisticated way of detecting more candidates. Save your results and interpret your findings (10 points). Compare the difference between the Volcano Plot method and PLS-DA (10 points).
In PLS-DA, Variable Importance in Projection or VIP score is a weighted sum of squares of the PLS loadings.
- The weights are based on the amount of explained Y-variance in each dimension.
- VIP indicates the importance of the variable to the whole model.
- In many studies VIP values >2.0 are selected and used for further data analysis, but this cut-off depends on the number of variables used.
- A more relaxed VIP cutoff of around 1.0 can be used if only a small number of variables (e.g. <100) are involved in the study.
- As a result, four metabolites, Acetone (VIP=2.5062), Creatine (VIP=2.3263), Succinate (VIP=2.2816) and Uracil (VIP=2.0946), were identified as significantly different between the two groups by PLS-DA.
Univariate
Univariate analyses are often first used to obtain an overview of the data or a rough ranking of potentially important - features before applying more sophisticated data analysis tools.
Univariate analysis examines each variable separately without taking into account the effect of multiple comparisons.
As a supervised method, PLS-DA can perform both classification and feature selection. The algorithm uses cross-validation to select an optimal number of components for classification.
SAM (lab explanation)
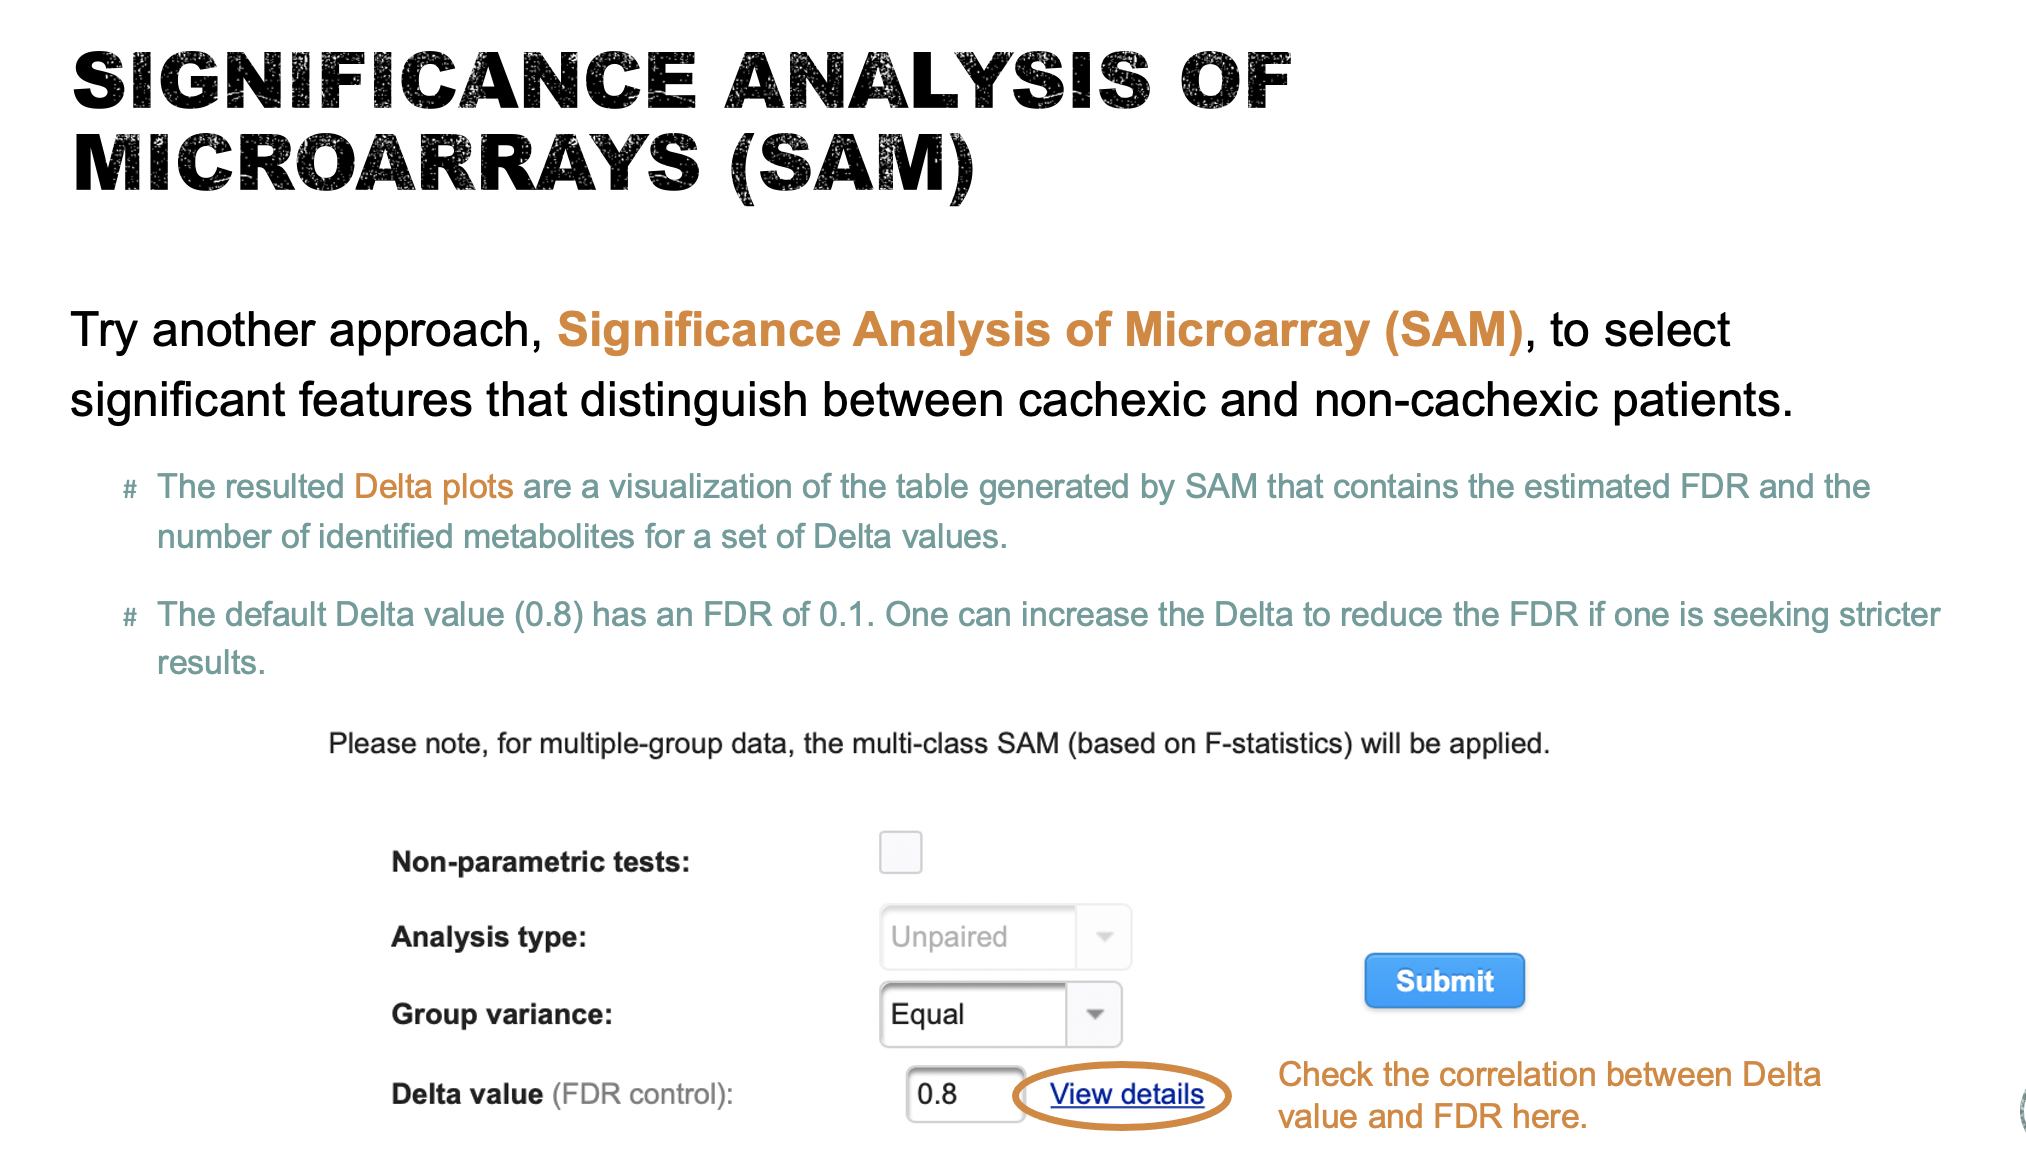
- Try another approach, Significance Analysis of Microarray (SAM), to select significant features that distinguish between cachexic and non-cachexic patients (10 points). Briefly describe how SAM works (10 points).
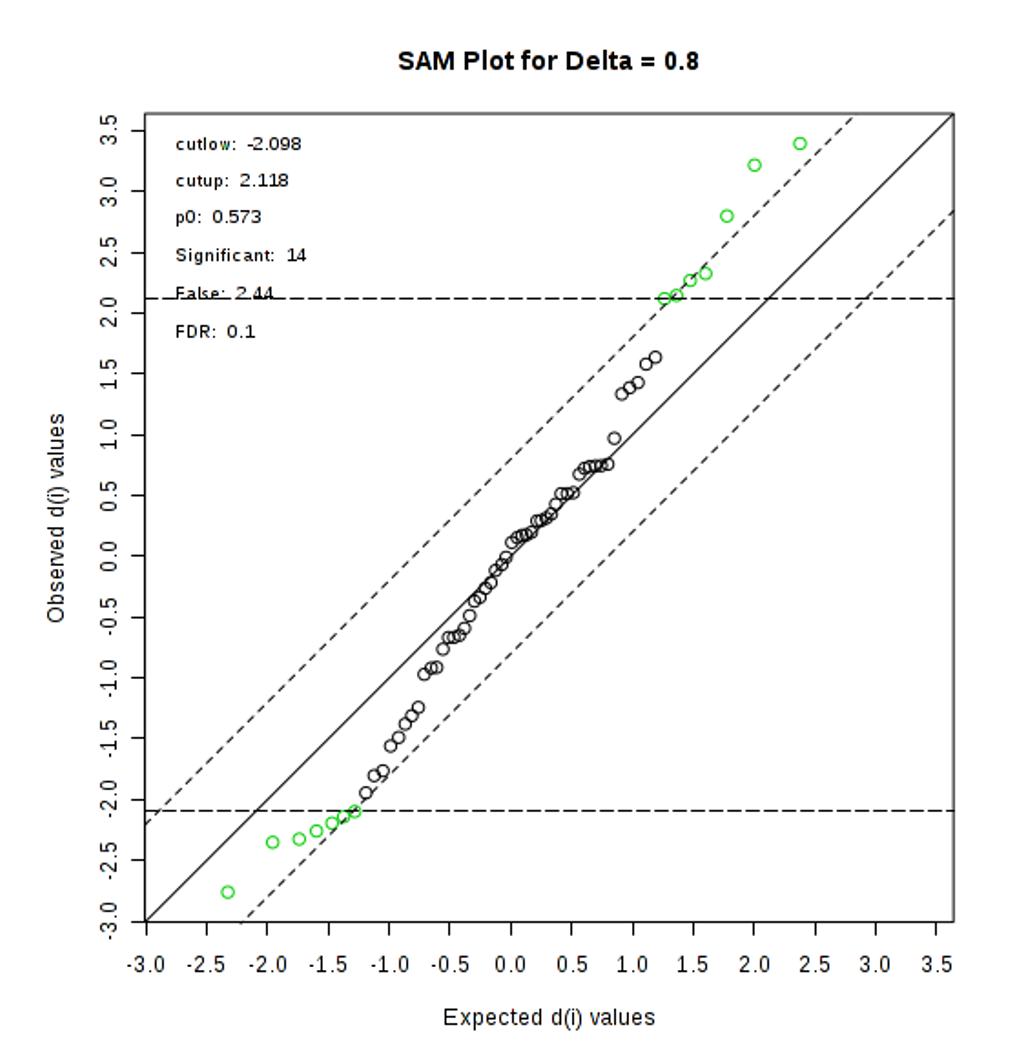
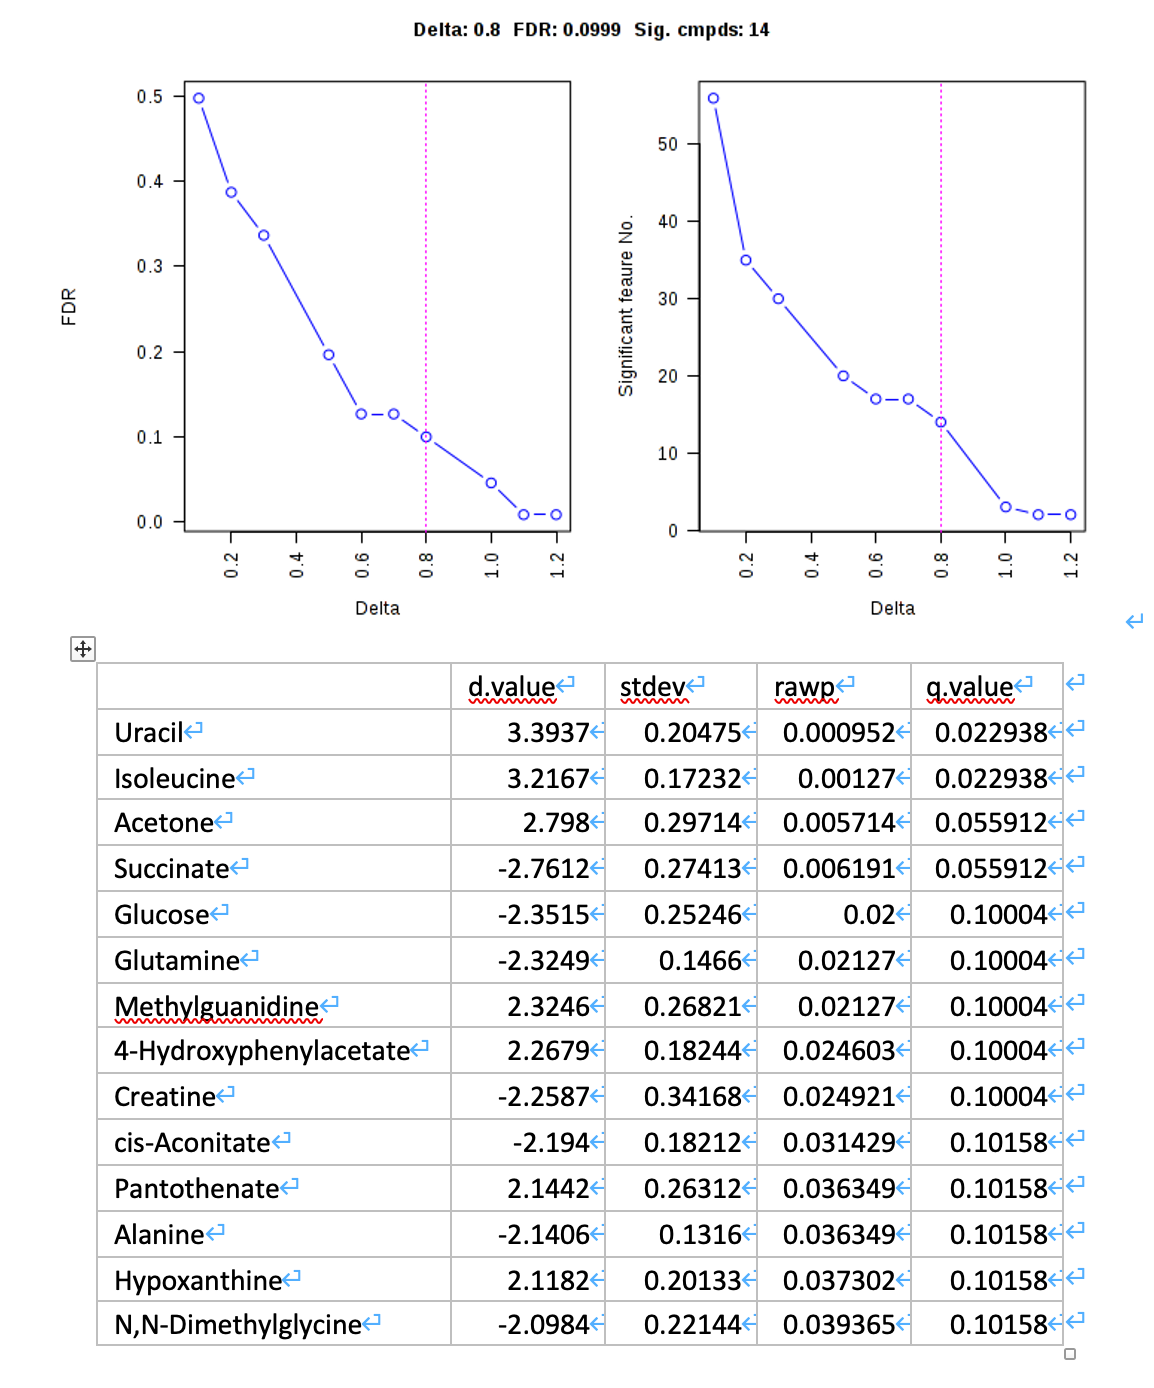
SAM is designed to address False Discovery Rate (FDR) problems when running multiple tests on high-dimensional data. It first assigns a significance score to each variable based on its change relative to the standard deviation of repeated measurements. Then it chooses variables with scores greater than an adjustable threshold and compares their relative difference to the distribution estimated by random permutations of the class labels. For each threshold, a certain proportion of the variables in the permutation set will be found to be significant by chance. This number is used to calculate the FDR.
MetaboAnalyst tips
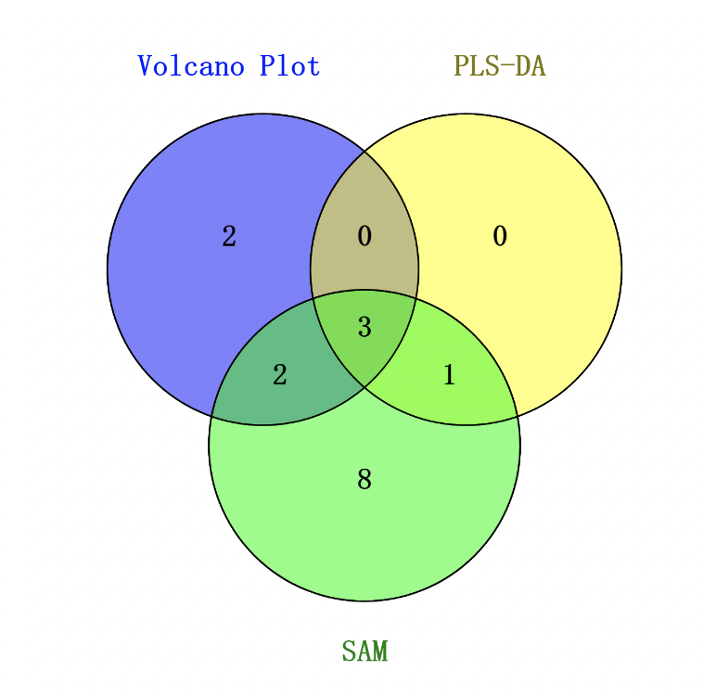
Task 3: Consensus results and functional analysis (15 points).
- Find metabolite candidates consistently identified by all the three approaches and interpret the results (10 points).
As shown in the Venn diagram, 3 metabolites were consistently identified by all the three approaches including Uracil, Acetone and Succinate.
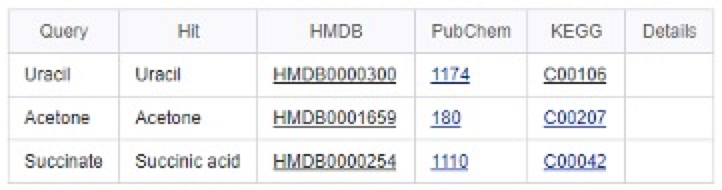
- For the consensus results, identify their biological function(s) and possible roles in pathways using MetaboAnalyst Pathway Analysis (https://www.metaboanalyst.ca/faces/upload/PathUploadView.xhtml (10 points).
By searching Pathway Analysis for Uracil, Acetone and Succinate, cross-links to HMDB, KEGG and PubChem are shown below.
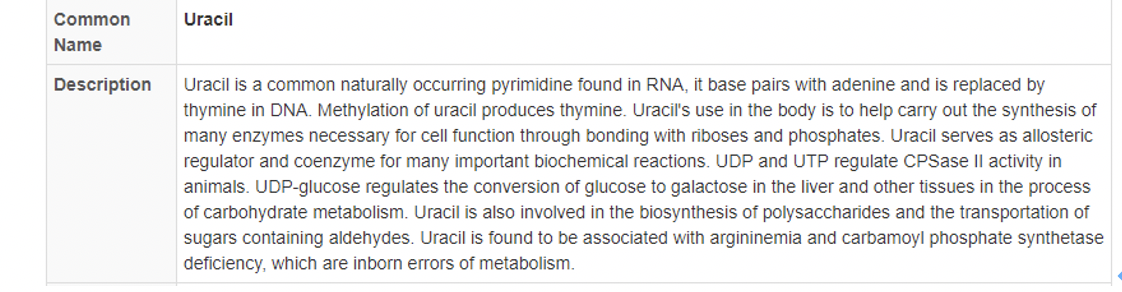
 Take Uracil as example, by checking the information from HMDB (Uracil HMDB ID: 0000300), we can find that Uracil serves as allosteric regulator and coenzyme for many important biochemical reactions. It is also involved in the biosynthesis of polysaccharides and the transportation of sugars containing aldehydes. Uracil is found to be associated with argininemia and carbamoyl phosphate synthetase deficiency, which are inborn errors of metabolism.
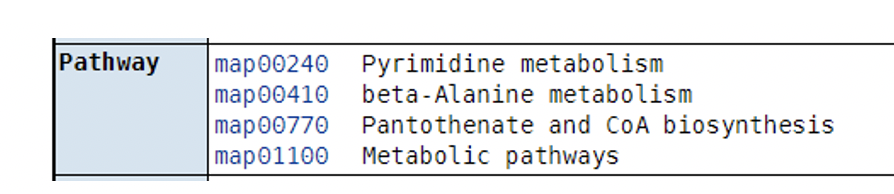
Besides, Uracil plays roles in Pyrimidine metabolism, beta-Alanine metabolism and Pantothenate and CoA biosynthesis processes.
- Post title:PROTEOMICS DATA ANALYSIS
- Post author:Yuxuan Wu
- Create time:2021-05-01 01:02:21
- Post link:yuxuanwu17.github.io2021/05/01/2021-05-01-PROTEOMICS-DATA-ANALYSIS/
- Copyright Notice:All articles in this blog are licensed under BY-NC-SA unless stating additionally.