What is Gene Ontology
The Gene Ontology (GO) project is an effort to ==provide consistent descriptions of gene products==
Gene annotation
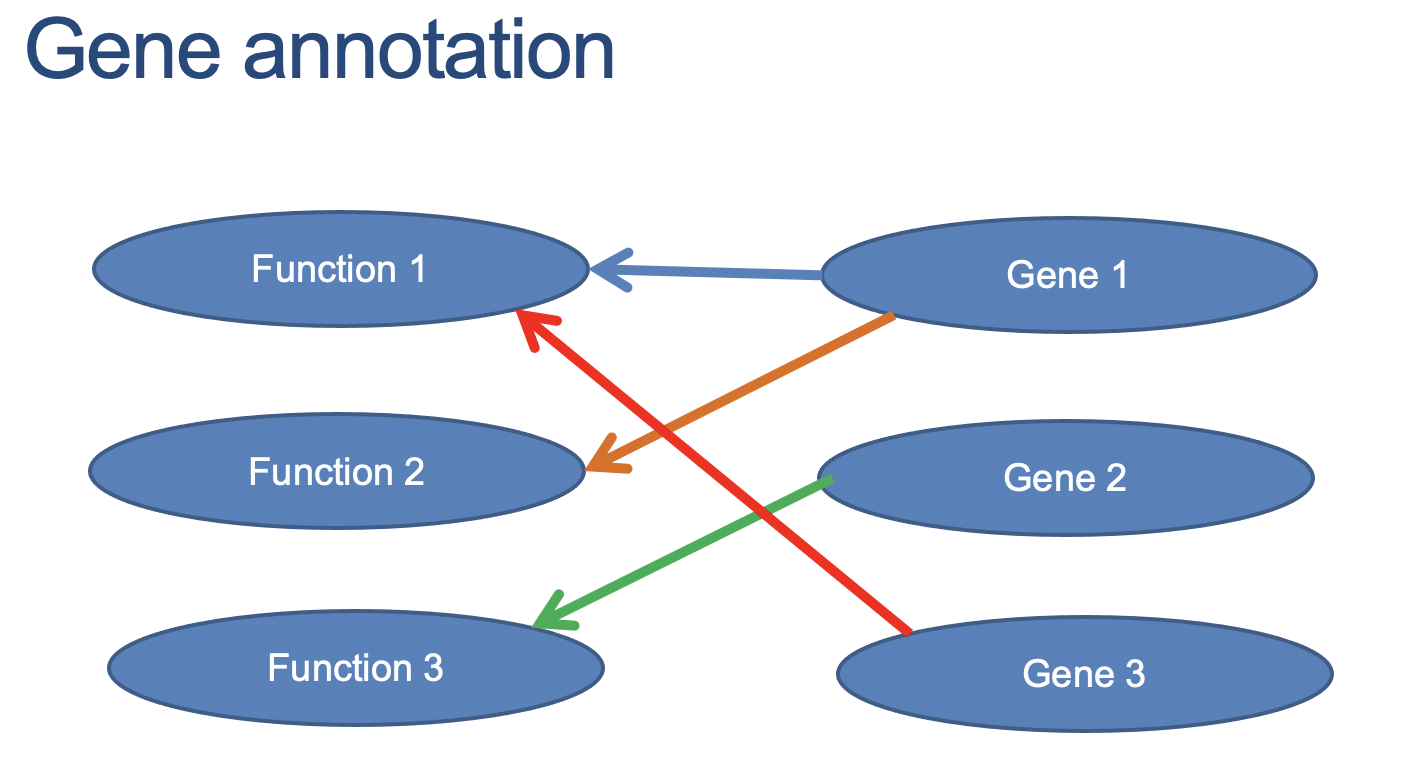
GO terms divided into three parts:
cellular component
molecular function
biological process
Cellular component解释的是基因存在在哪里,在细胞质还是在细胞核?如果存在细胞质那在哪个细胞器上?如果是在线粒体中那是存在线粒体膜上还是在线粒体的基质当中?这些信息都叫Cellular component。
Biological process是在说明该基因参与了哪些生物学过程,比如,它参与了rRNA的加工或参与了DNA的复制,这些信息都叫Biological process
Molecular function在讲该基因在分子层面的功能是什么?它是催化什么反应的?
So, we will have a gene annotation infarmation.
立足于这三个方面,我们将得到基因的注释信息。
得到GO注释
model organism —> annotated database
non-model organism —> search database or blast
- 模式生物 —> 有标准的注释数据库;
- 非模式生物 —> 自己搜注释数据库(怎们搜后面具体介绍),搜不到就用blast的办法解决。
做GO分析的思路:
control VS treatment —> DEG —> GO enrichment analysis
也就是RNA-Seq先测出各组的基因表达分布:
control gene expression distributiontreatment gene expression distribution
control VS treatment —> DEG : differential expression genes
通过比较 control 和 treatment 得到差异表达基因
再去做GO富集分析:
DEG —> GO enrichment analysis
用找到的差异基因去做GO富集分析,希望能从这三方面找到和我们背景不一样的地方。
比如,在疾病研究的时候,进行药物治疗之后某些基因的表达量明显的发生了变化,拿这些基因去做GO分析发现在Biological process过程当中集中在RNA修饰上,然后在此基础上继续进行挖掘。这个例子就是想启示大家拿到差异表达基因DEG只是一个开始,接下来就应该去做GO注释,之后需要进行一个分析看这些注释主要集中在哪个地方。假如我们有100个差异表达基因其中有99个都集中在细胞核里,那我们通过GO分析就得到了一个显著的分布。
GO富集分析原理:有一个term注释了100个差异表达基因参与了哪个过程,注释完之后(模式生物都有现成的注释包,不用我们自己注释),计算相对于背景它是否显著集中在某条通路、某一个细胞学定位、某一种生物学功能。
KEGG enrichment analysis?
把生物体中所有的pathway都要进行富集分析
DO enrichment analysis?
看目标基因是否在某个疾病或某一类疾病当中富集
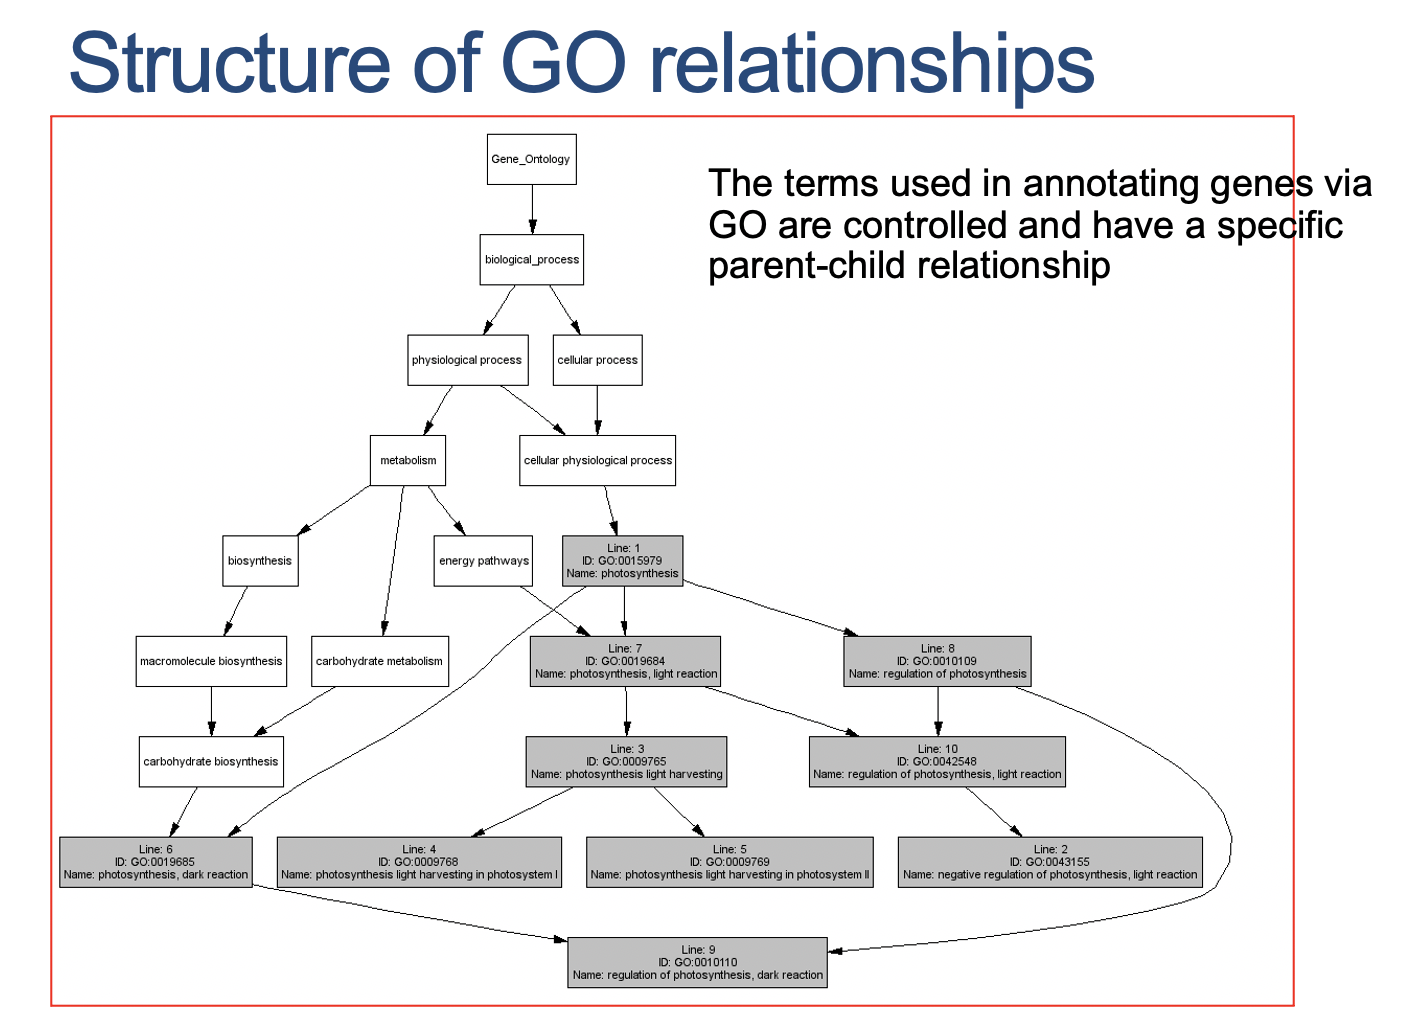
GO structure
- GO is a term related with a hierarchy
Gene Ontology Enrichment
Enrichment module gives you the answer of which pathways, diseases, and GO terms is statistically significant associated with the genes/proteins you just input.
GO分析代码
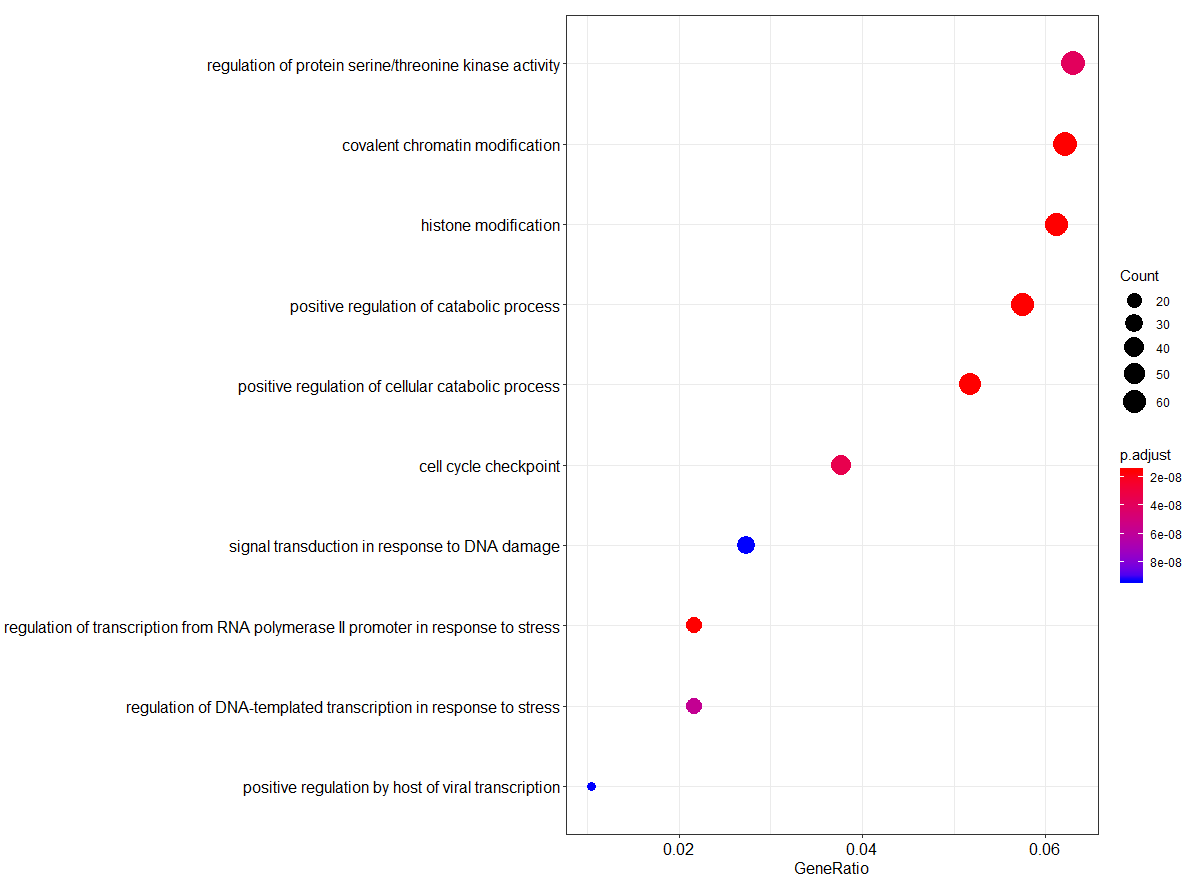
BP(Biological process)层面上的富集分析:
1 | erich.go.BP = enrichGO(gene = DEG.entrez_id, |
解读BP层面富集分析图:
横坐标是GeneRatio,意思是说输入进去的基因,它每个term(纵坐标)站整体基因的百分之多少。圆圈的大小代表基因的多少,图中给出了最大的圆圈代表60个基因,圆圈的颜色代表P-value,也就是说P-value越小gene count圈越大,这事就越可信。
Reference
作者:黄晶_id
链接:https://www.jianshu.com/p/47b5ea646932
来源:简书
著作权归作者所有。商业转载请联系作者获得授权,非商业转载请注明出处。
- Post title:Gene Ontology Enrichment 笔记
- Post author:Yuxuan Wu
- Create time:2021-04-09 03:47:30
- Post link:yuxuanwu17.github.io2021/04/09/2021-04-09-Gene-Ontology-Enrichment-笔记/
- Copyright Notice:All articles in this blog are licensed under BY-NC-SA unless stating additionally.