[toc]
Amino acids structure

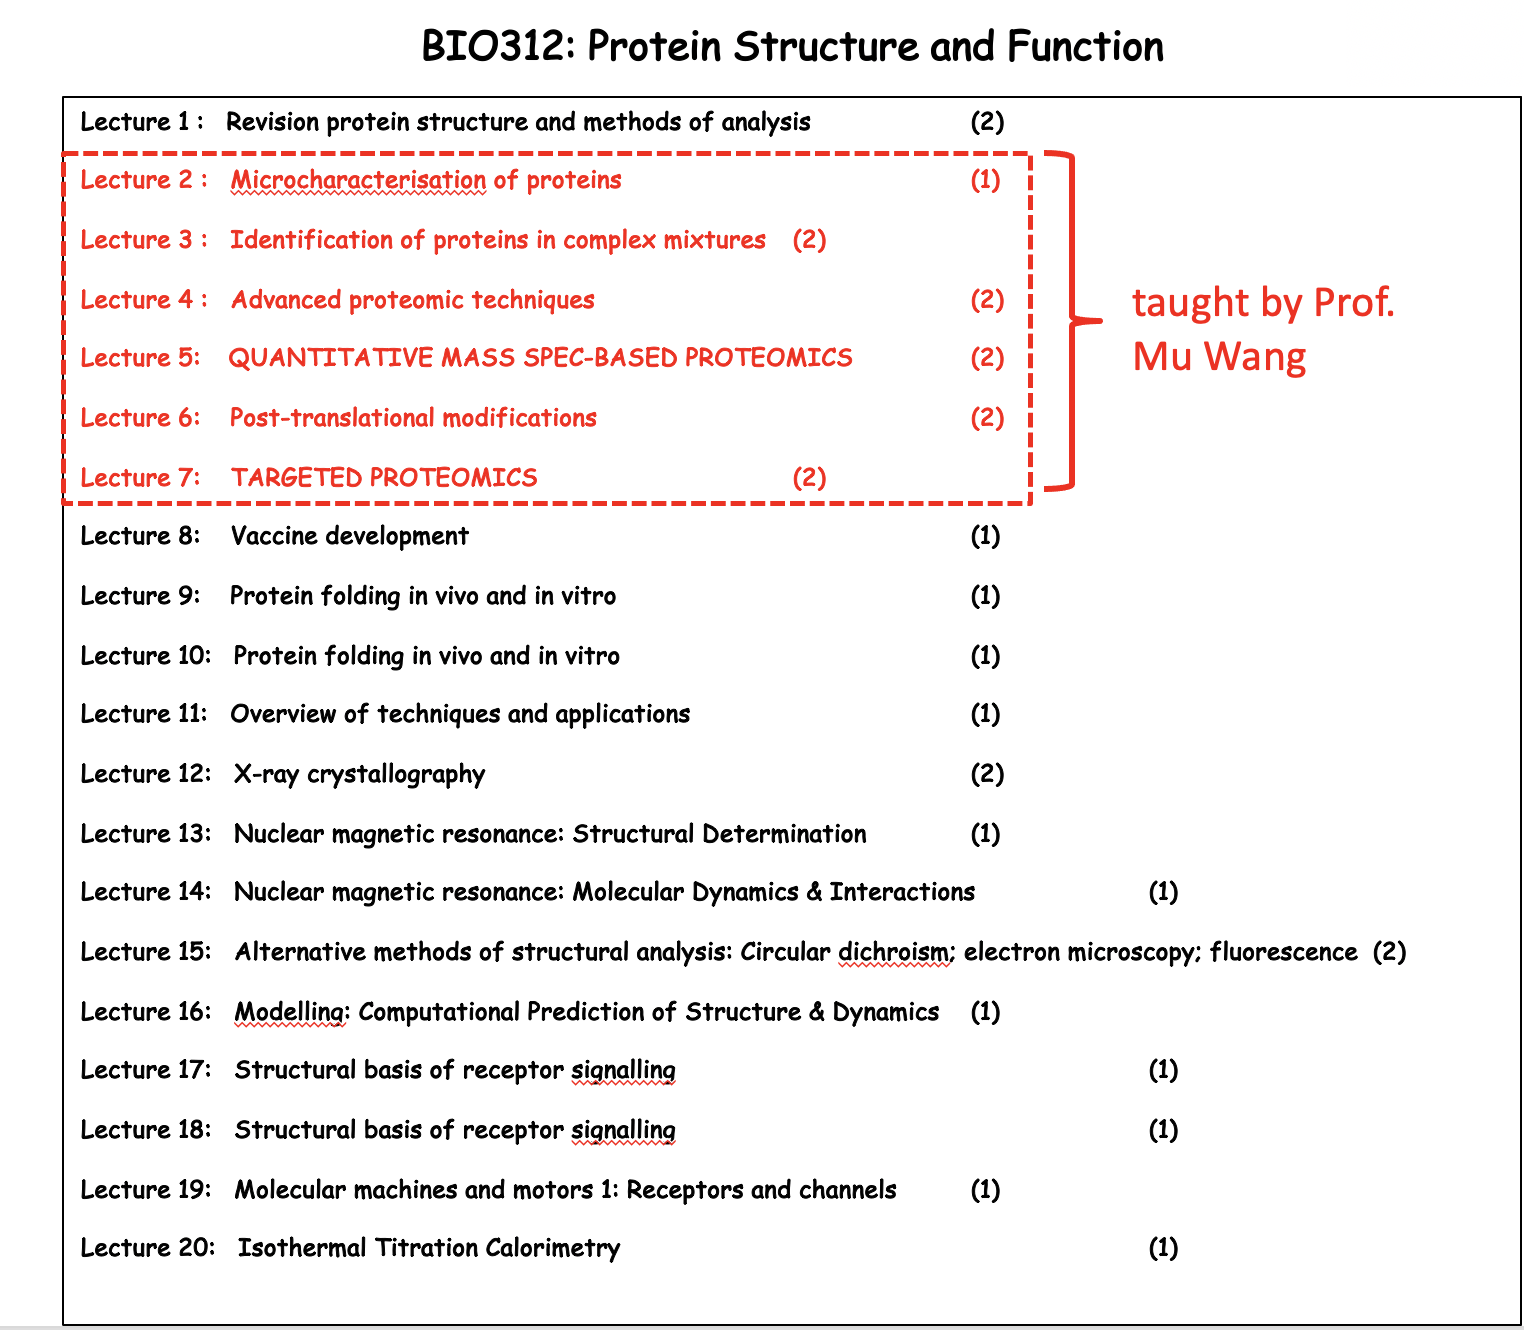
Lecture 09 Folding in vivo
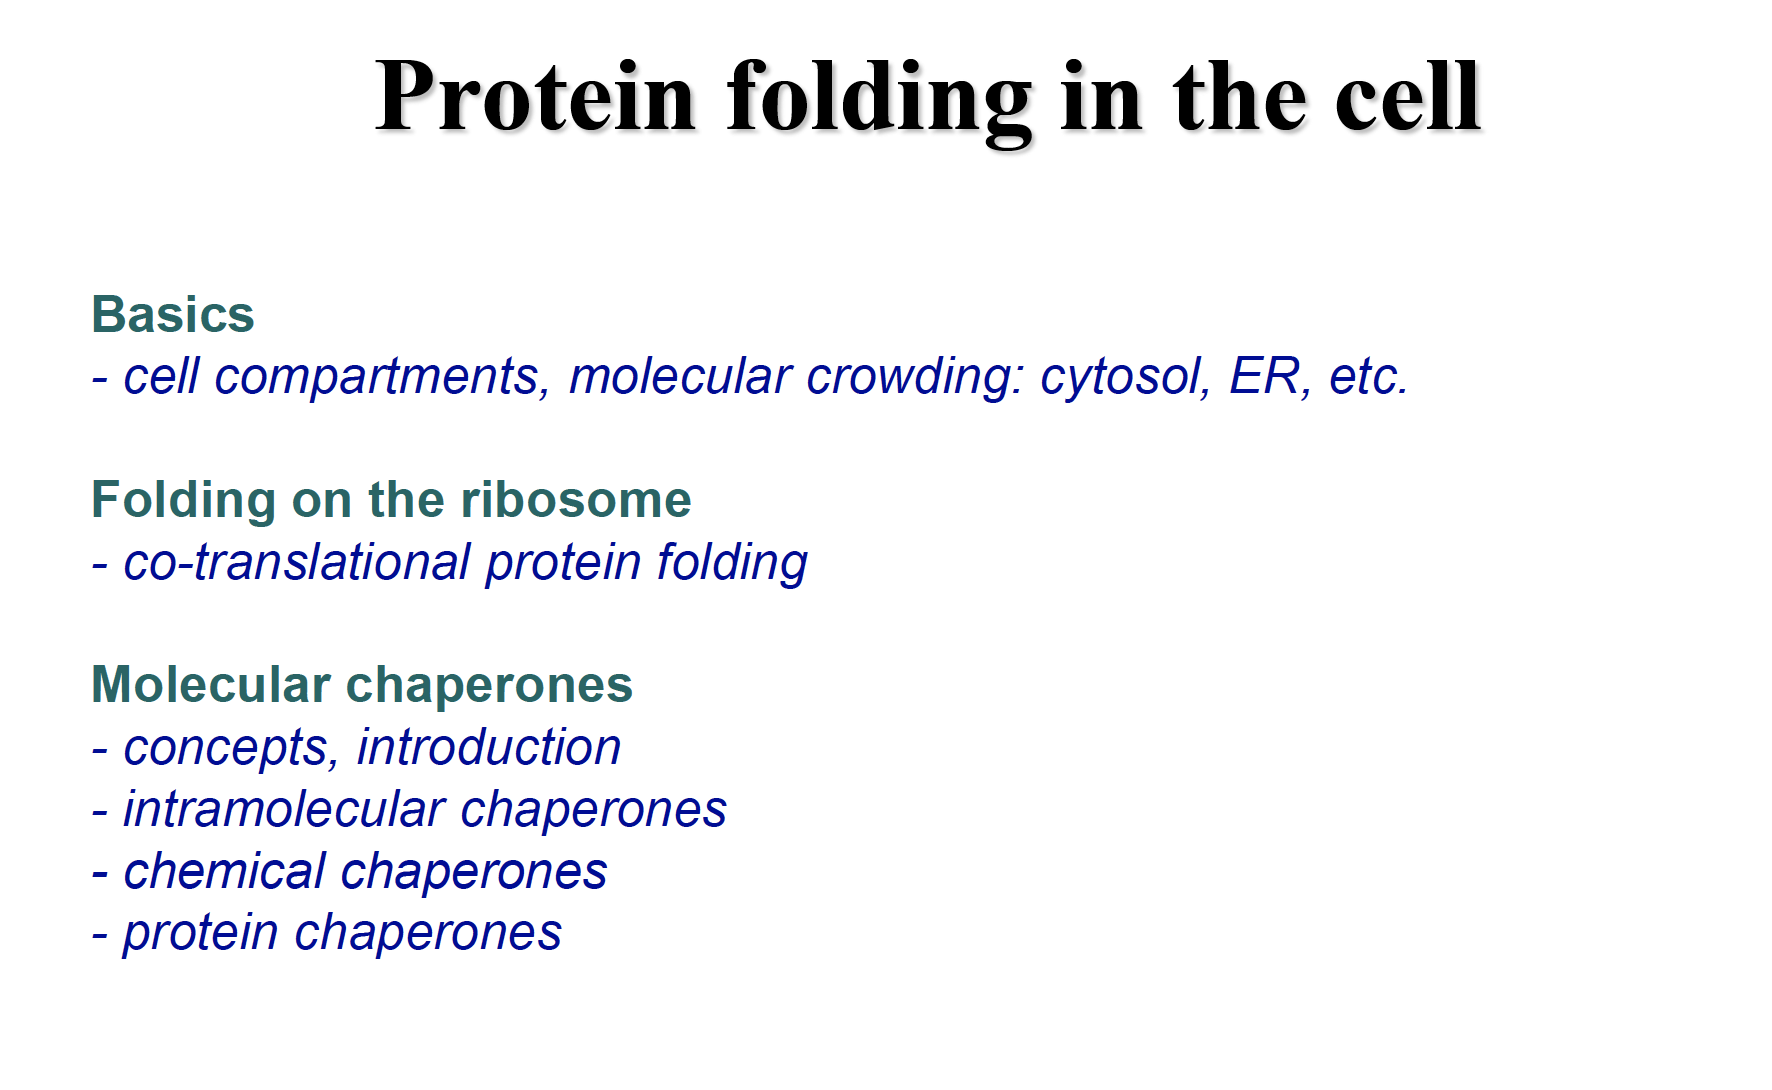
protein folding in the cell
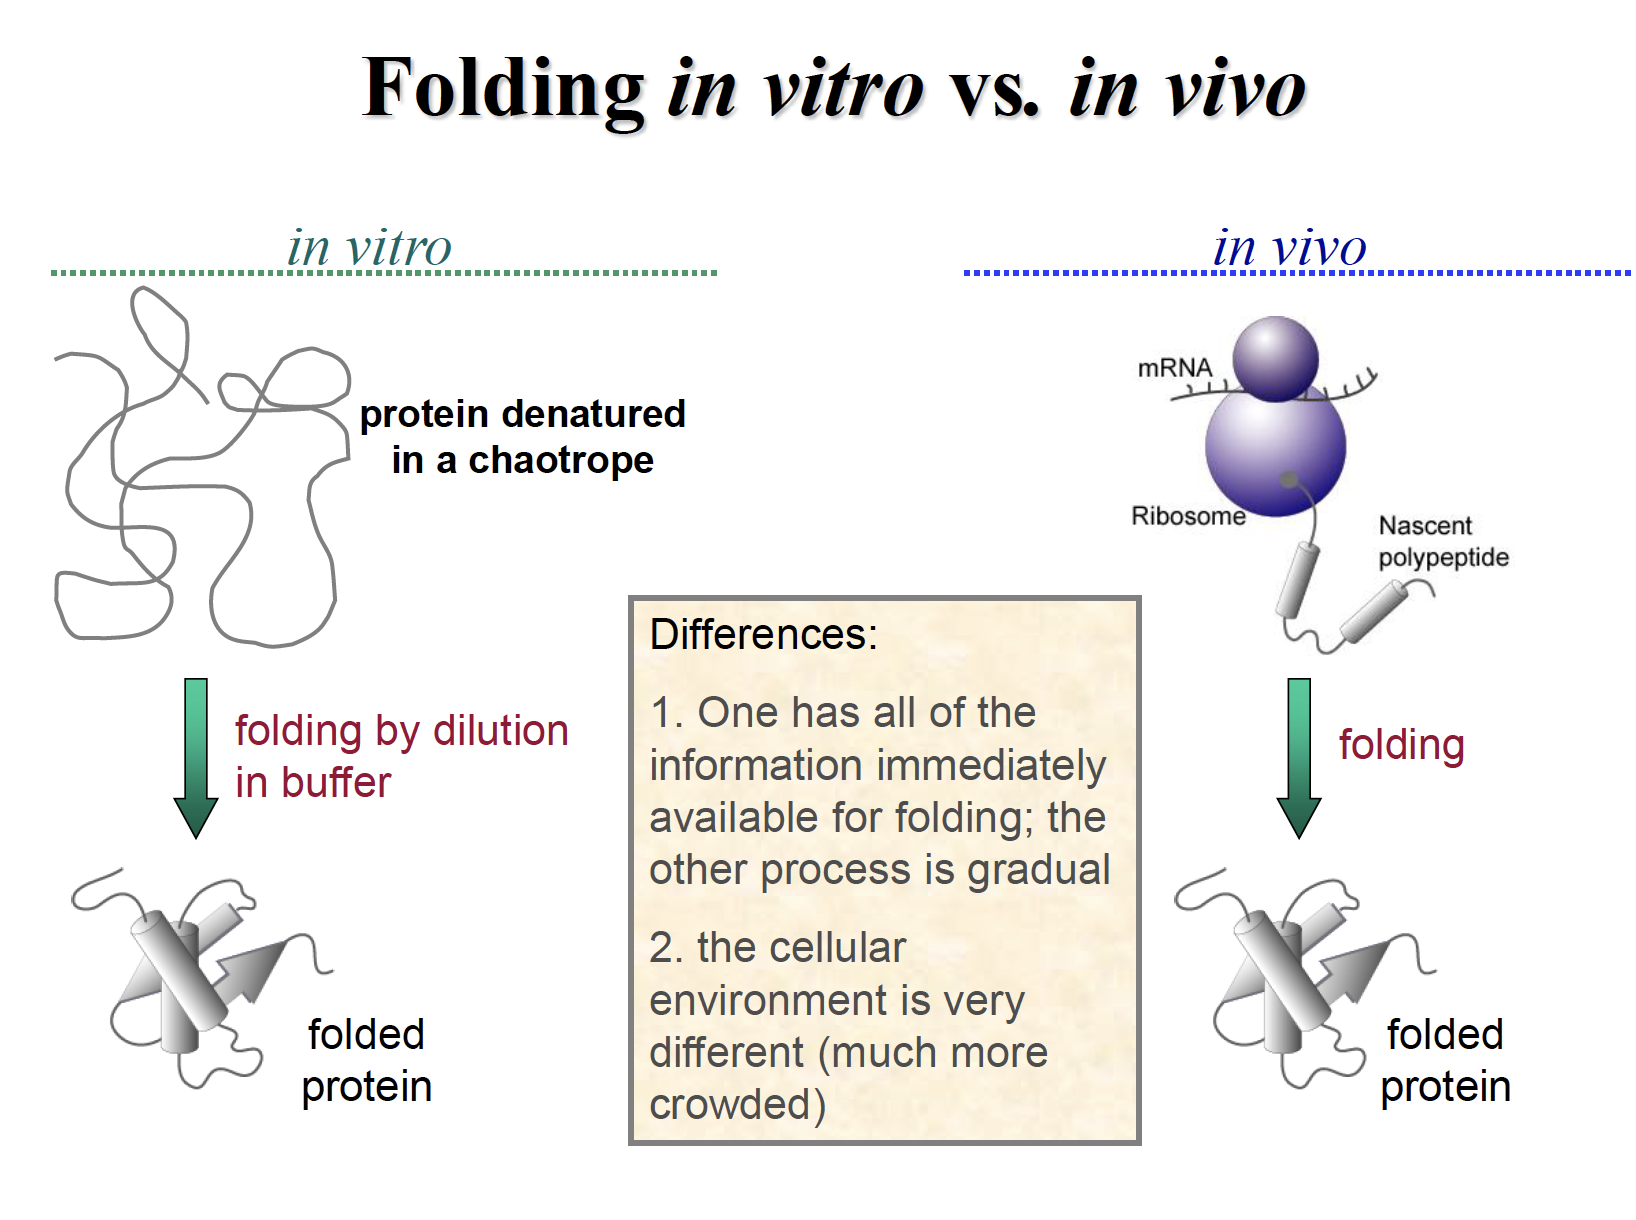
Folding in vitro and in vivo
Macromolecular crowding
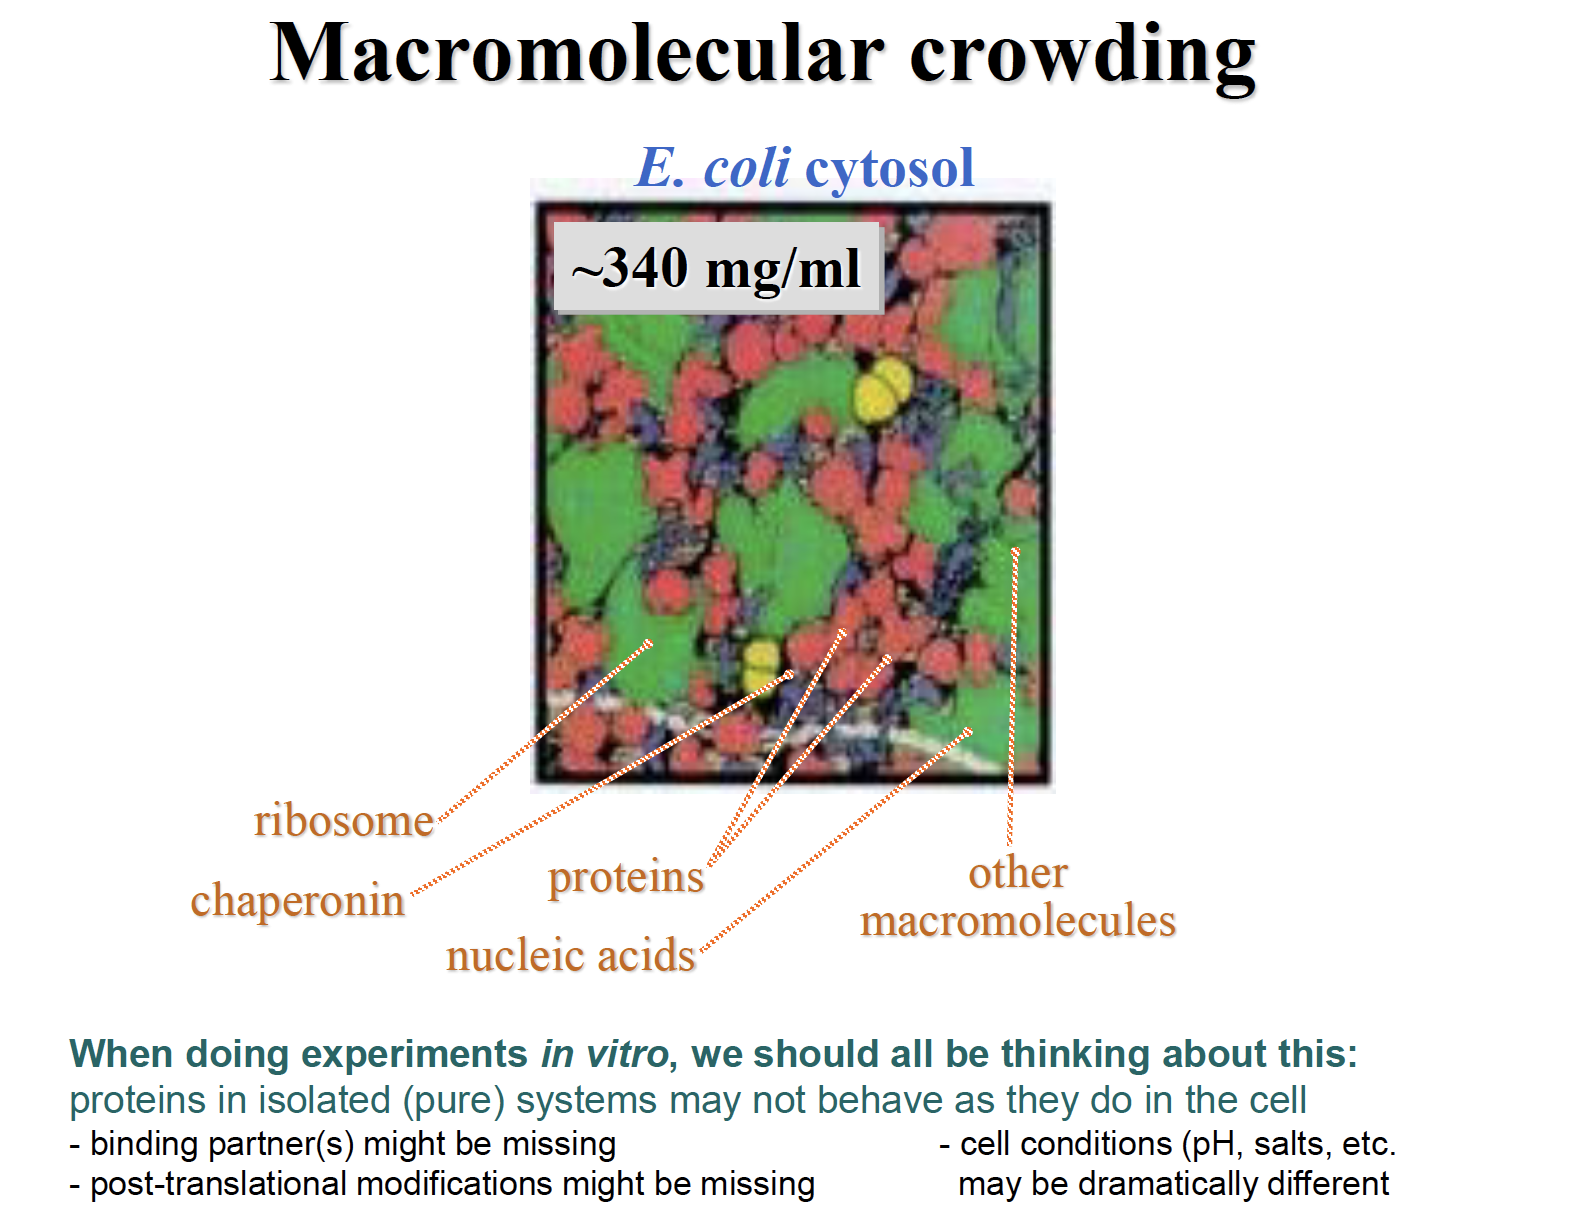
Effects of crowding
definition
Molecular crowdingis ageneric term for the condition where a significant volume of a solution, or cytoplasm for example, is occupied with things other than water
Fact:
-association rate (ka) increase significantly
-dissociation rate (kd) decrease significantly (kd=1/ka)
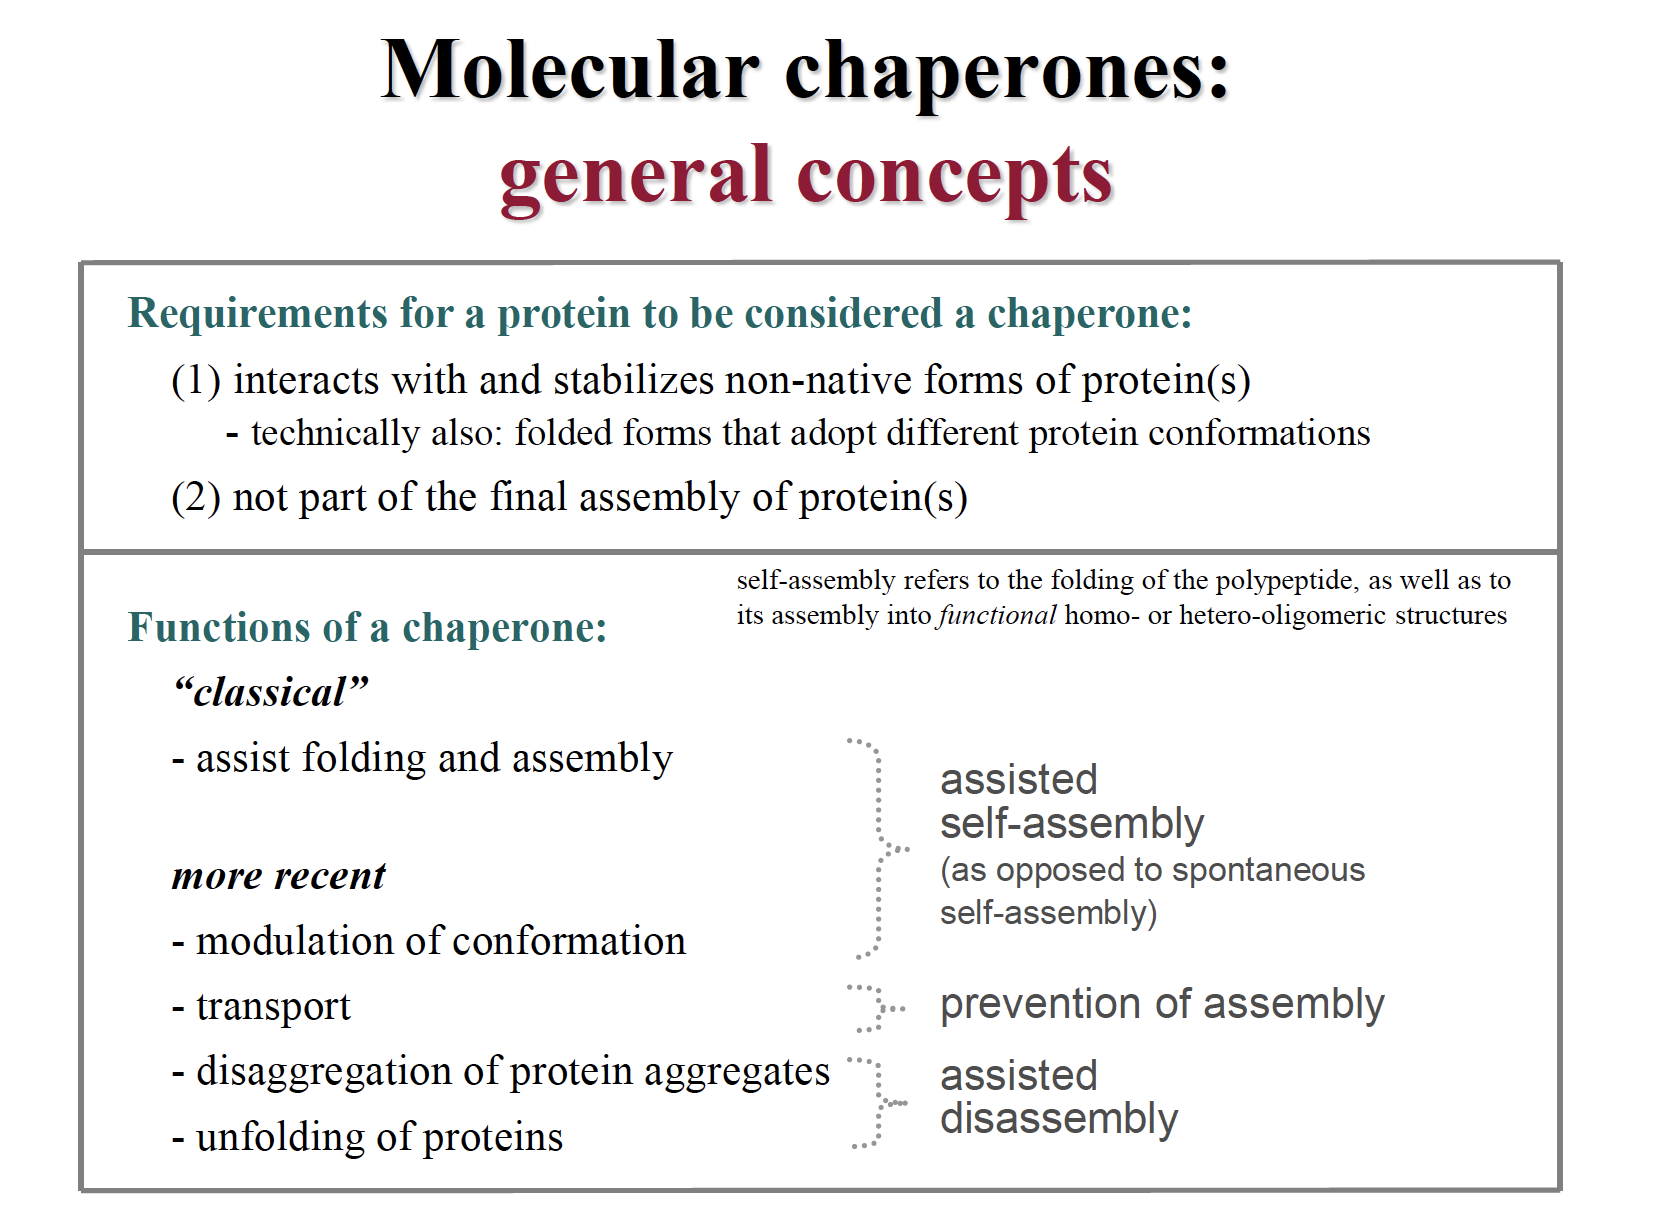
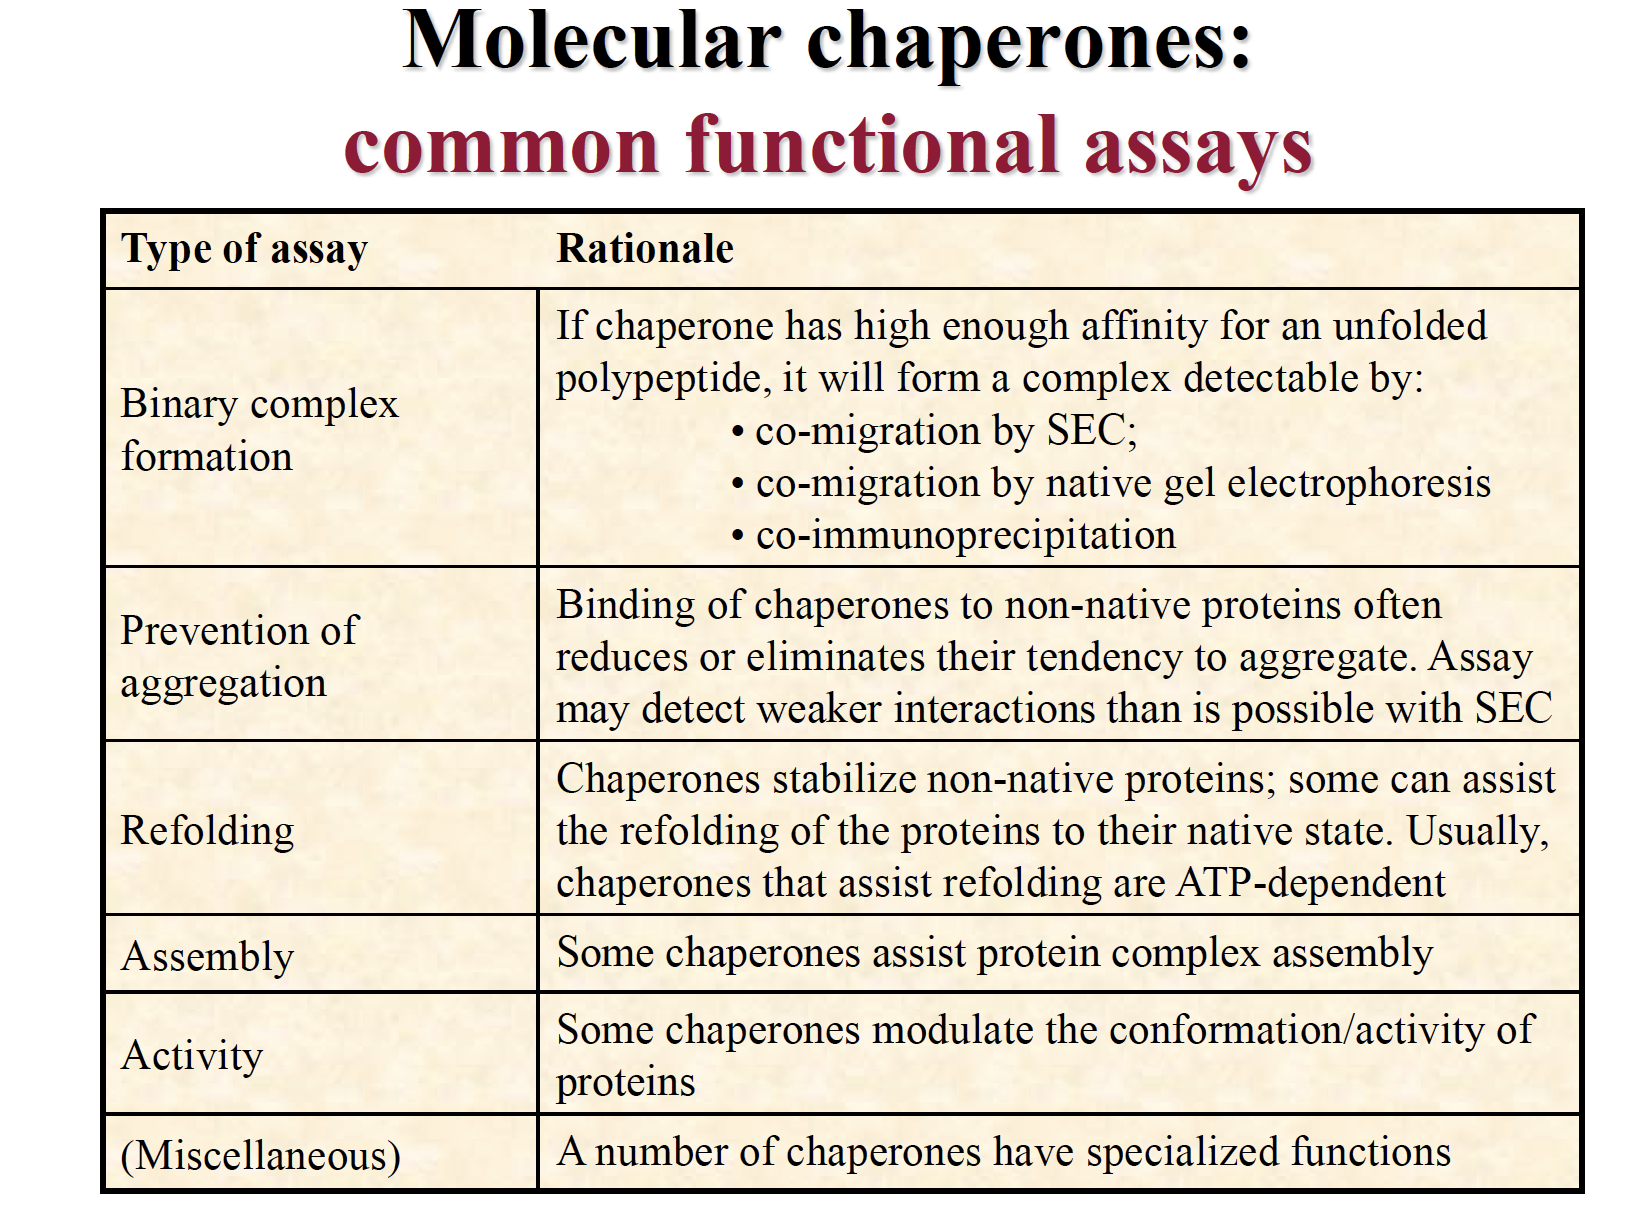
Molecular chaperones
Lecture 10 Folding in vitro
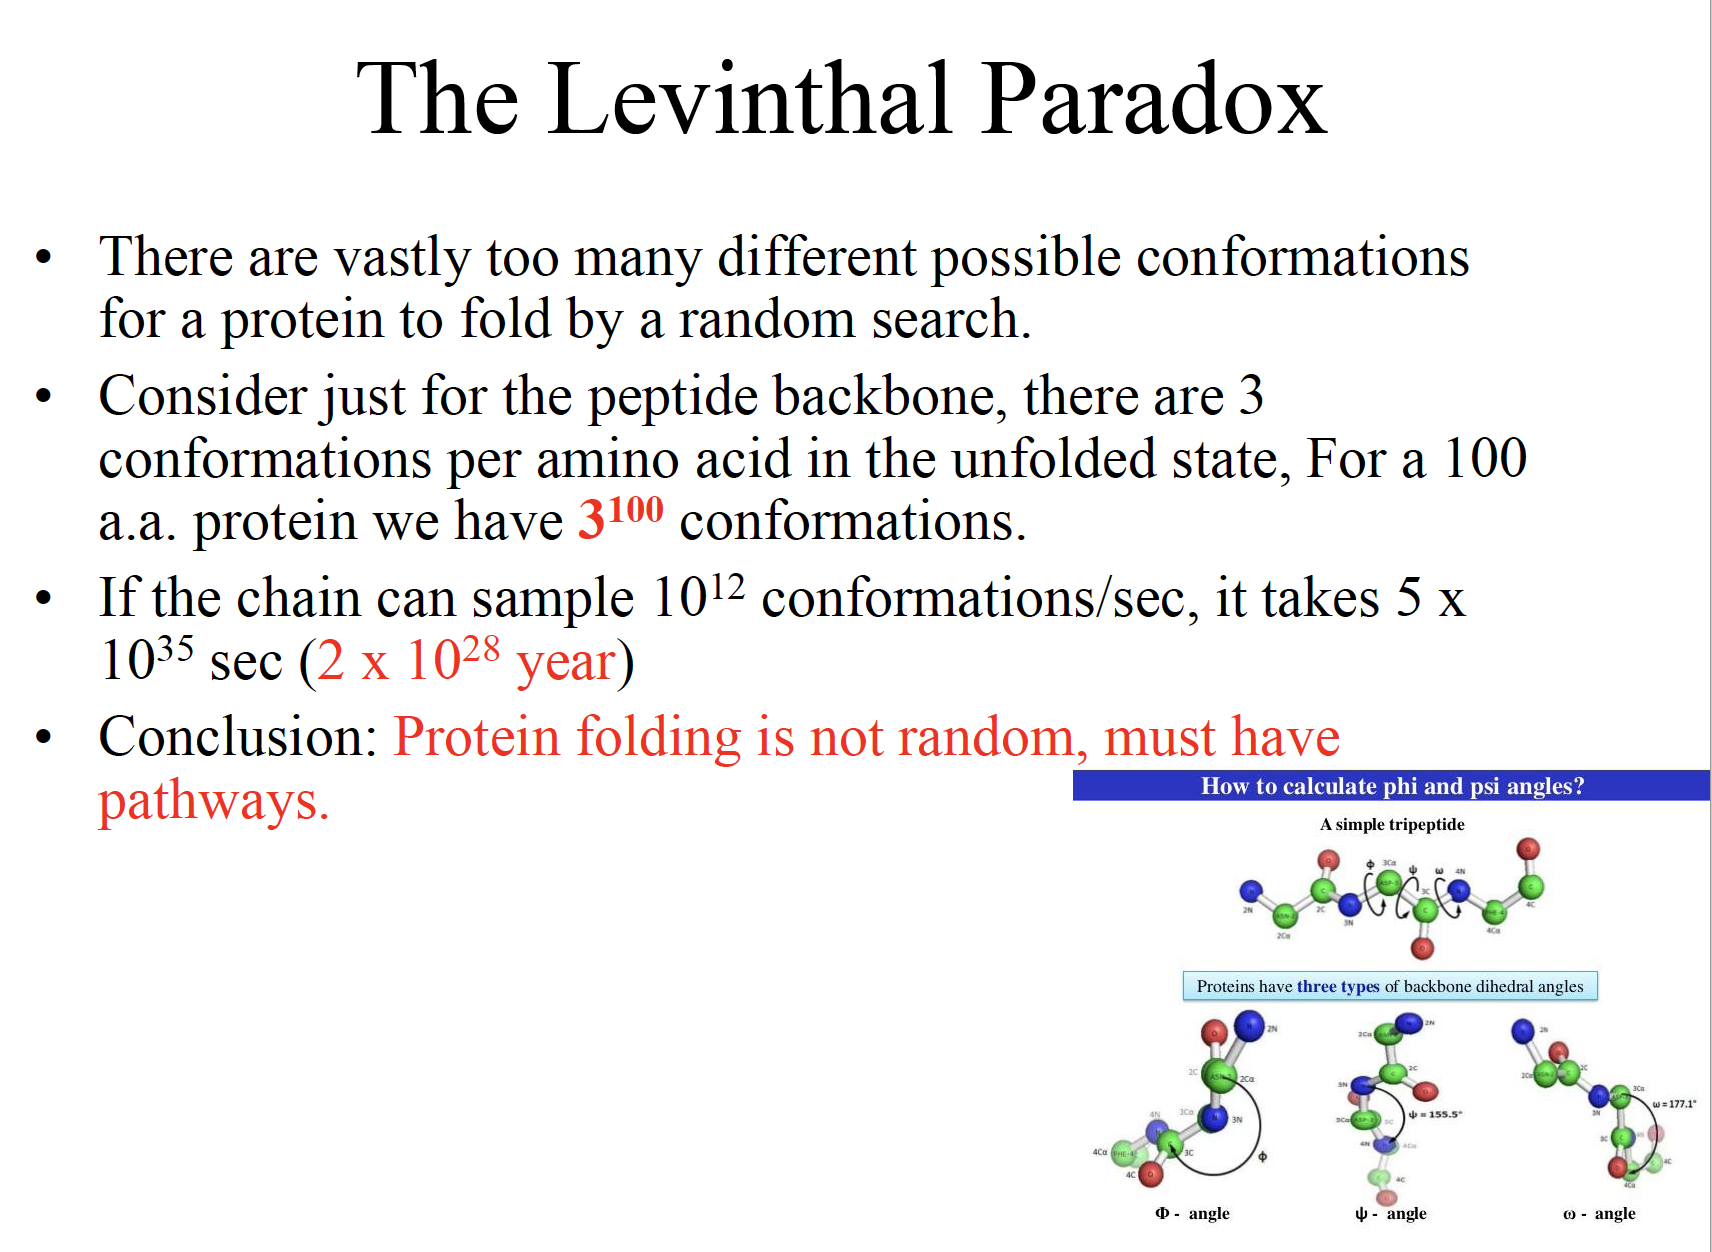
The Levinthal Paradox
Conclusion: Protein folding is not random, must have pathways.
Equilibrium unfolding
switch off part of the interactions in the native protein under different denaturing conditions such as chemical denaturants, low pH, high salt and high temperature
understand which types of native structure can be preserved by the remaining interactions
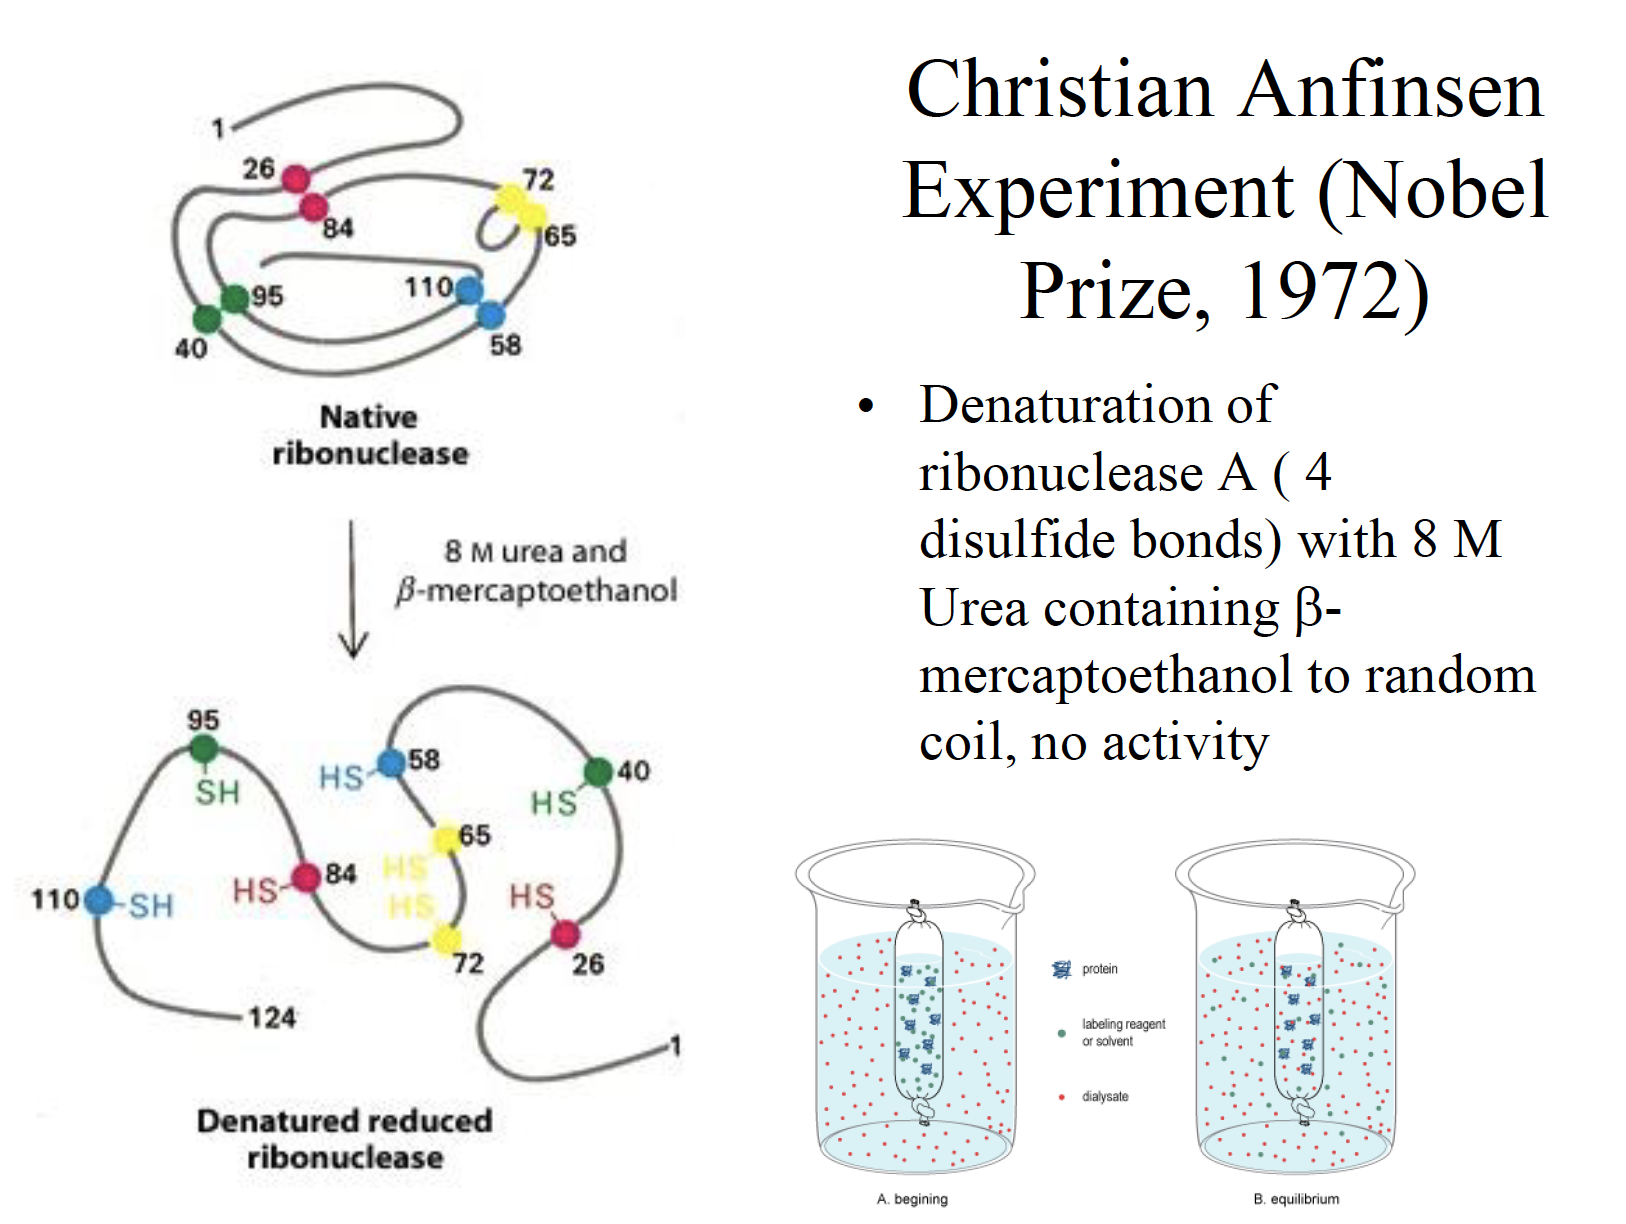
Anfinsen Experiment
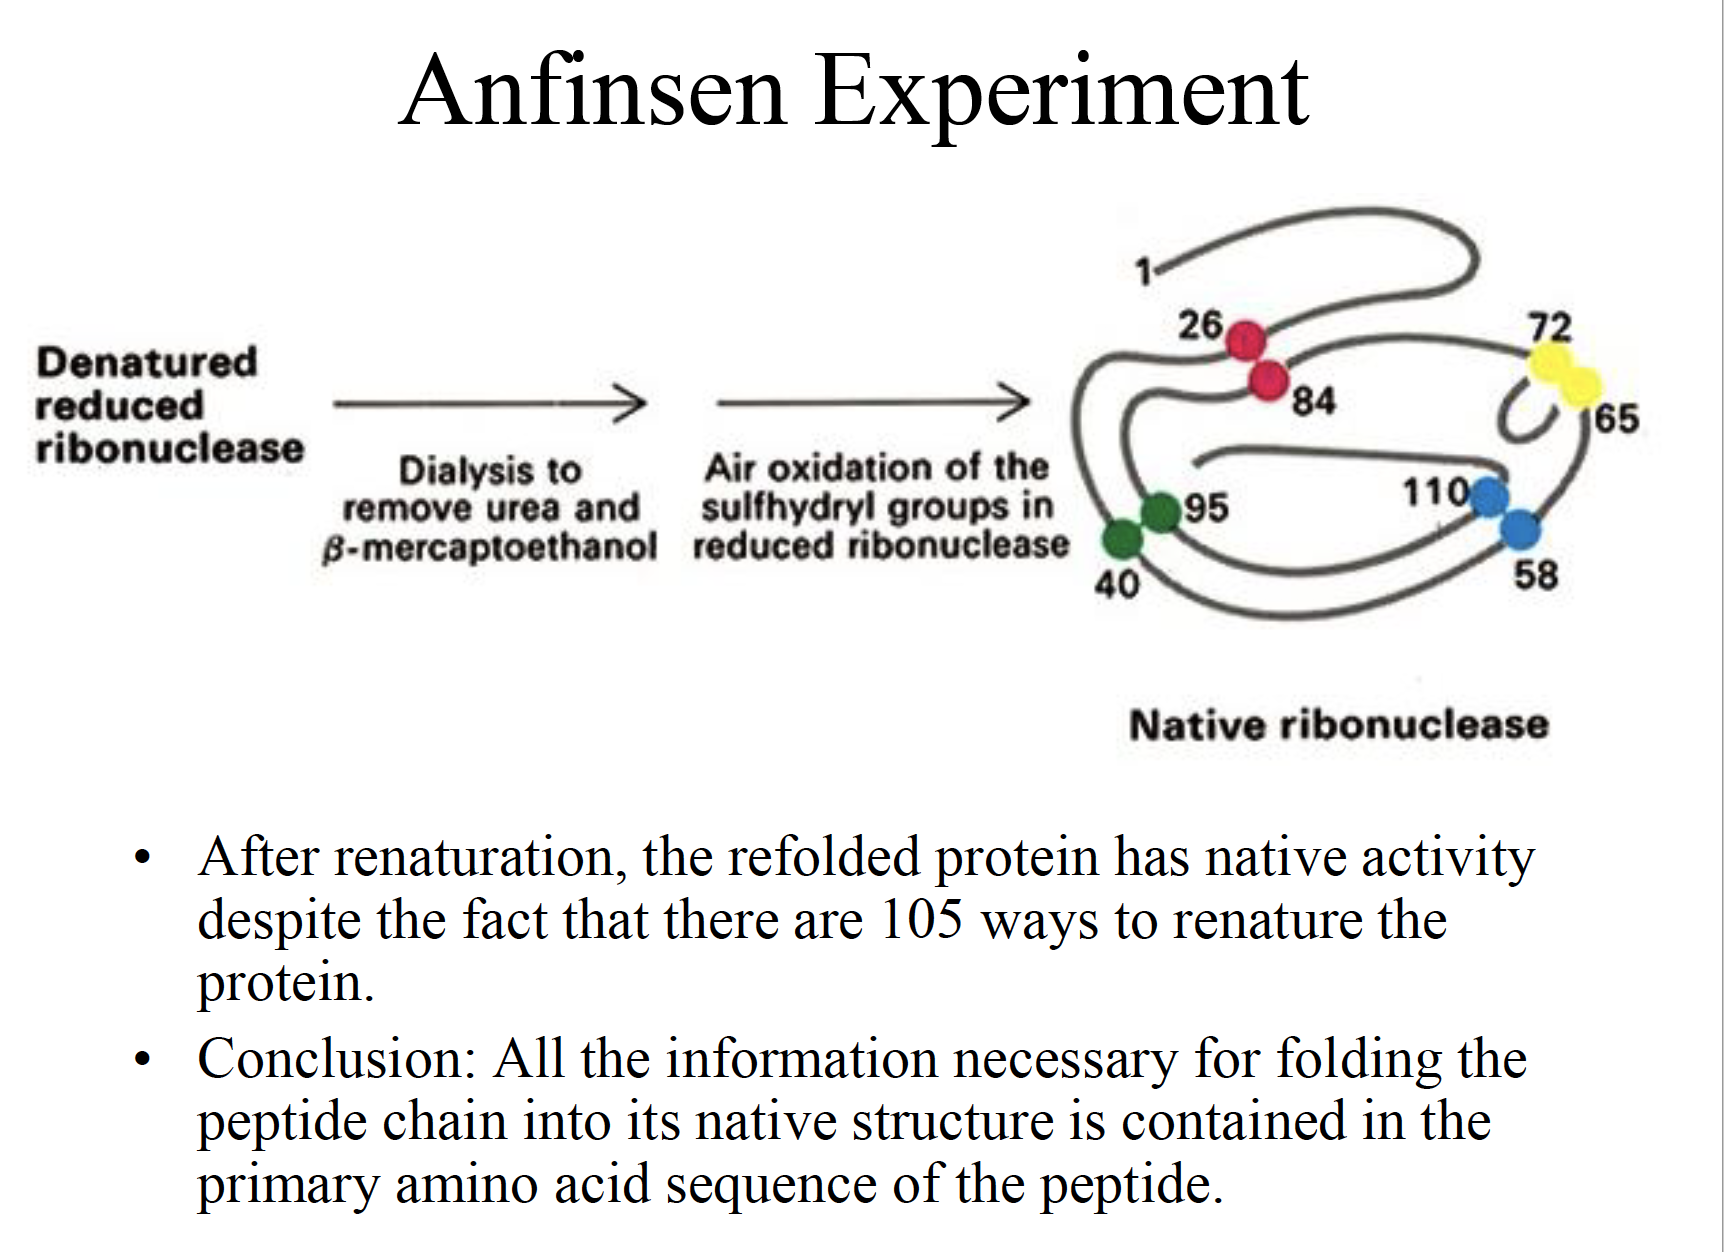
Conclusion: All the information necessary for folding the peptide chain into its native structure is contained in the primary amino acid sequence of the peptide.
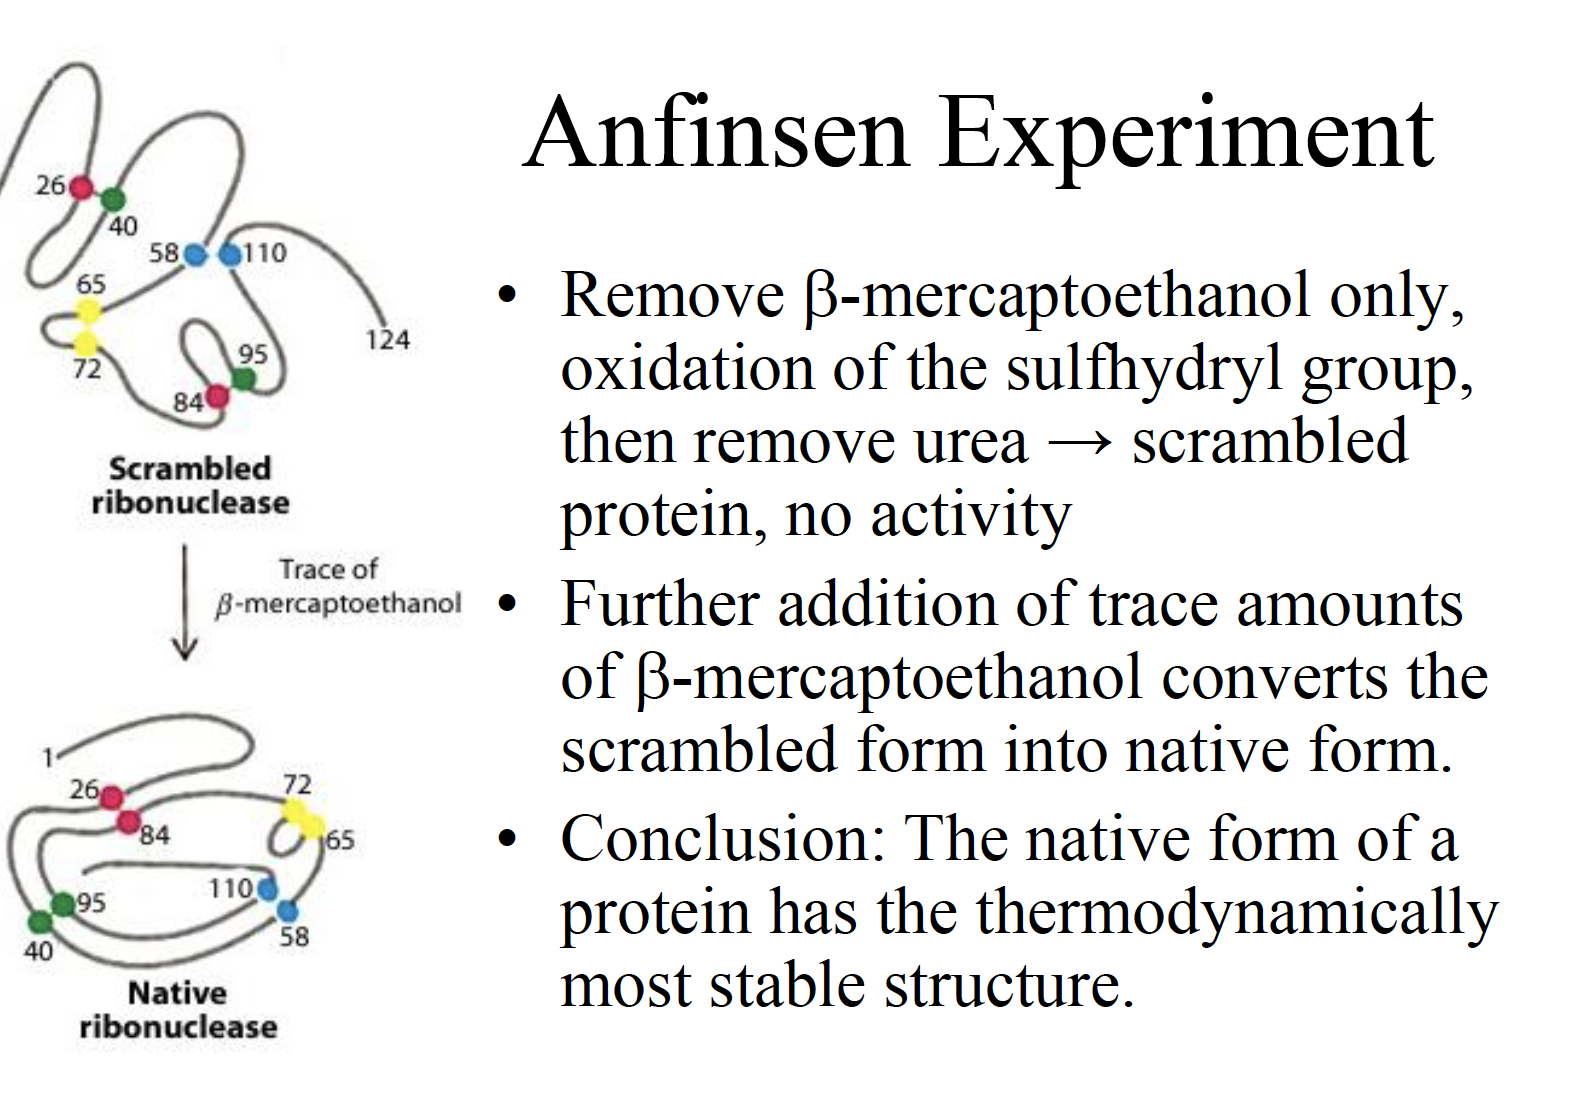
Conclusion: The native form of a protein has the thermodynamically most stable structure.
Information online
Christian’s plan was to use the appropriate denaturing agents, namely urea and beta mercaptoethanol, to break down the secondary and tertiary structure of ribonuclease, a polypeptide that consists of 124 amino acids and which contains four disulfide bonds within its tertiary structure.
Urea agent is used to break down non-covalent bonds such as hydrogen bonds holding the secondary structure
beta-mercaptoethanol: use to reduce and break down the disulfide bonds holding the tertiary structure together.
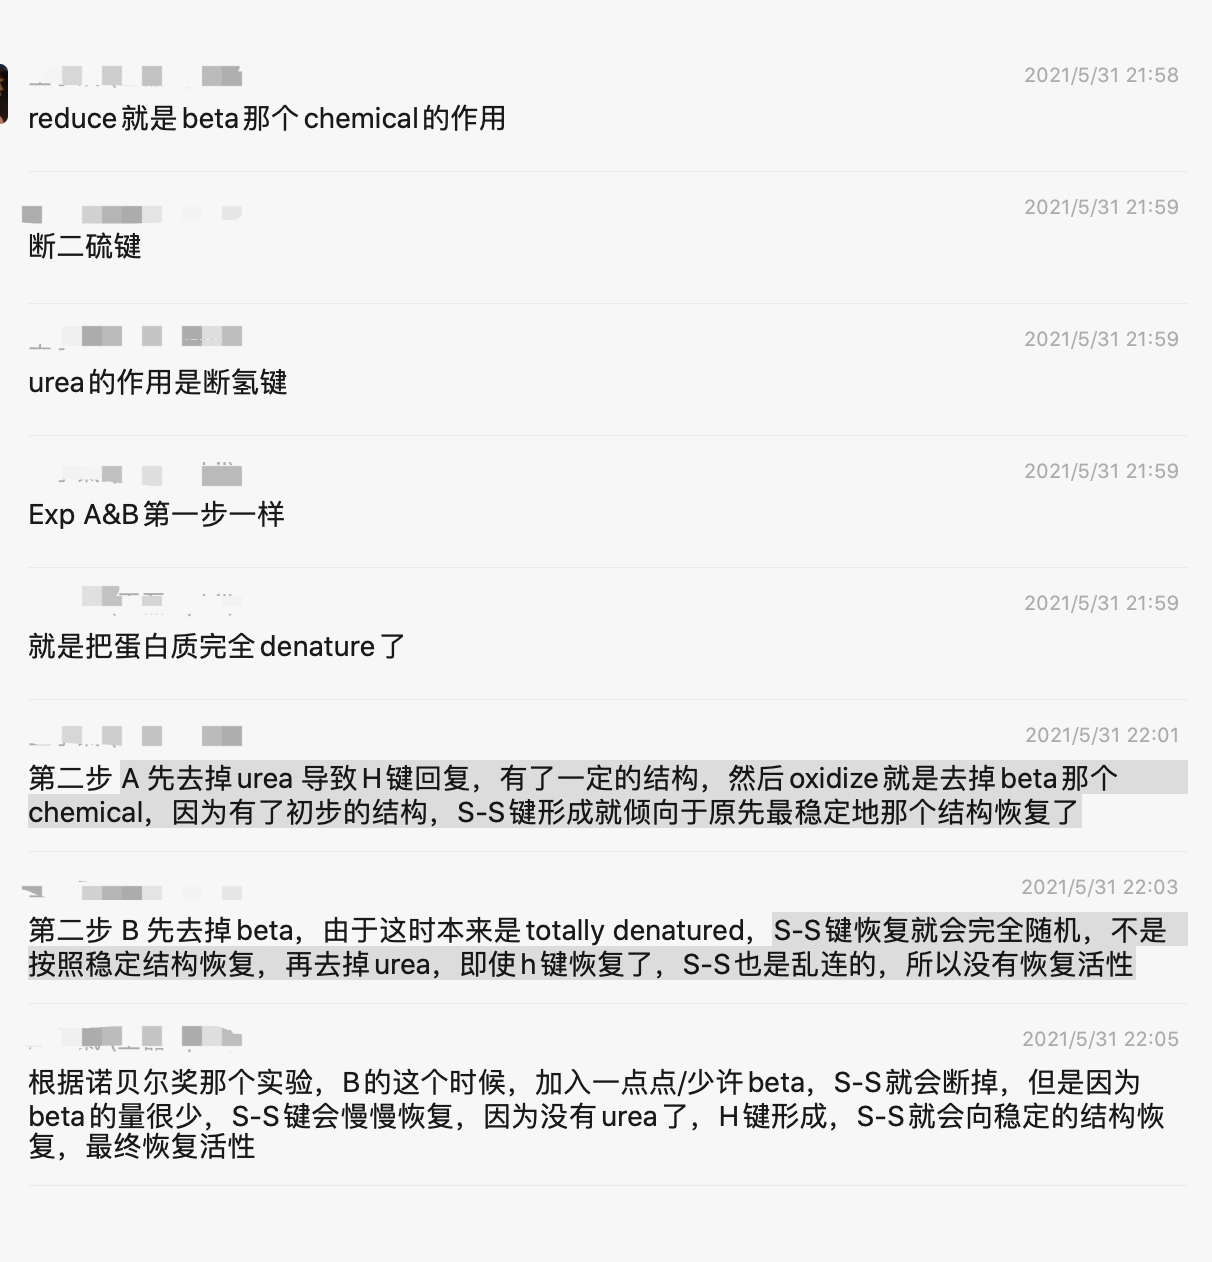
In his first experiment, Christian exposed the native enzyme to excess beta mercaptoethanol and 8.0 M urea and he found that the protein was completely denatured.
When he removed the two agents simultaneously via dialysis, he found that the protein refolded back into its original biologically active form.
In his second experiment, instead of removing the two agents at the same time, he first removed the beta mercaptoethanol first and then removed the urea. What he discovered was that the final protein refolded but became scrambled and was no longer biologically active.
This happened because the non-covalent bonds could not form in the presence of urea and so the disulfide bonds formed incorrectly (the non-covalent bonds coded by the primary sequence of amino acids are needed to direct the correct formation of the disulfide bonds).
In his third experiment, he found that if he exposed the scrambled, inactive protein to trace amounts of beta mercaptoethanol in the absence of urea, the biologically active native structure eventually reformed. Why did this happen? Well the tiny amount of beta mercaptoethanol was enough to catalyze the breaking of the incorrect disulfide bonds. Eventually the protein formed the correct disulfide bridges and returned to its native form because this was thermodynamically most stable and lowest in energy form.
quiz
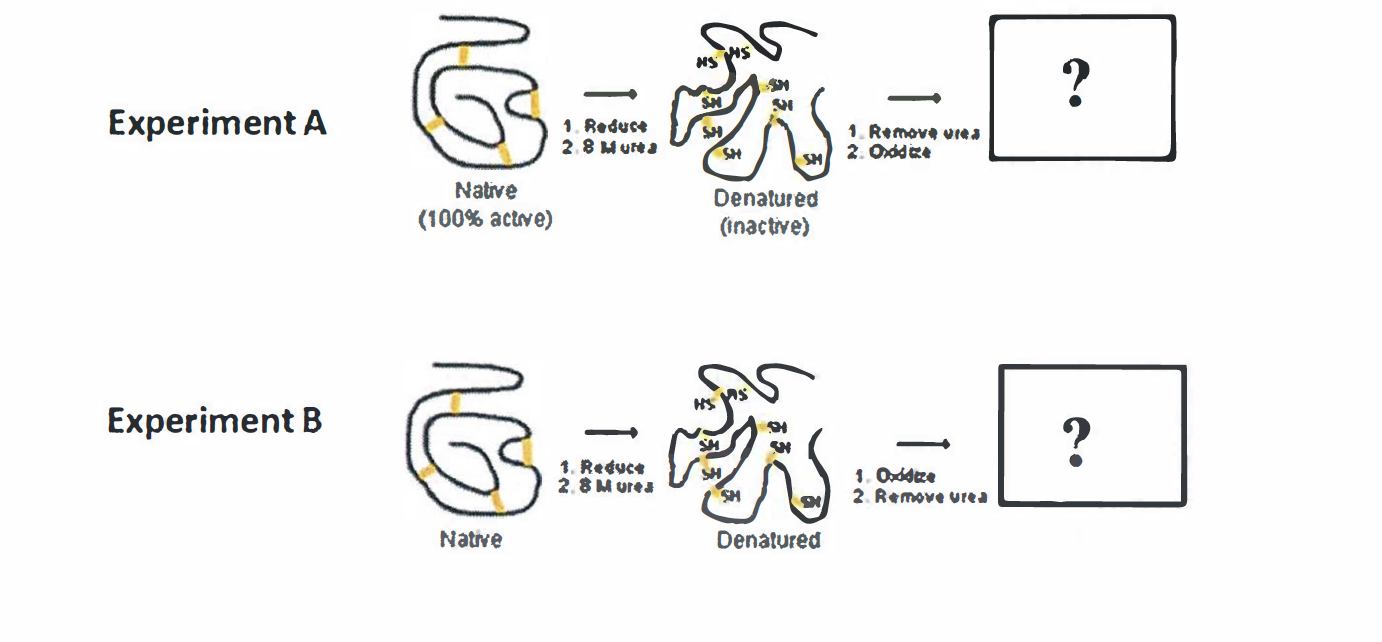
Experiment A: 45:23s
- Remove urea
- Oxidize
没有听清,需要笔记
mercaptoethanol: is used to reduce disulfide bonds and can act as a biological antioxidant by scavenging hydroxyl radicals (amongst others). Ribonuclease: Ribonuclease is a type of nuclease that catalyzes the degradation of RNA into smaller components.
The whole process could be the reverse of previous figures
native protein with disulfide bond -> add
mercaptoethanol -> break disulfide bond -> add urine -> convert the secondary or tertiary structure to primary structure -> it will become the correct configuration If we remove urea in the primary sequence, the hydrogen bond could not be formed and thus disulfide bond could be influenced and break the bond randomly, the structure has already be constrained
Experiment B:
就是Anfinsen Experiment 里写的那样 (随机组合) will never become native form (先形成二硫键,然后protein的结构被束缚constrained,所以没有activity)
Reform the correct structure gradually (because the peptide could find its own way to reform)
Nobel price:”for his work on ribonuclease, especially concerning the connection between the amino acid sequence and the biologically active conformation”
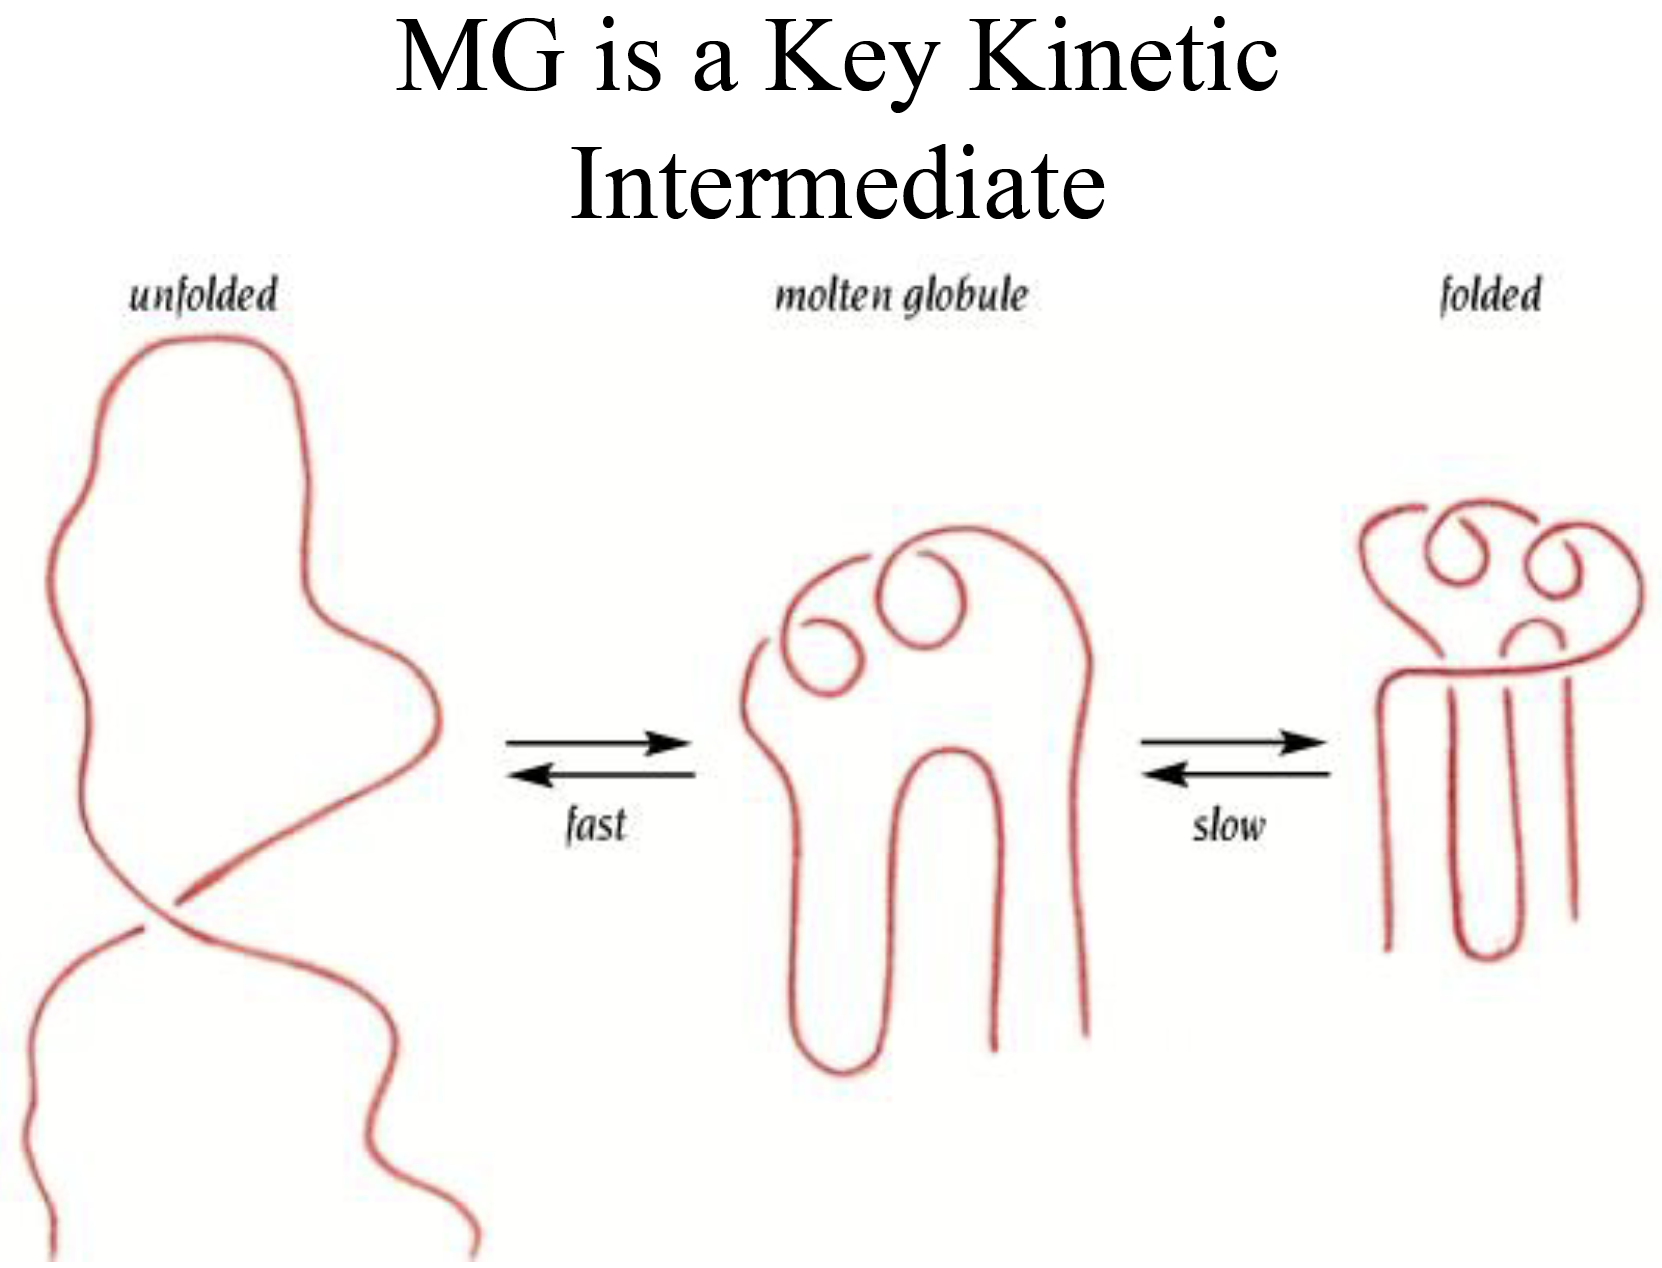
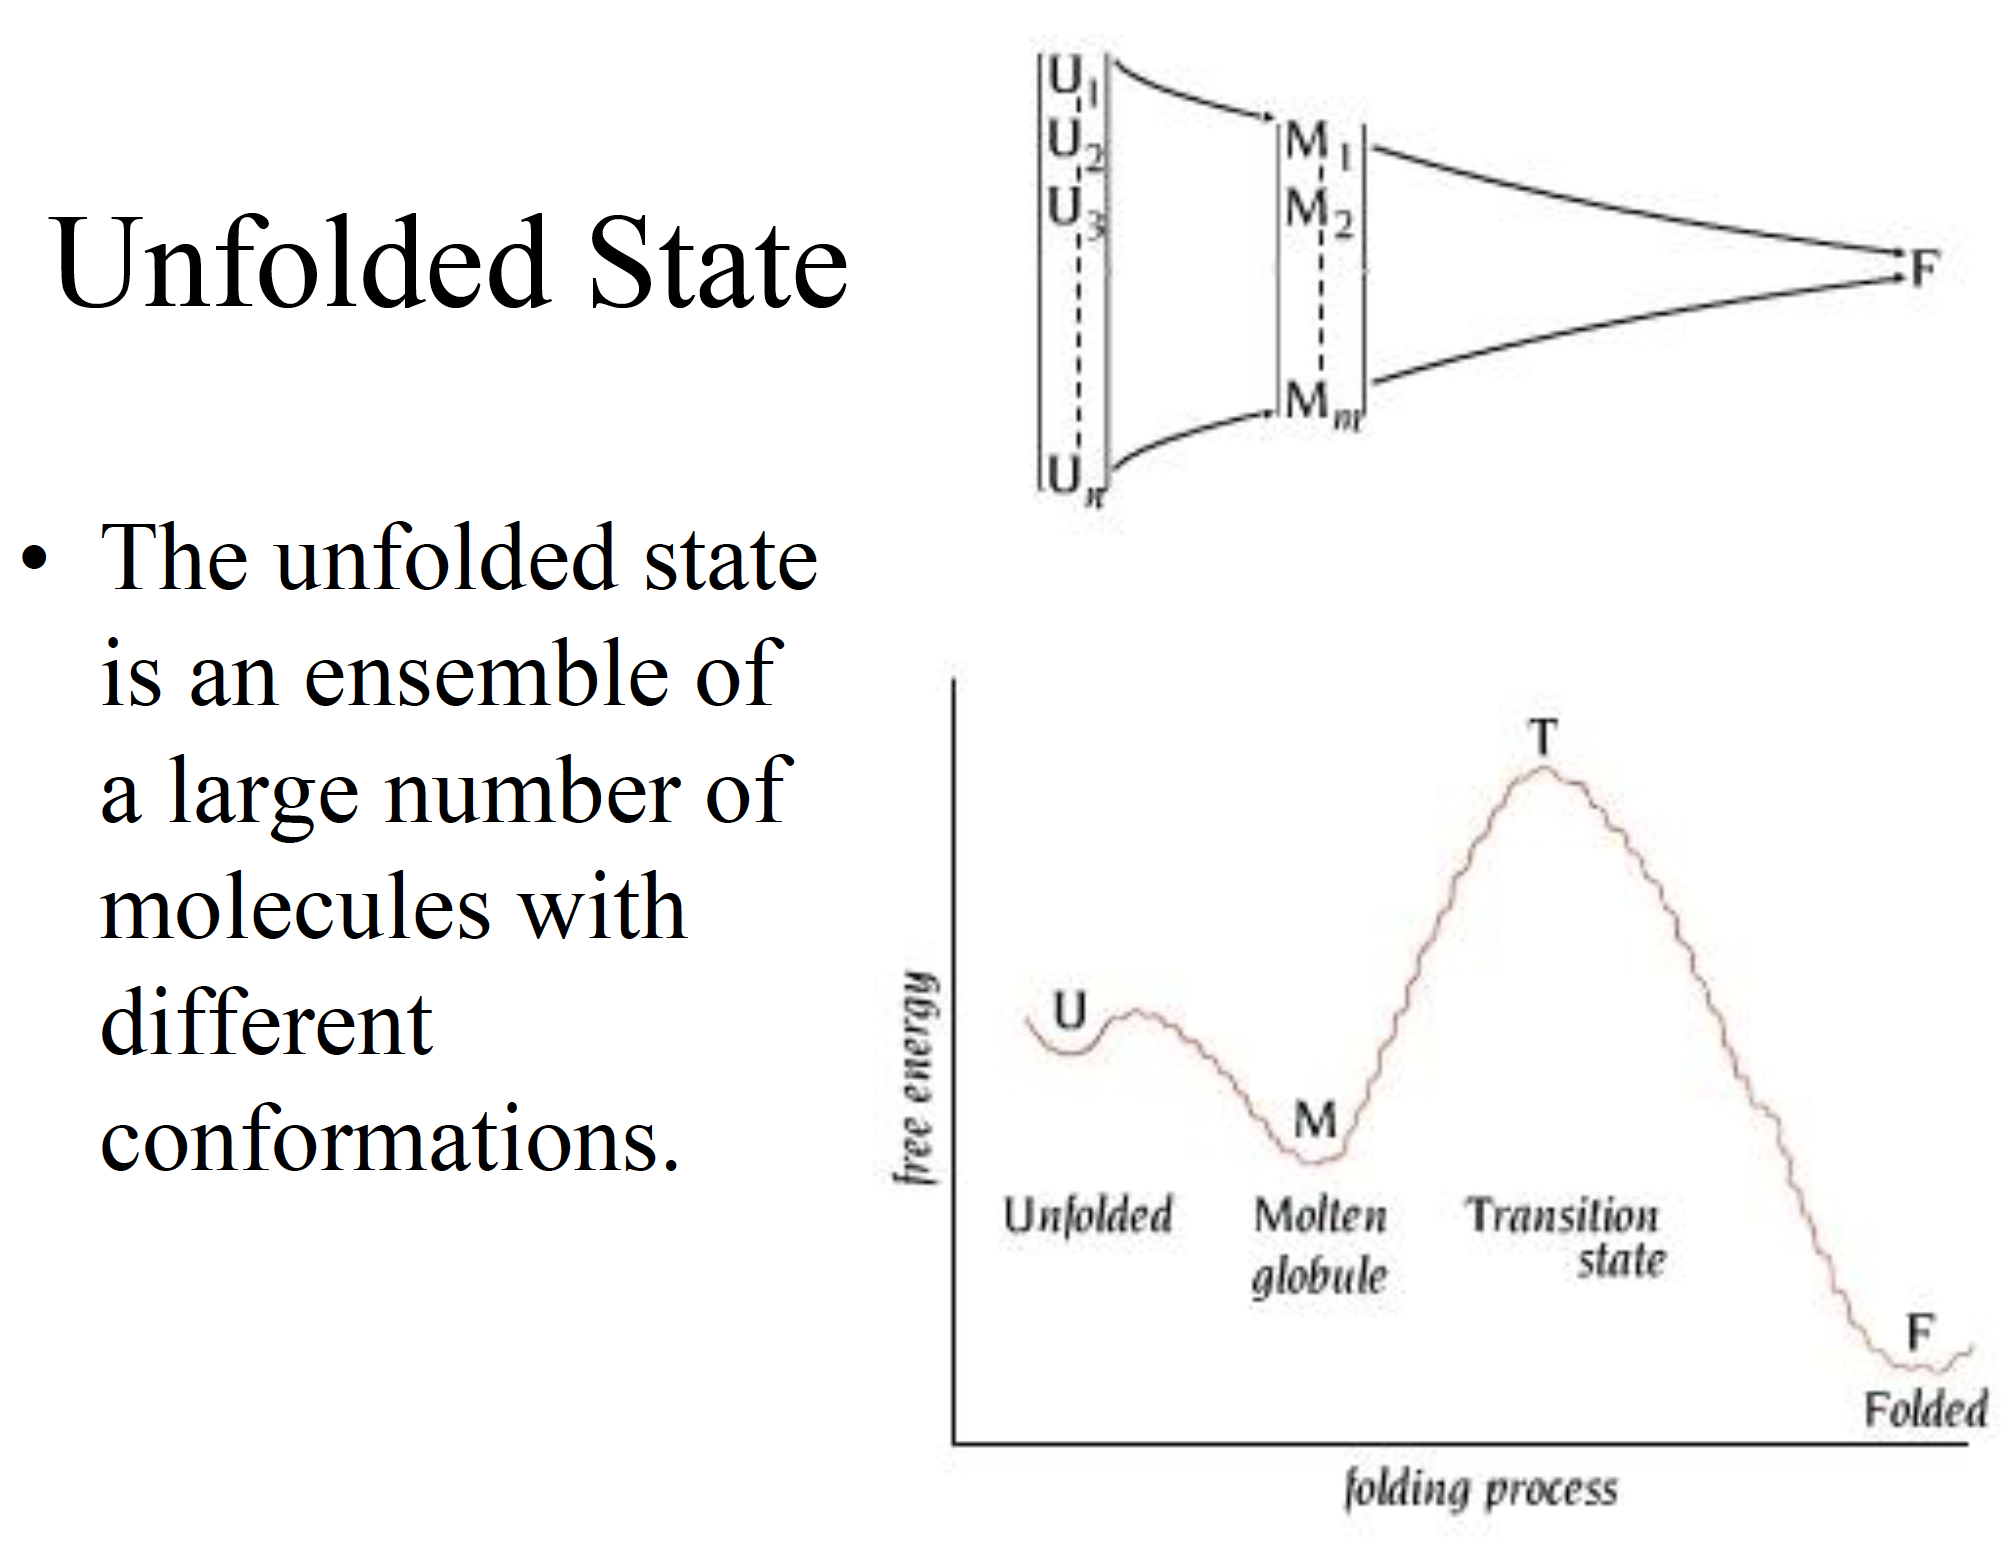
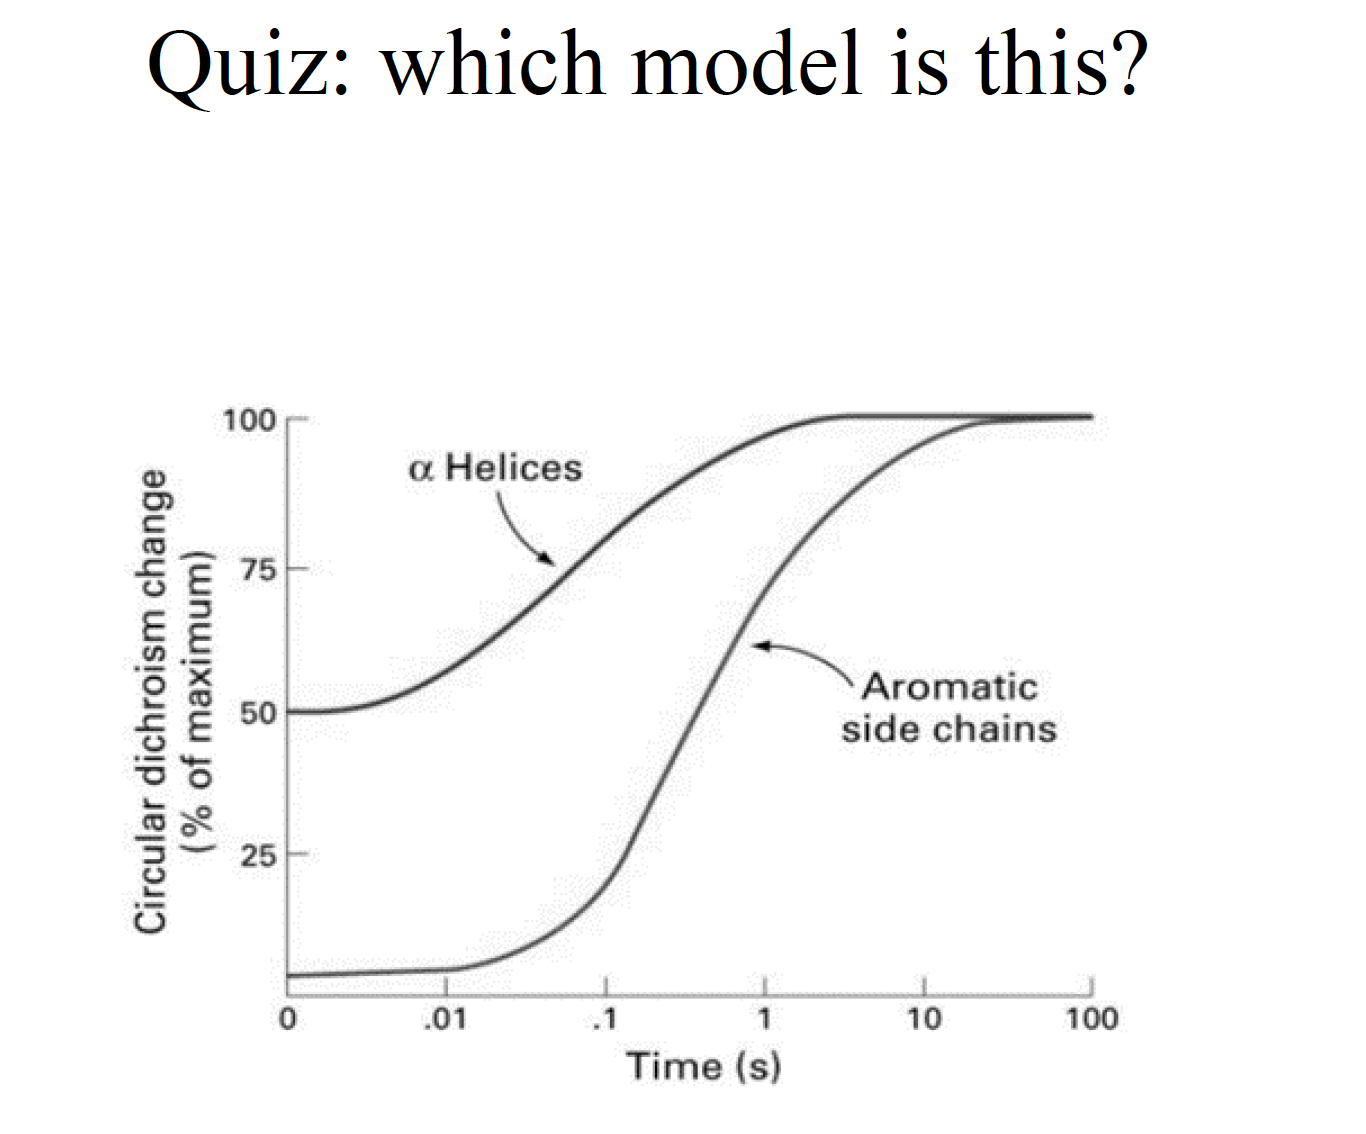
Molten Globule State (MG)
- It is an intermediate of the folding transition U→MG→F
- It is a compact globule, yet expanded over a native radius
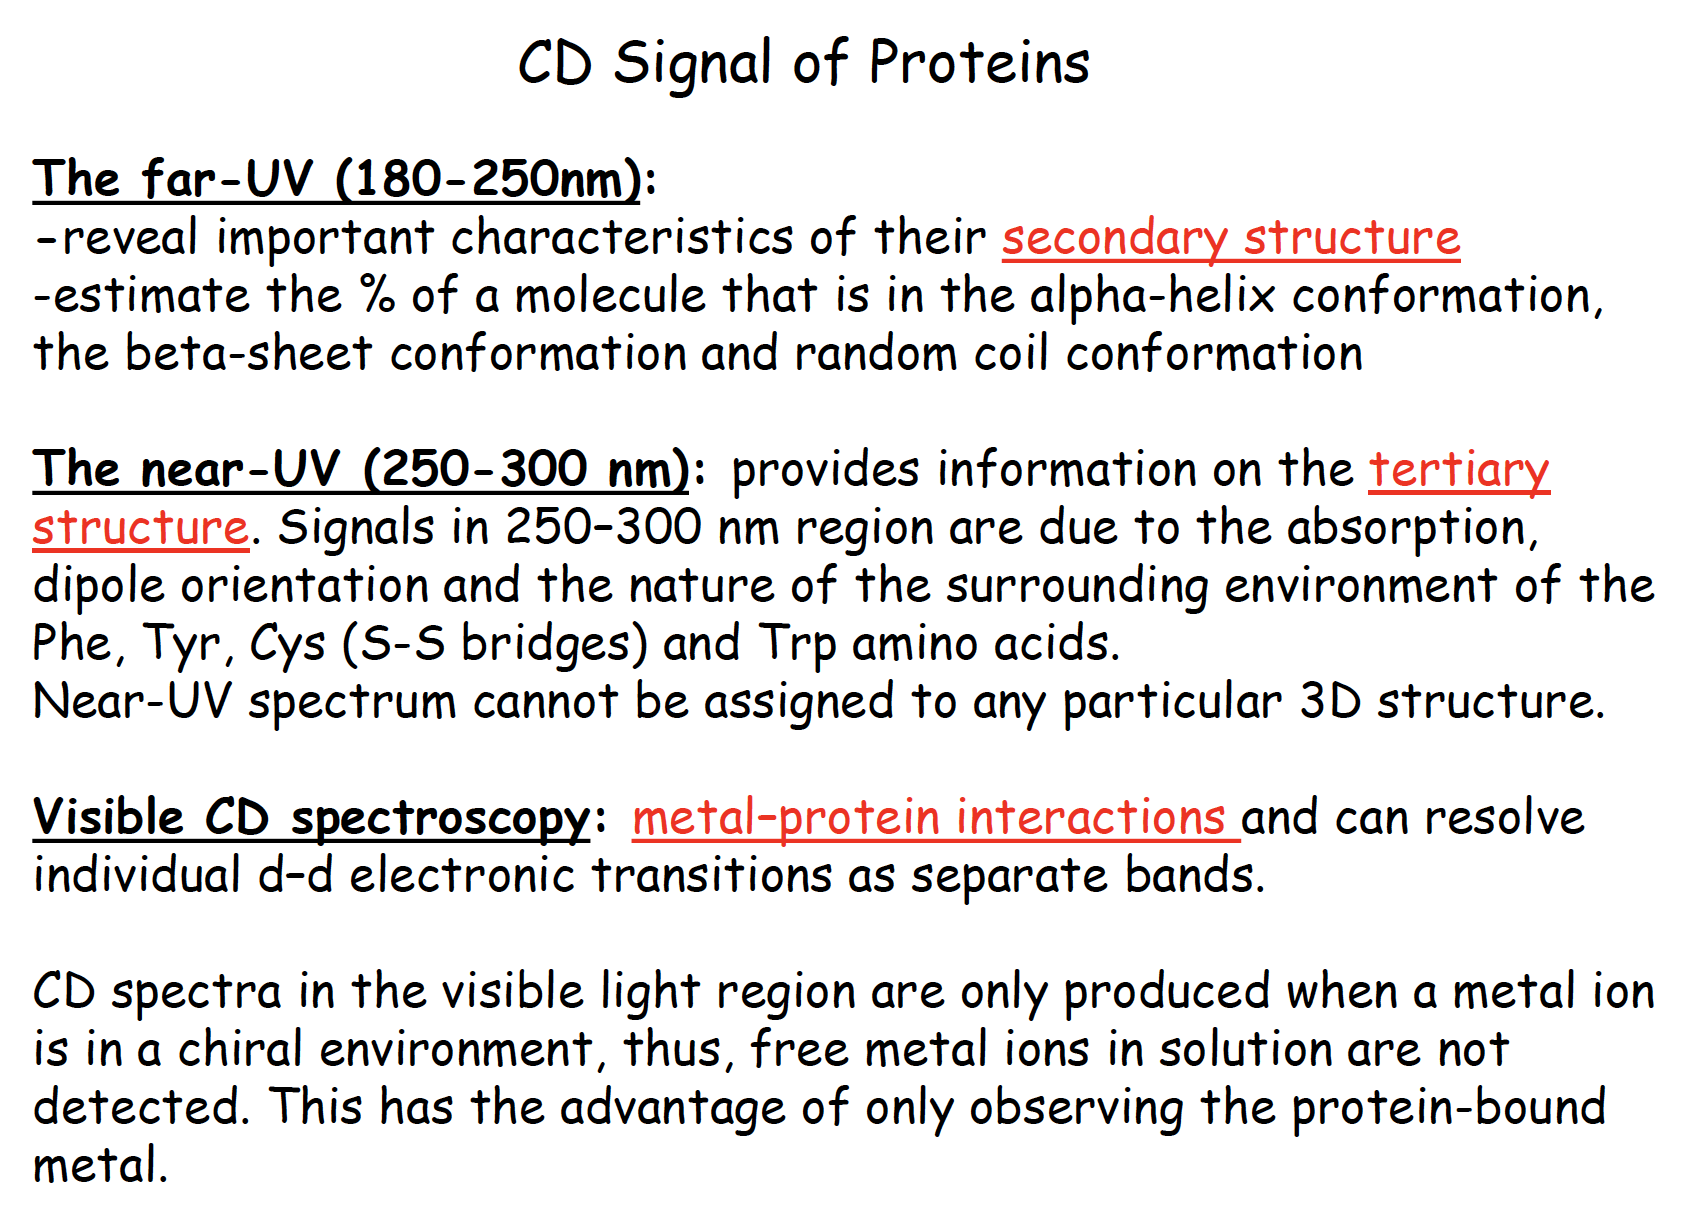
- Native-like secondary structure, can be measured by CD and NMR proton exchange rate
- It has a slowly fluctuating tertiary structure which gives no detectable near UV CD signal and gives quenched fluorescence signal with broadened NMR chemical peaks
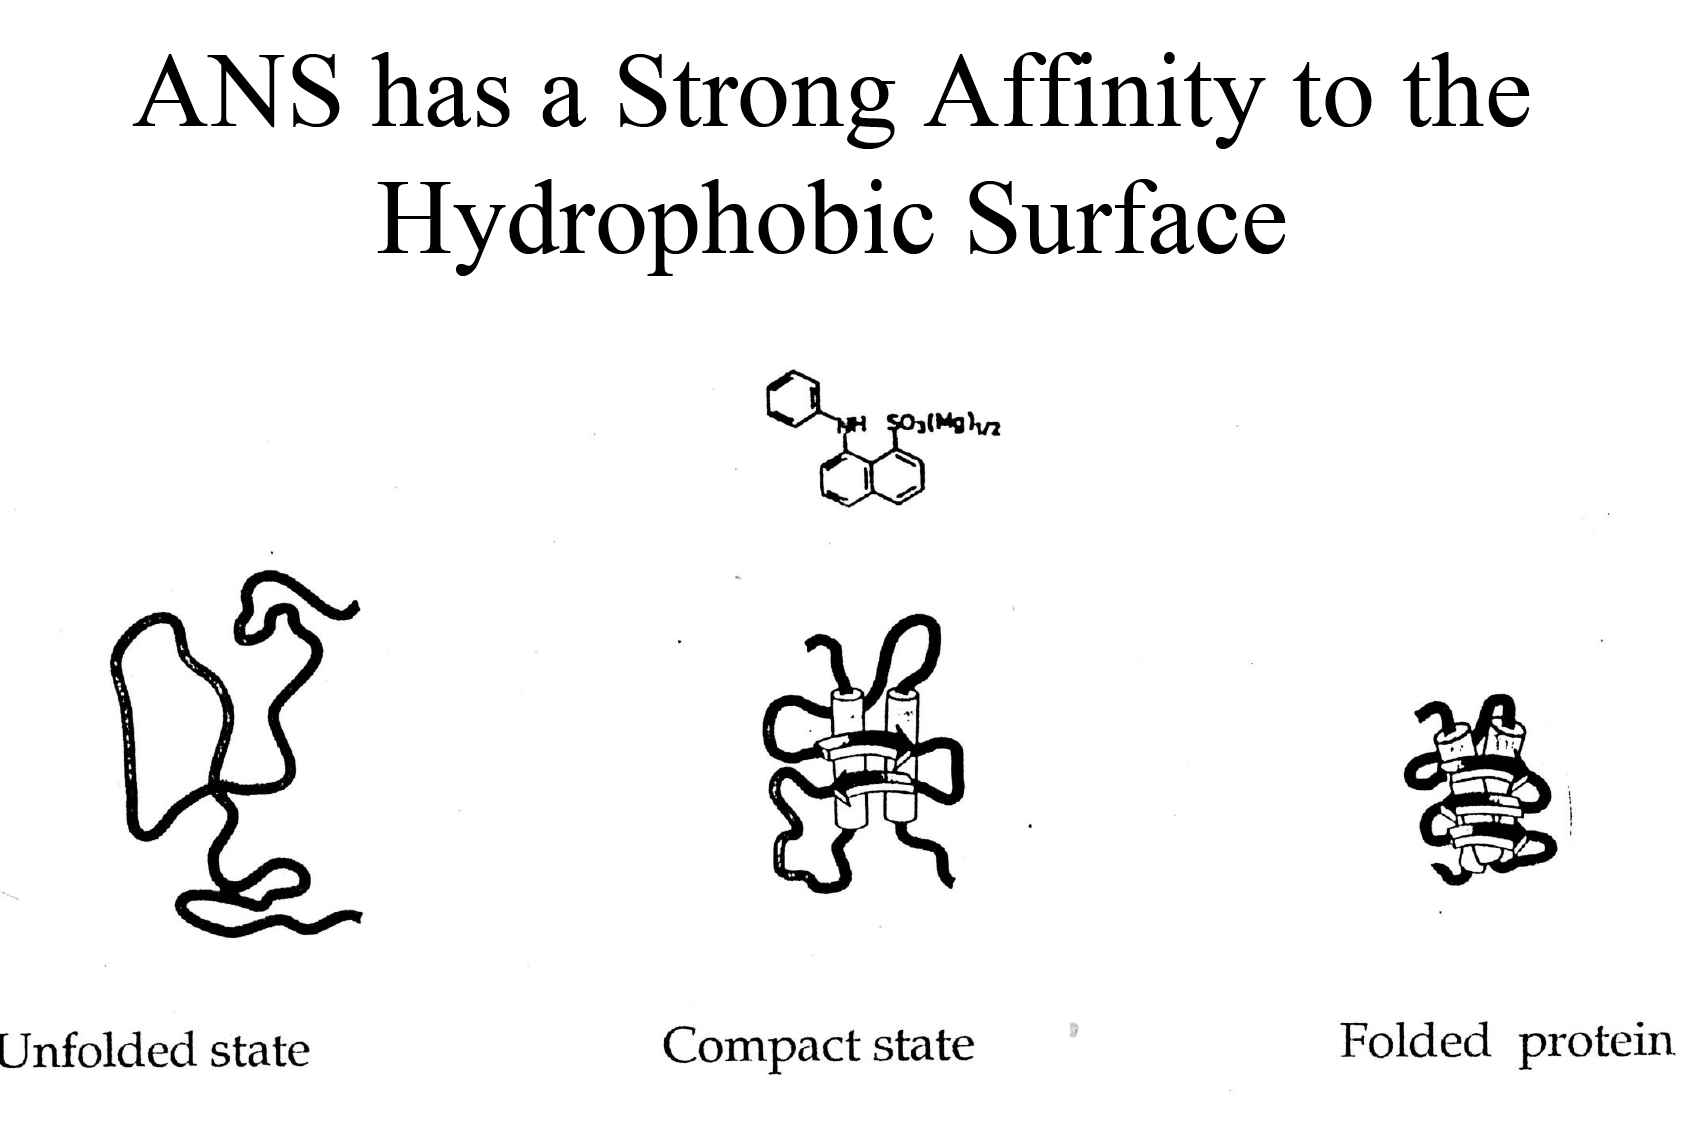
- Non-specific assembly of secondary structure and hydrophobic interactions, which allows ANS to bind and gives an enhanced ANS fluorescence
- MG is about a 10 % increase in size than the native state
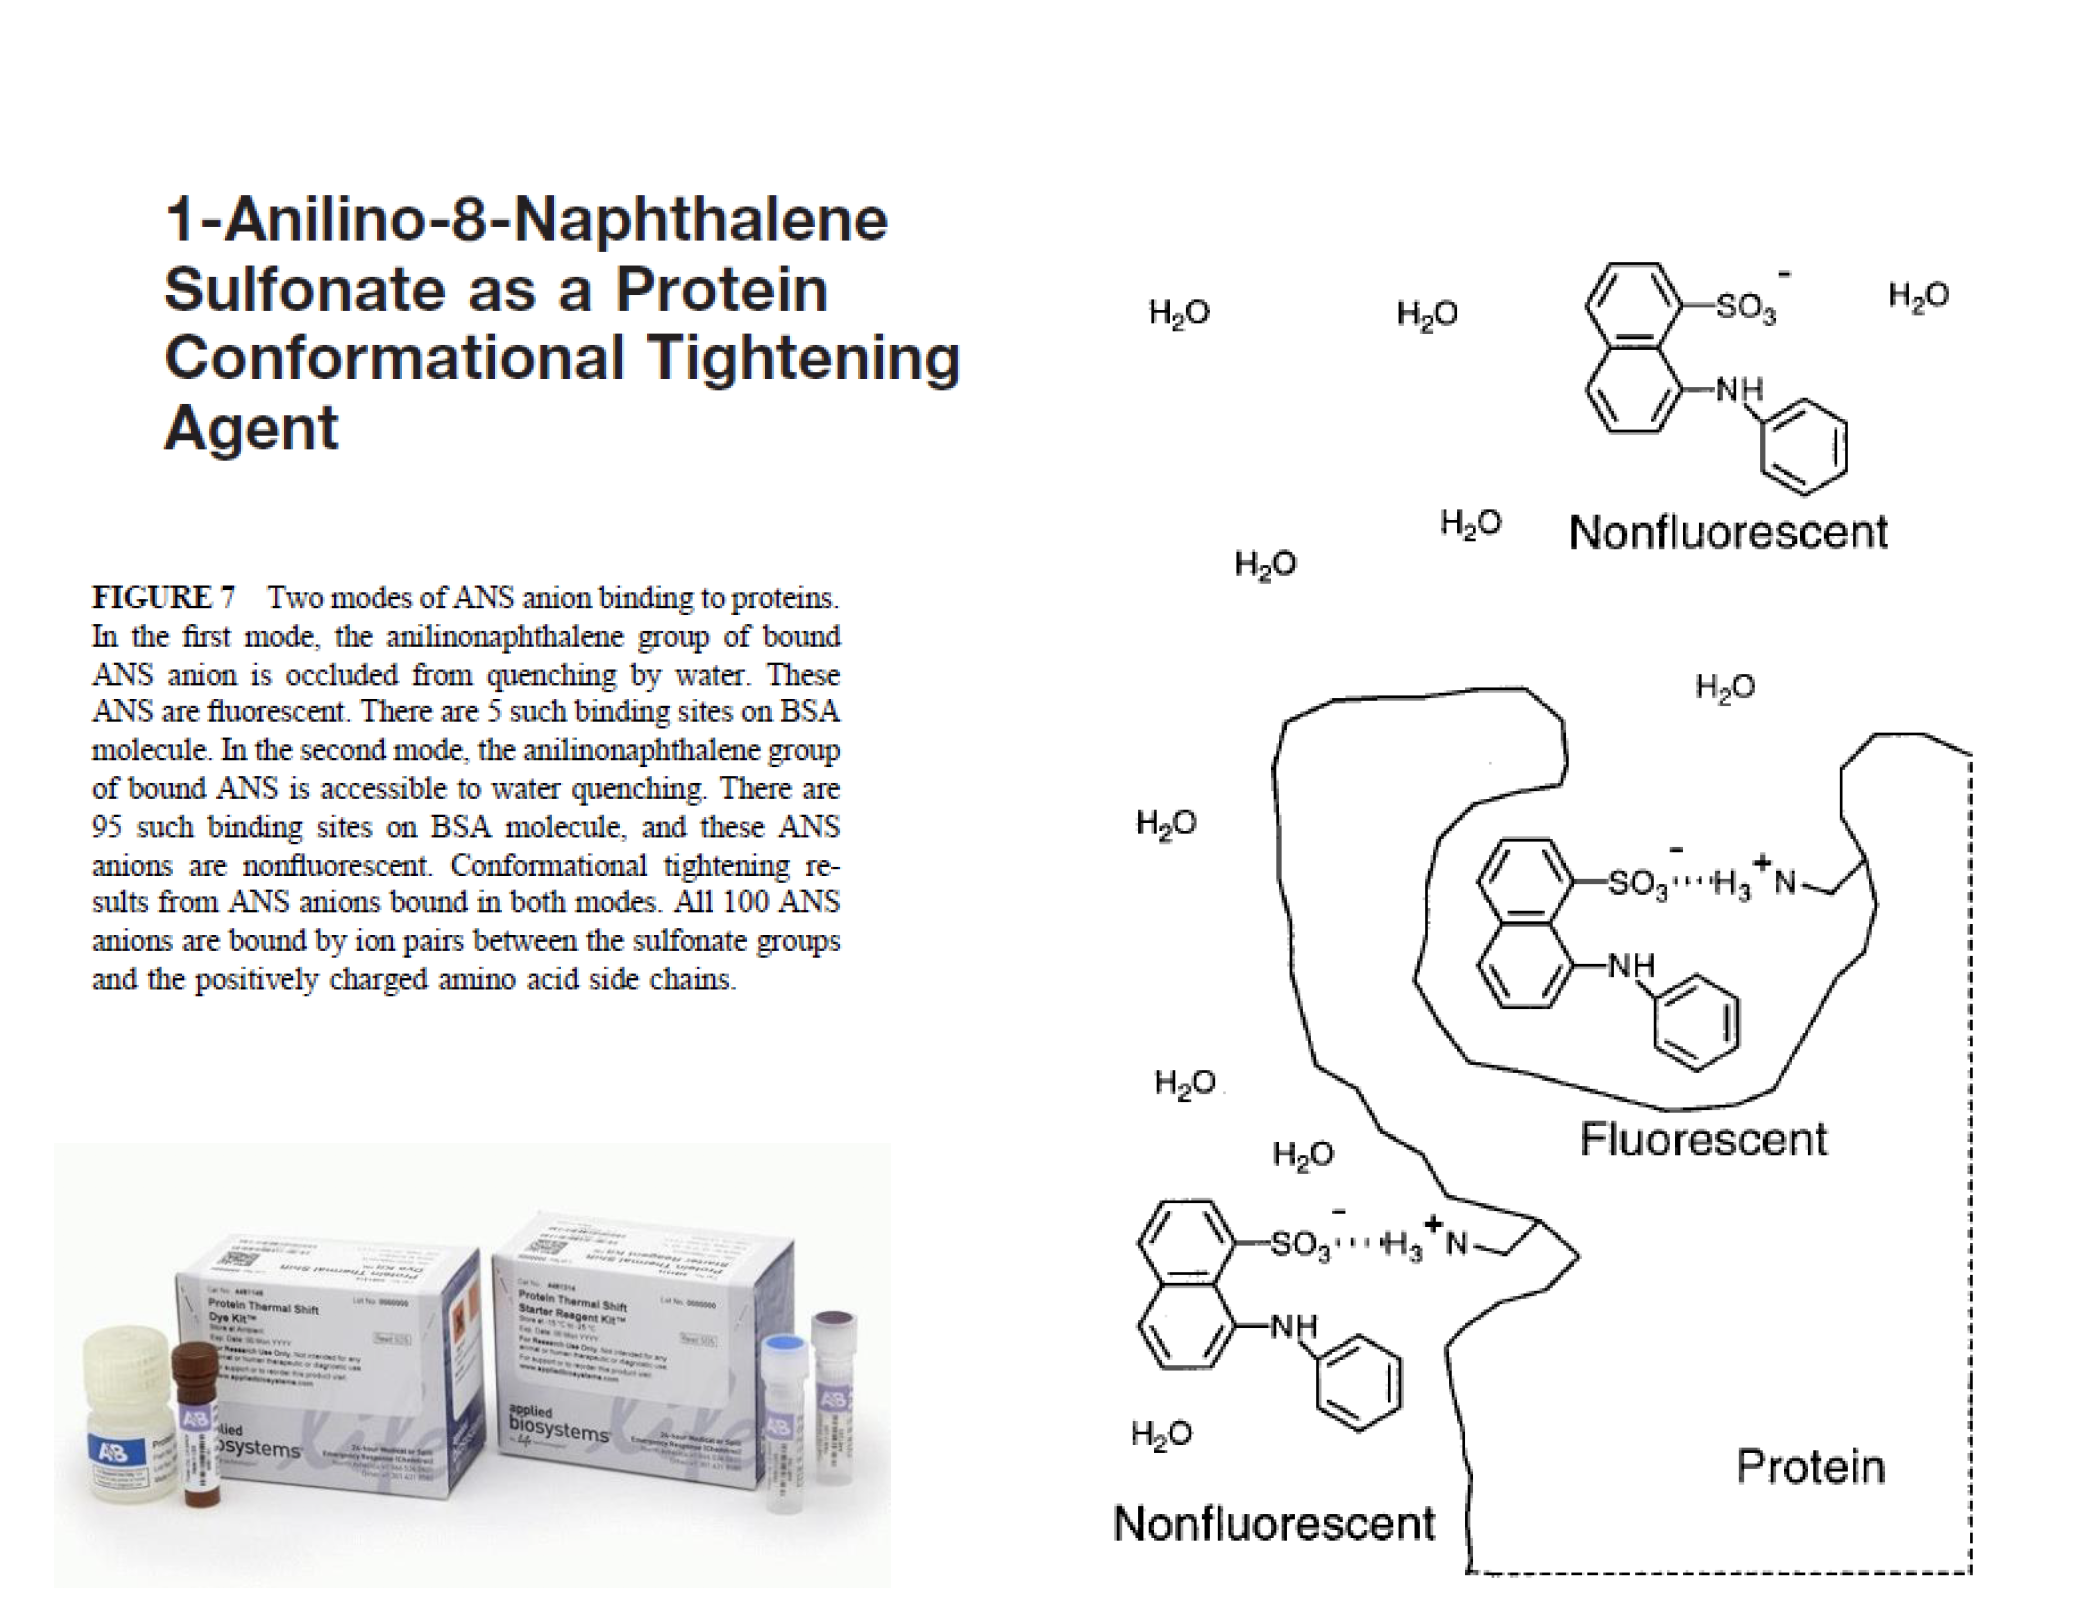
ANS as a hydrophobicity measuring
Protein melting (thermal shift)
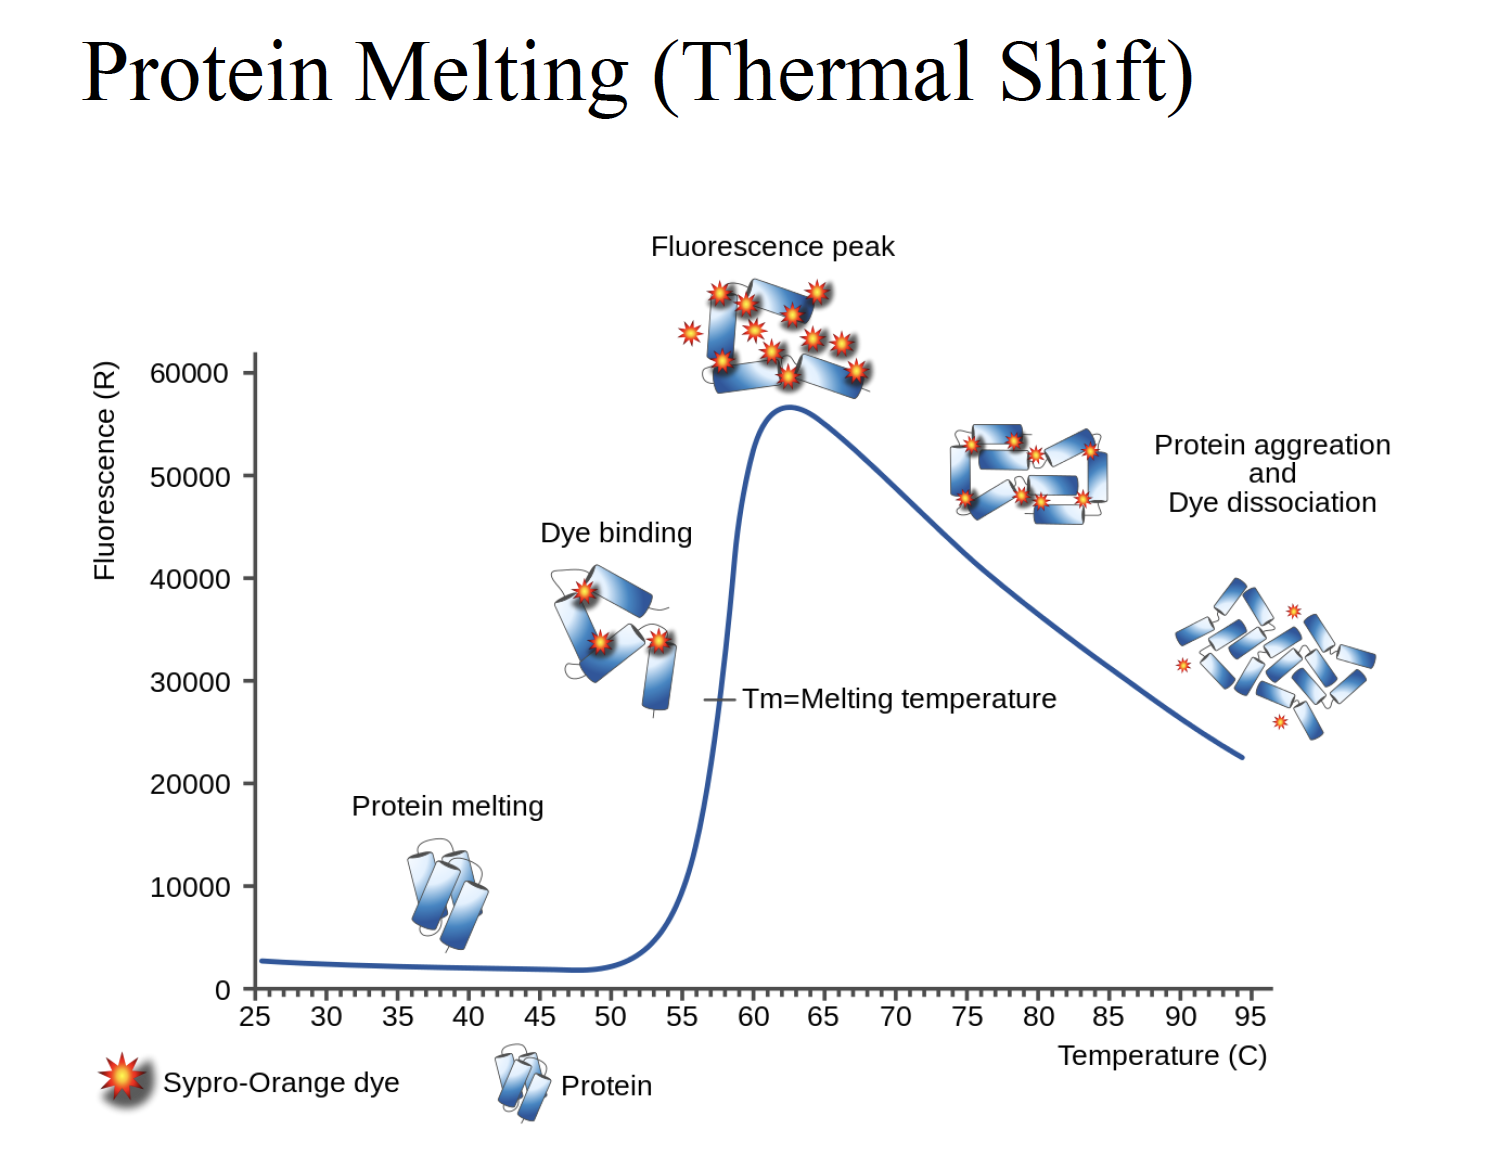
Why intensity of fluorescence goes down as temperature goes up?
The protein would become precipitate out and become denature protein, no longer soluble (70-90 degree)
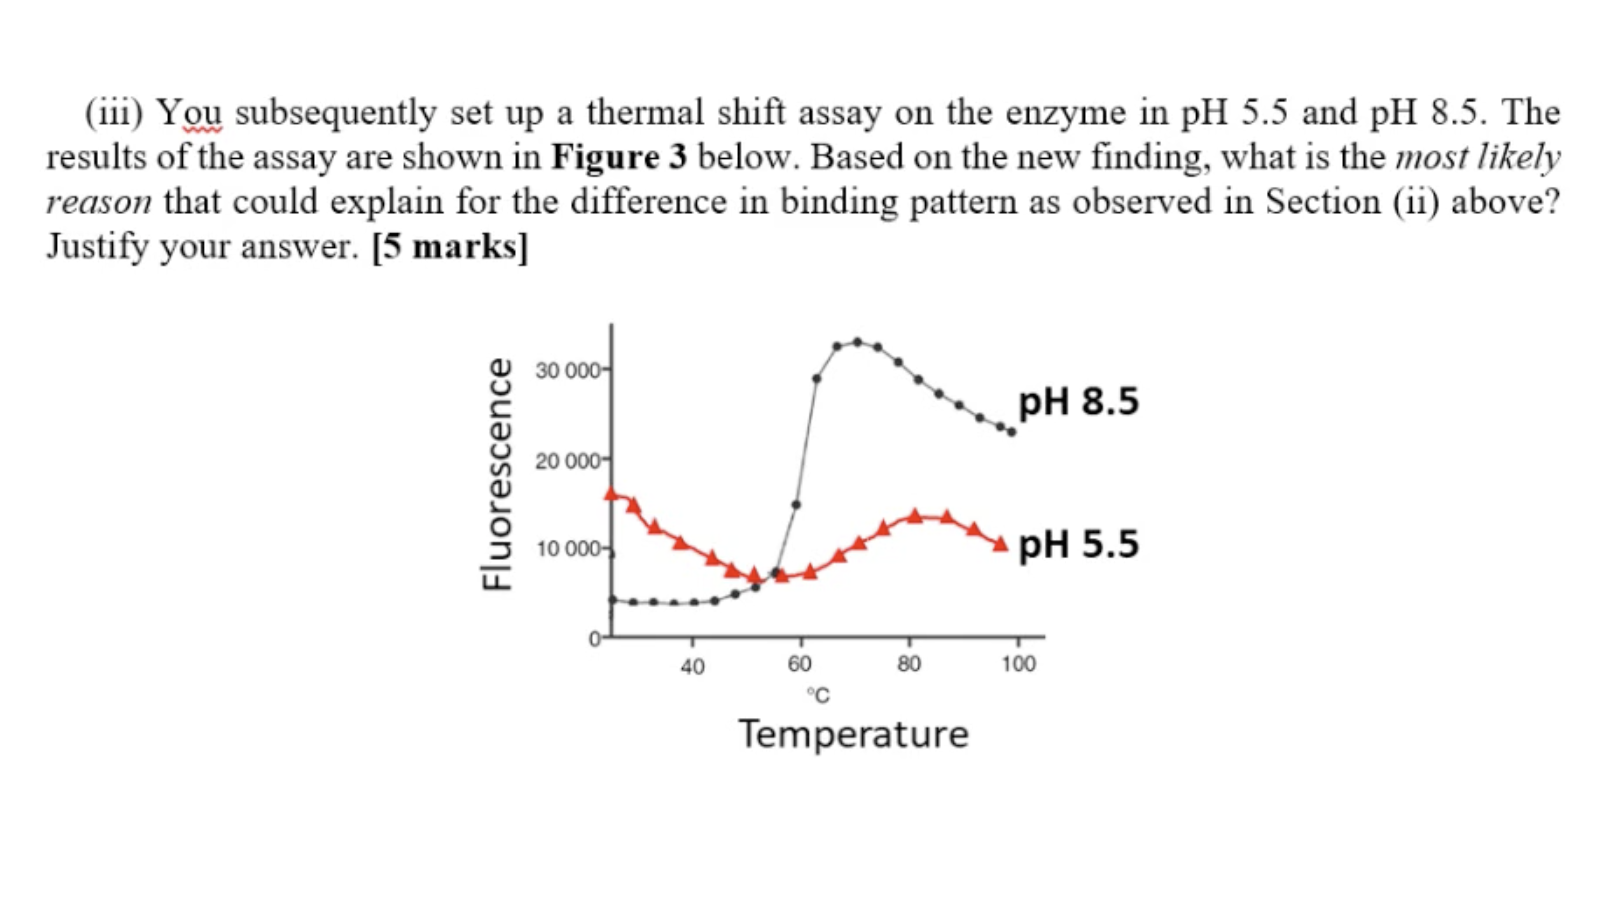
ph5.5: the protein cell does like this ph, the protein already semi-denatured. So the core of the residue would be exposed. Even at room temperature, the protein already semi-denatured. So increase the PH to suitable
Ph8.5 In the second part (>75), the scope is very shallow, suggesting (sharp) precipitation (aggregate) already. So when the temperature increased, there is not much protein to unfold, denature anymore.
Fluorescence:
- Would bind to the hydrophobic residues
- Normally it will not fluorescent until the protein is denatured and exposed to the environment
Fluorescence will not decay, quite stable
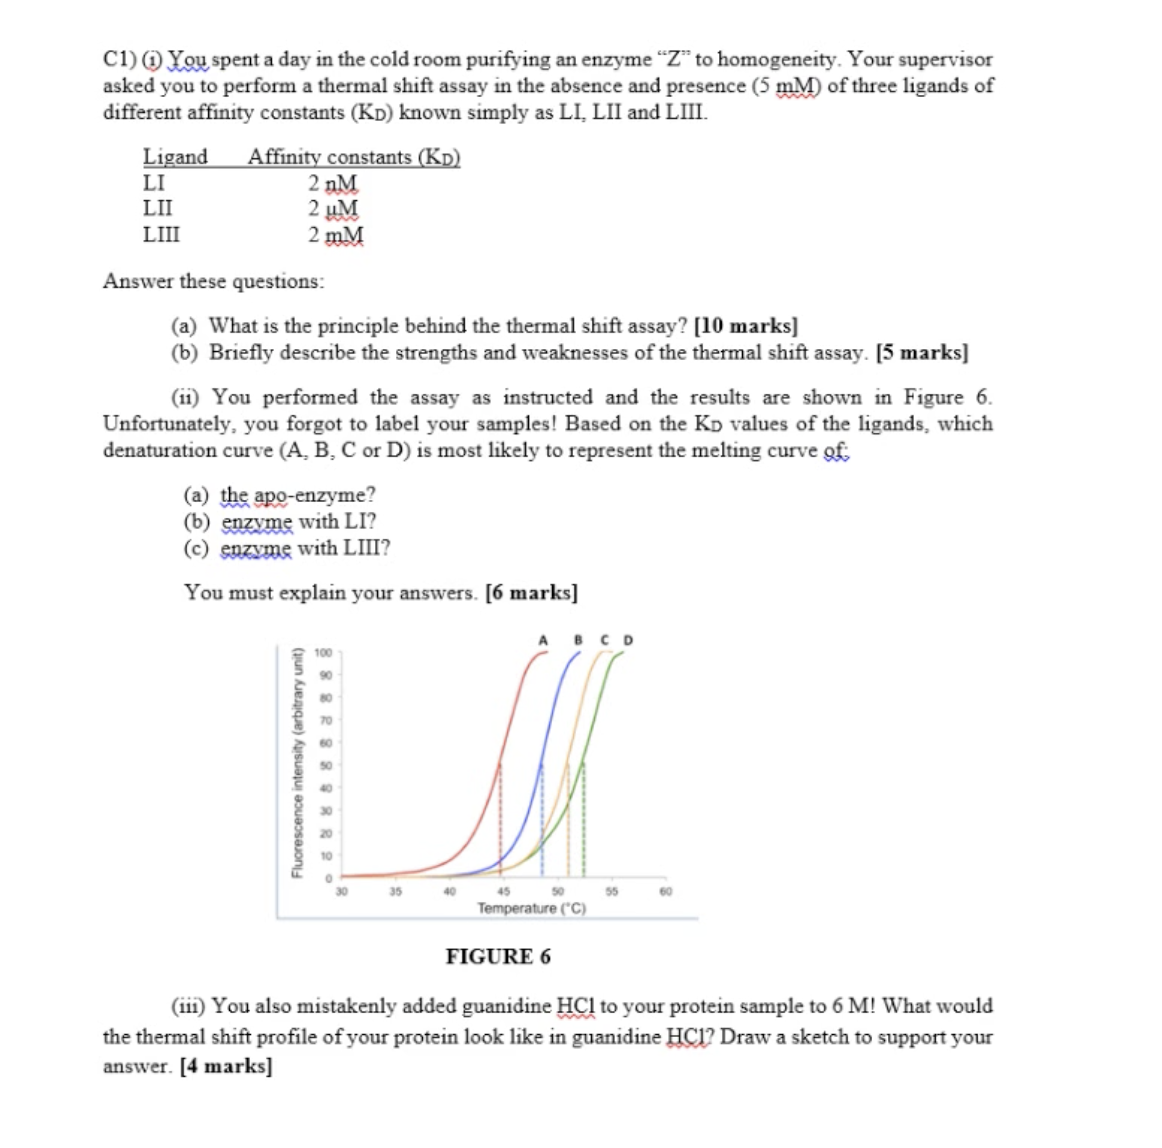
Apo-enzyme: without any ligands (control)
D is for ligand 1 since it has the highest affinity
A is apo-enzyme (without any ligand)
(iii) depends on the solubility of protein samples. HCL denatured the protein completel
Unfolded state
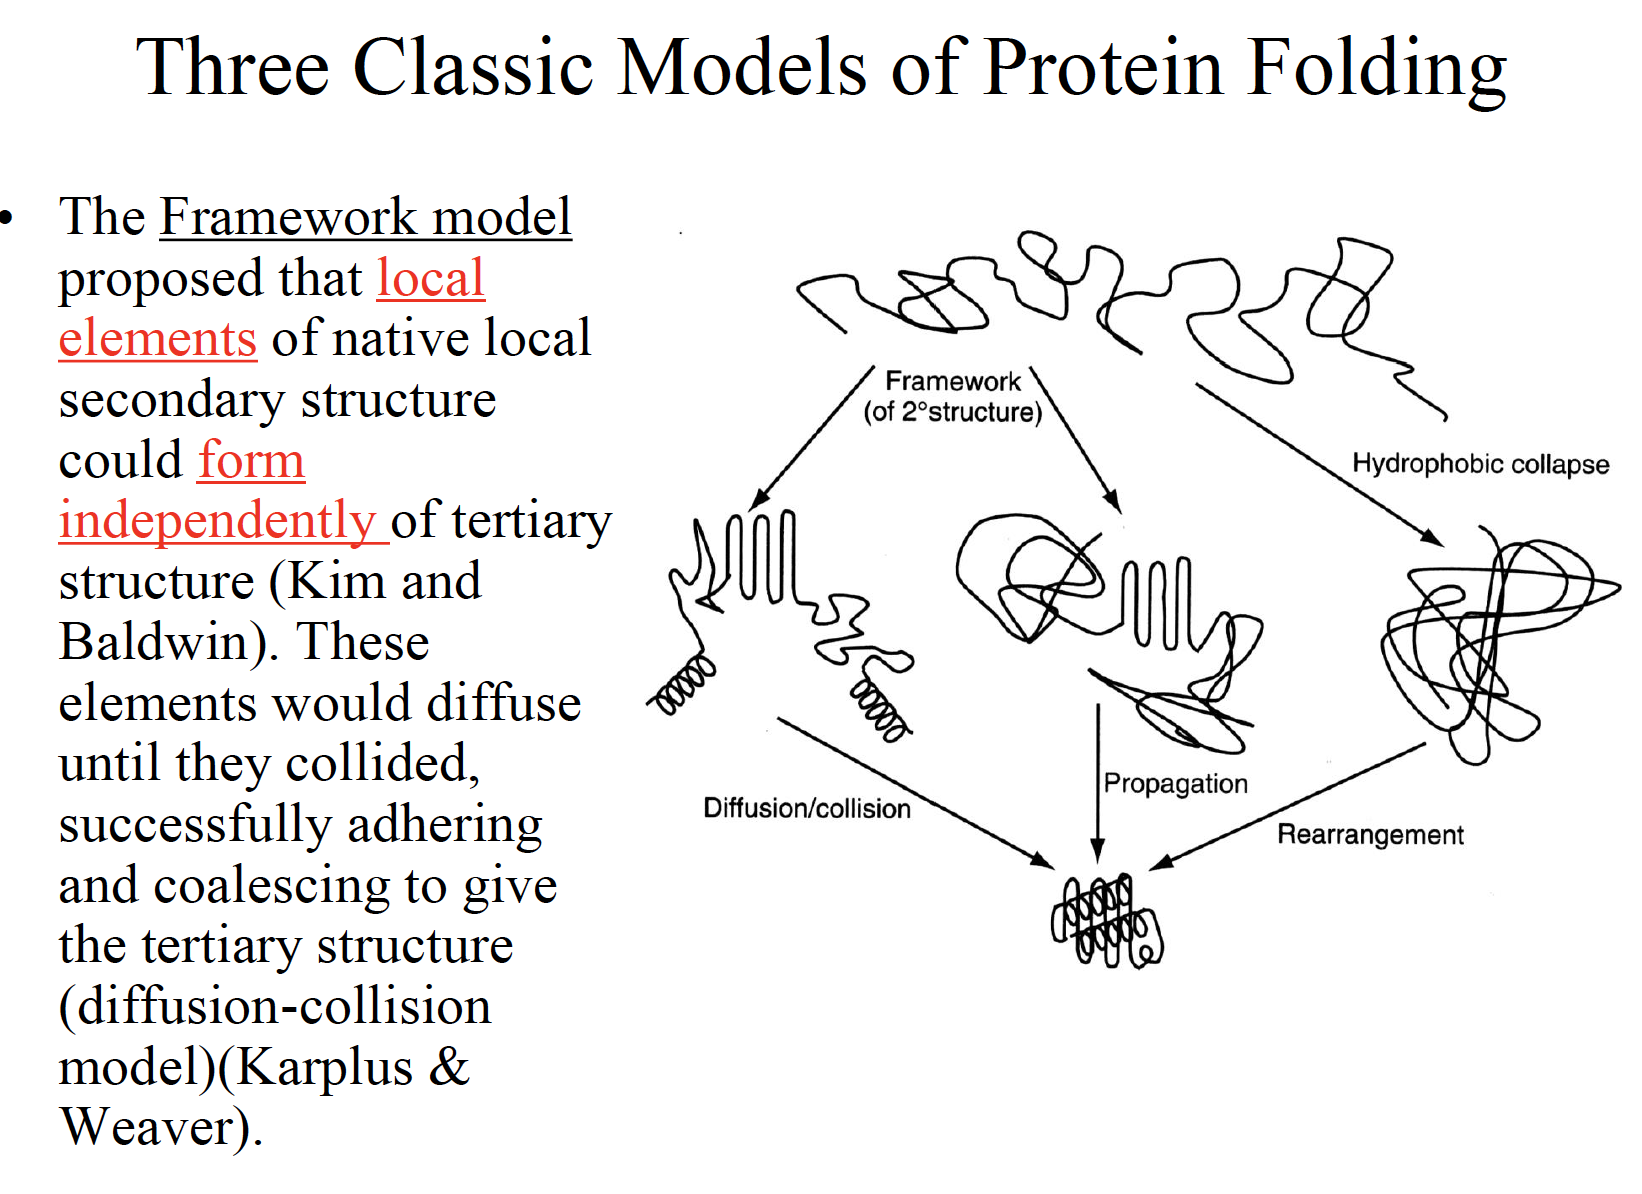
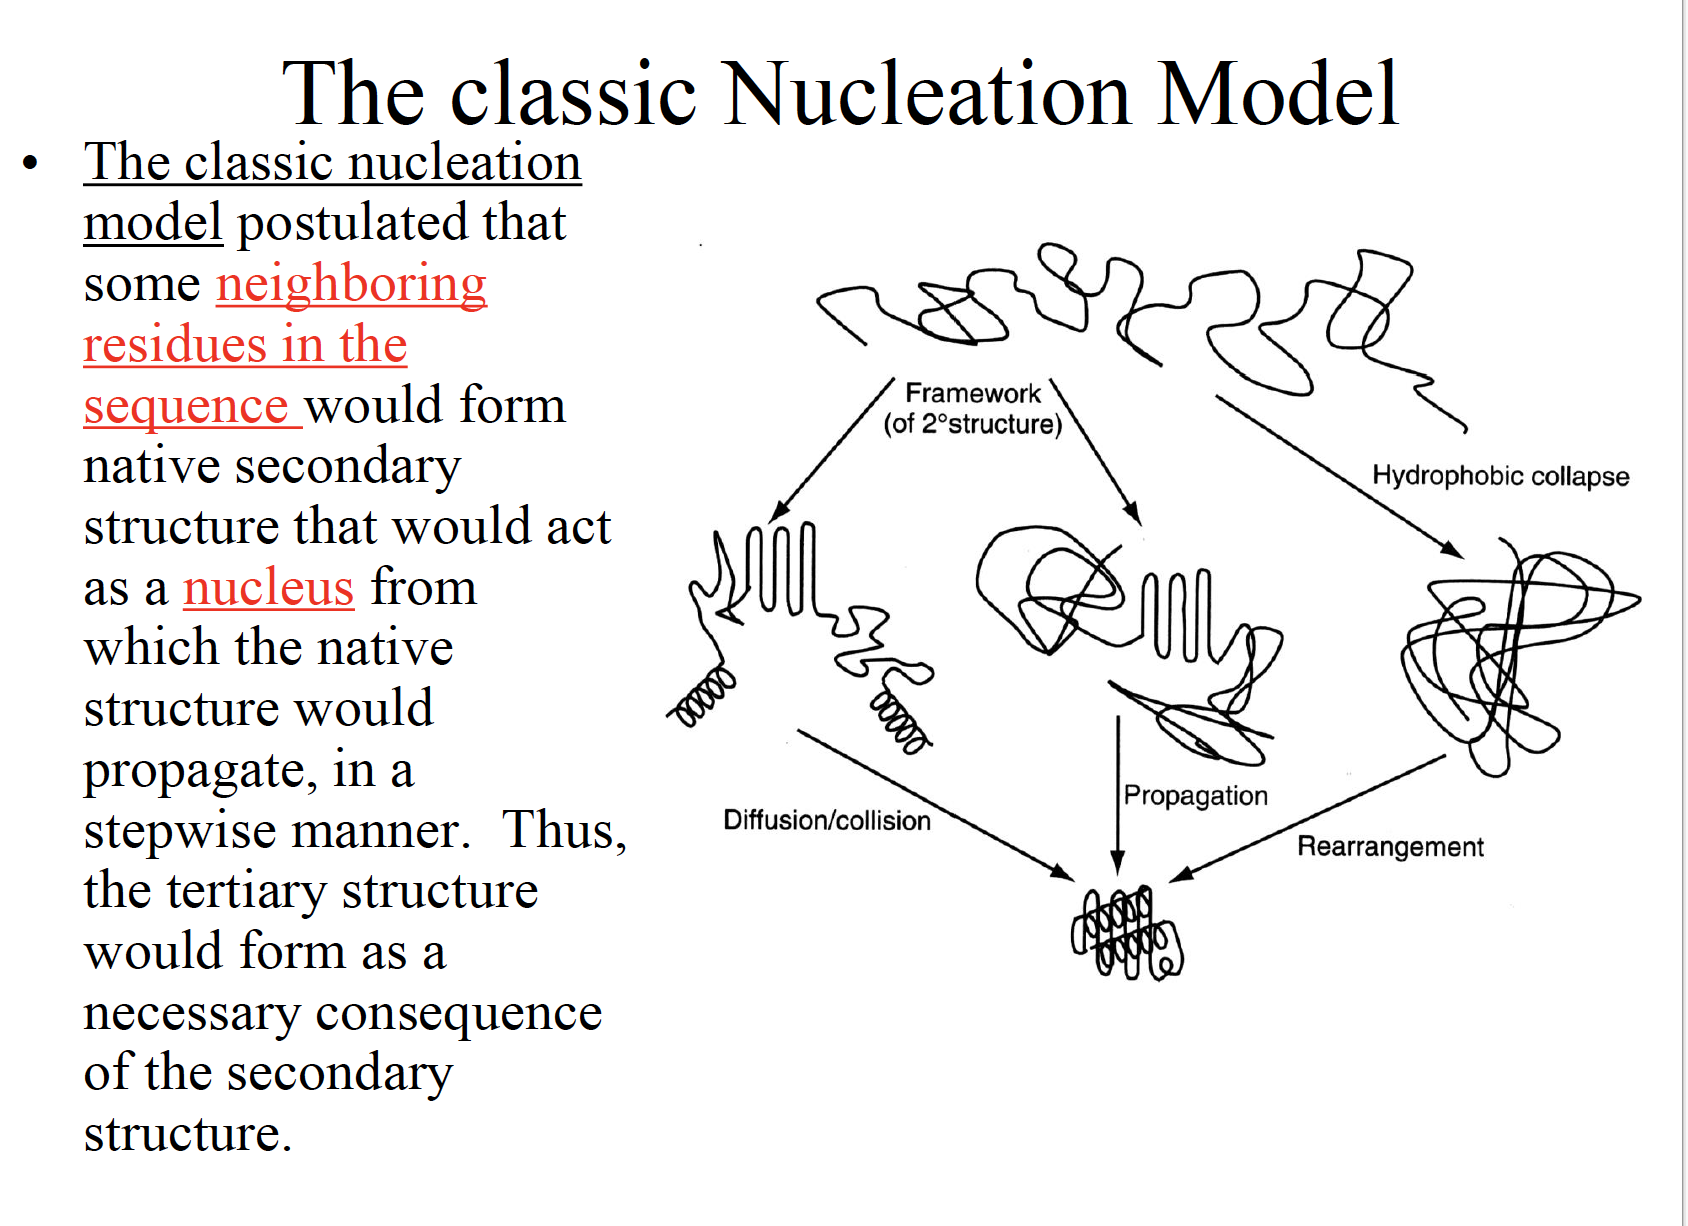
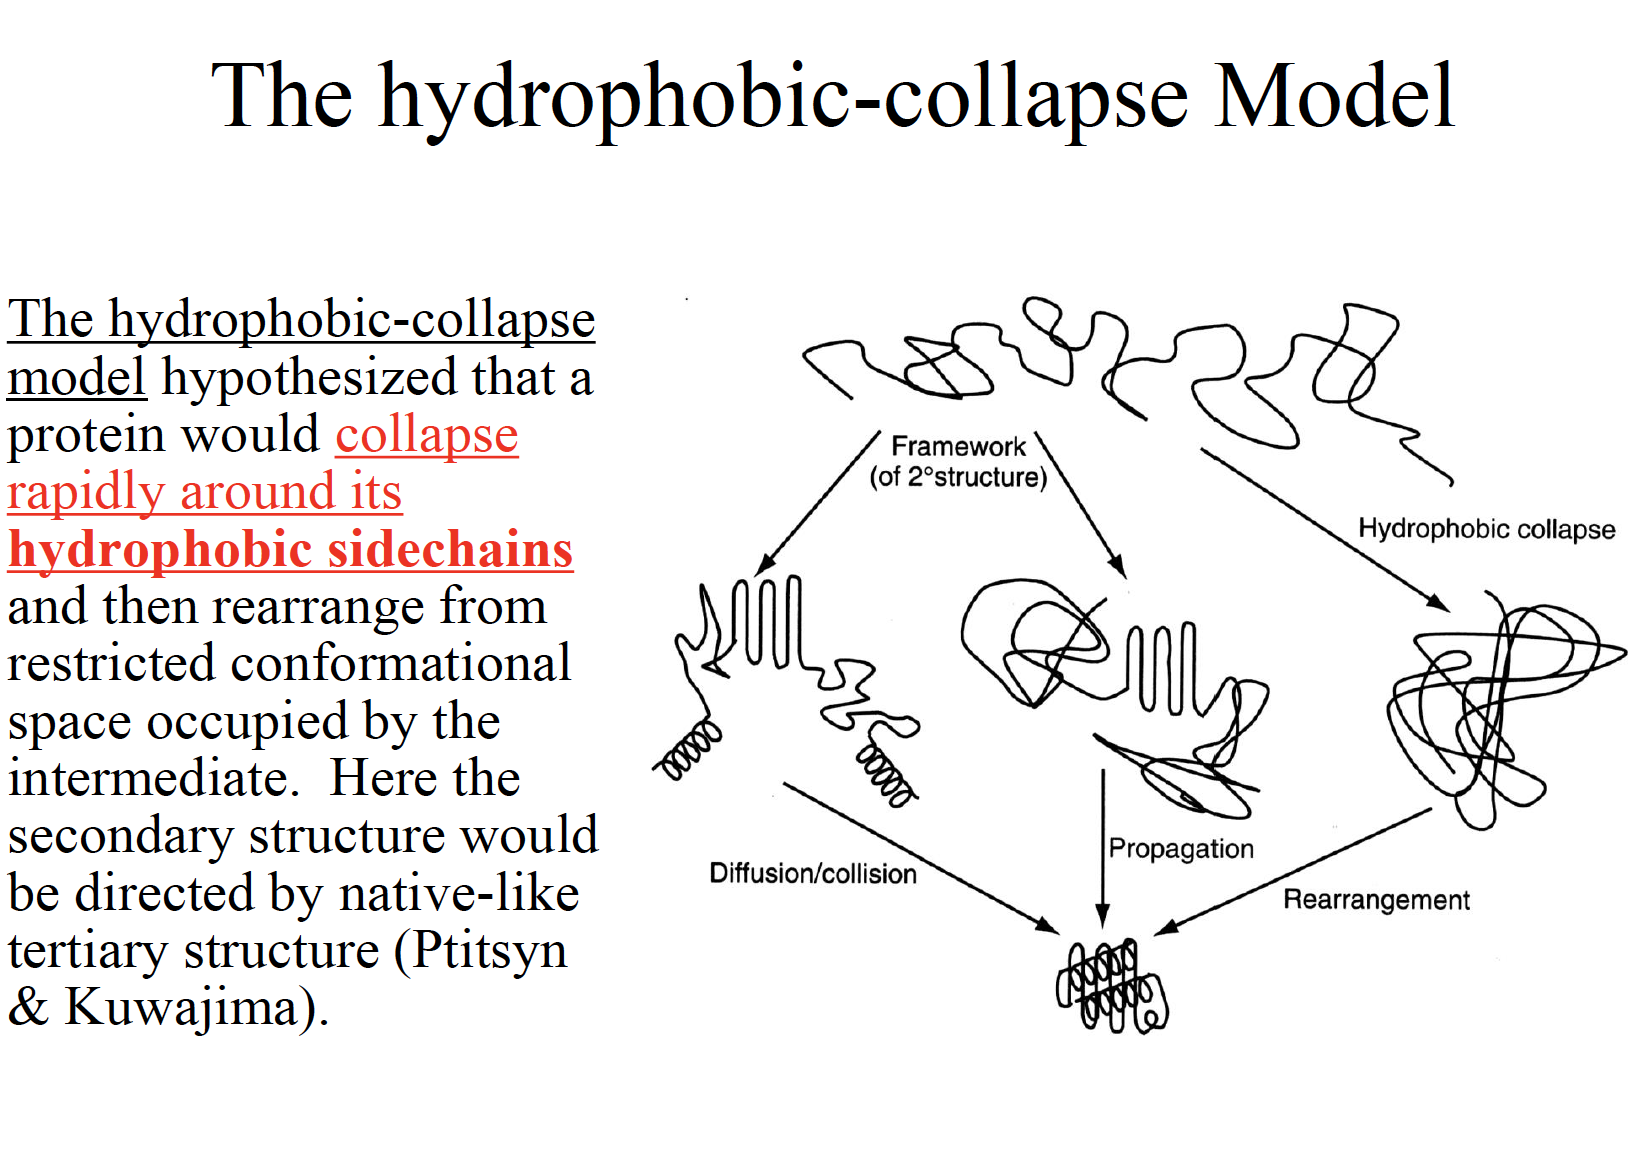
Three classic models of protein folding
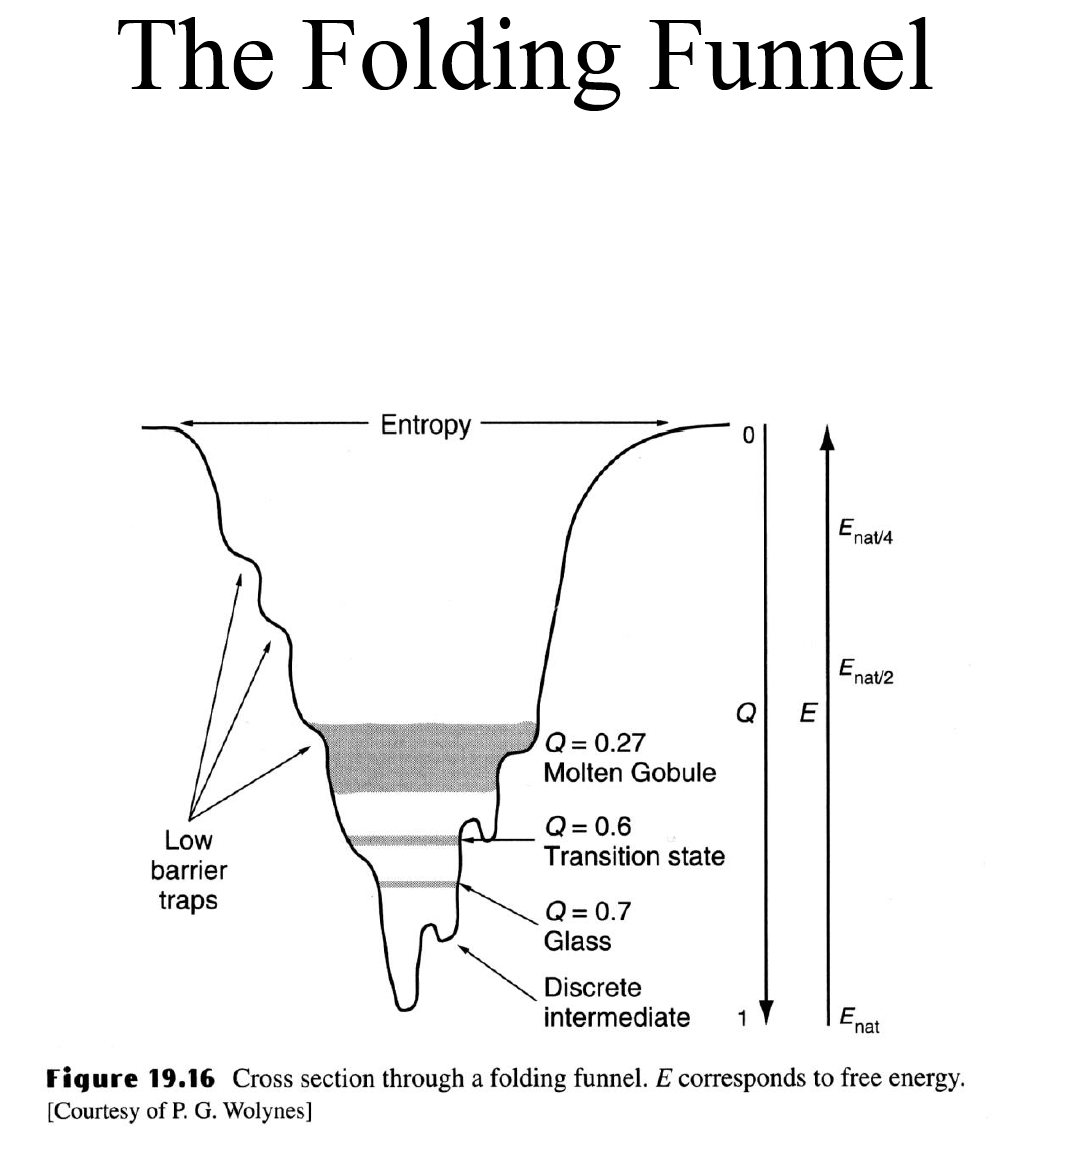
The folding funnel
Lecture 11 SPR
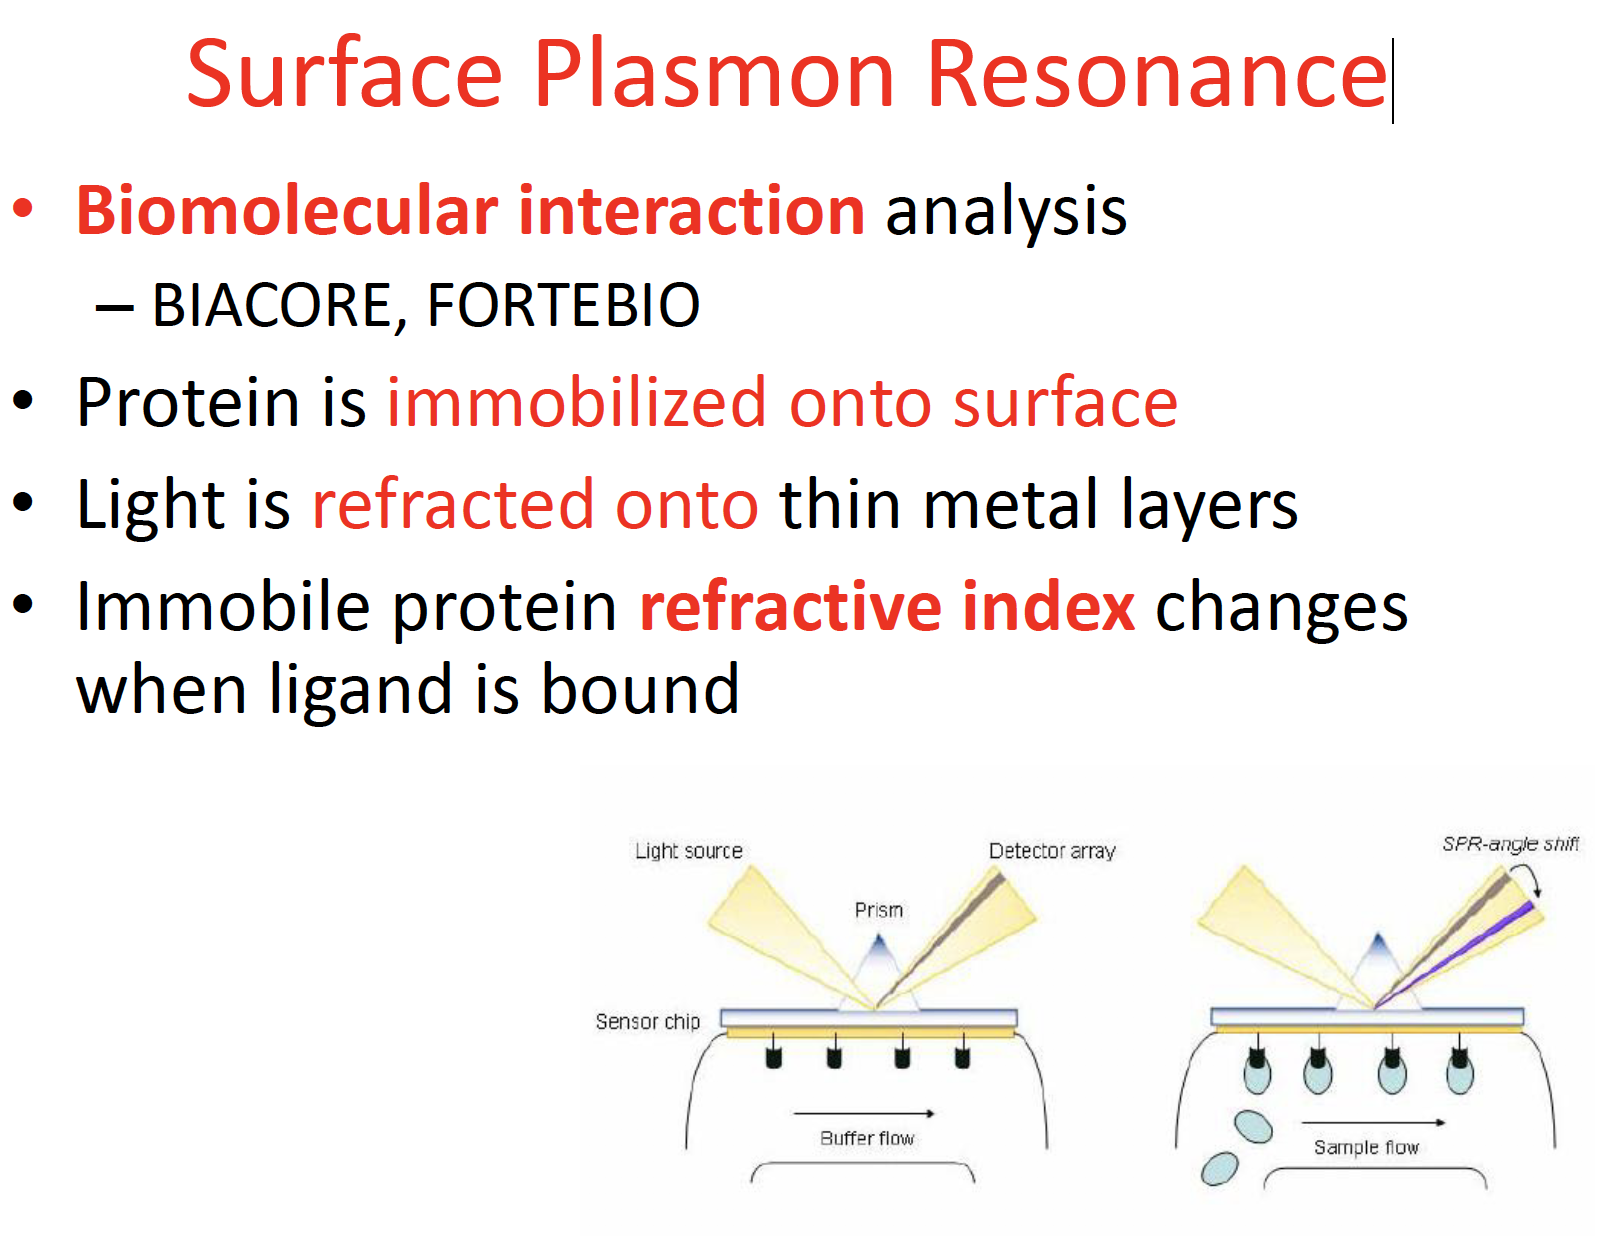
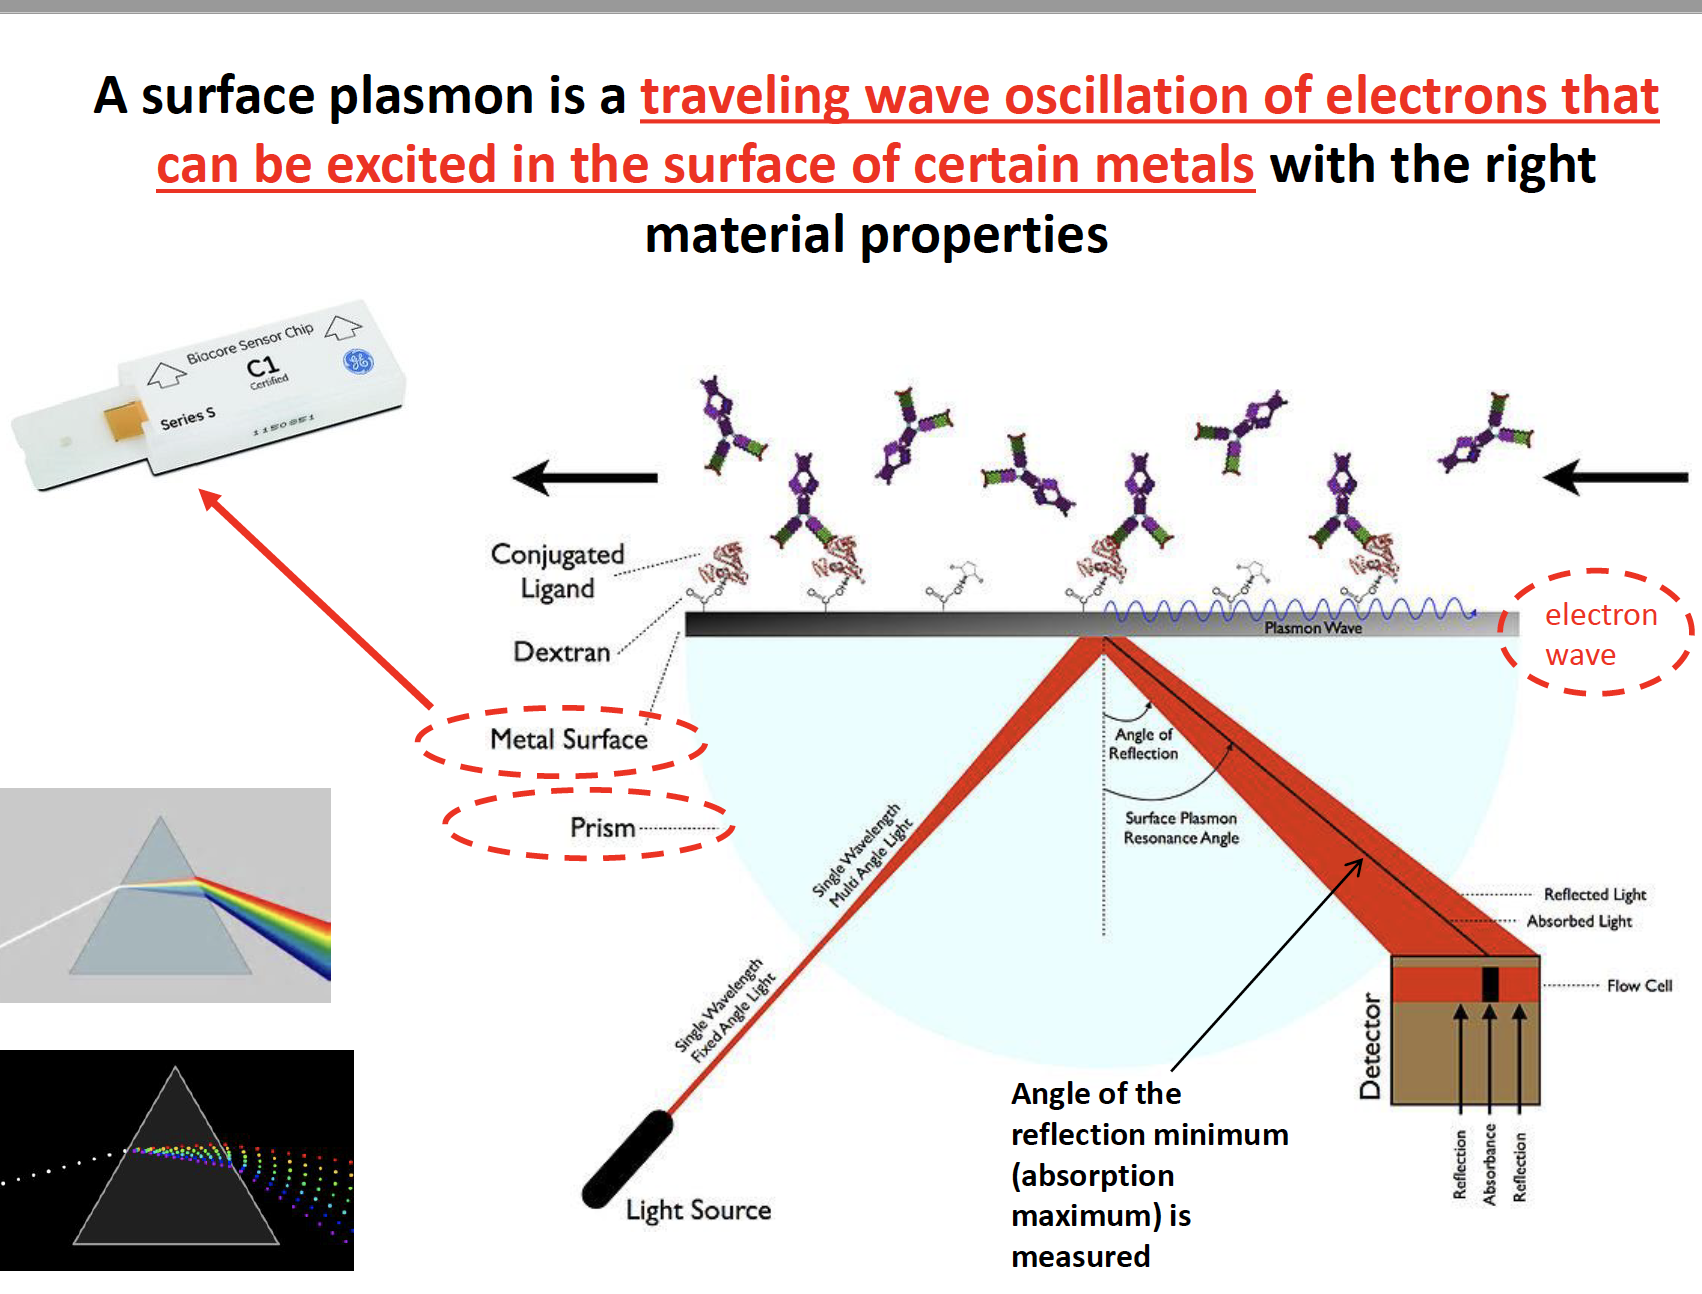
Surface Plasmon Resonance
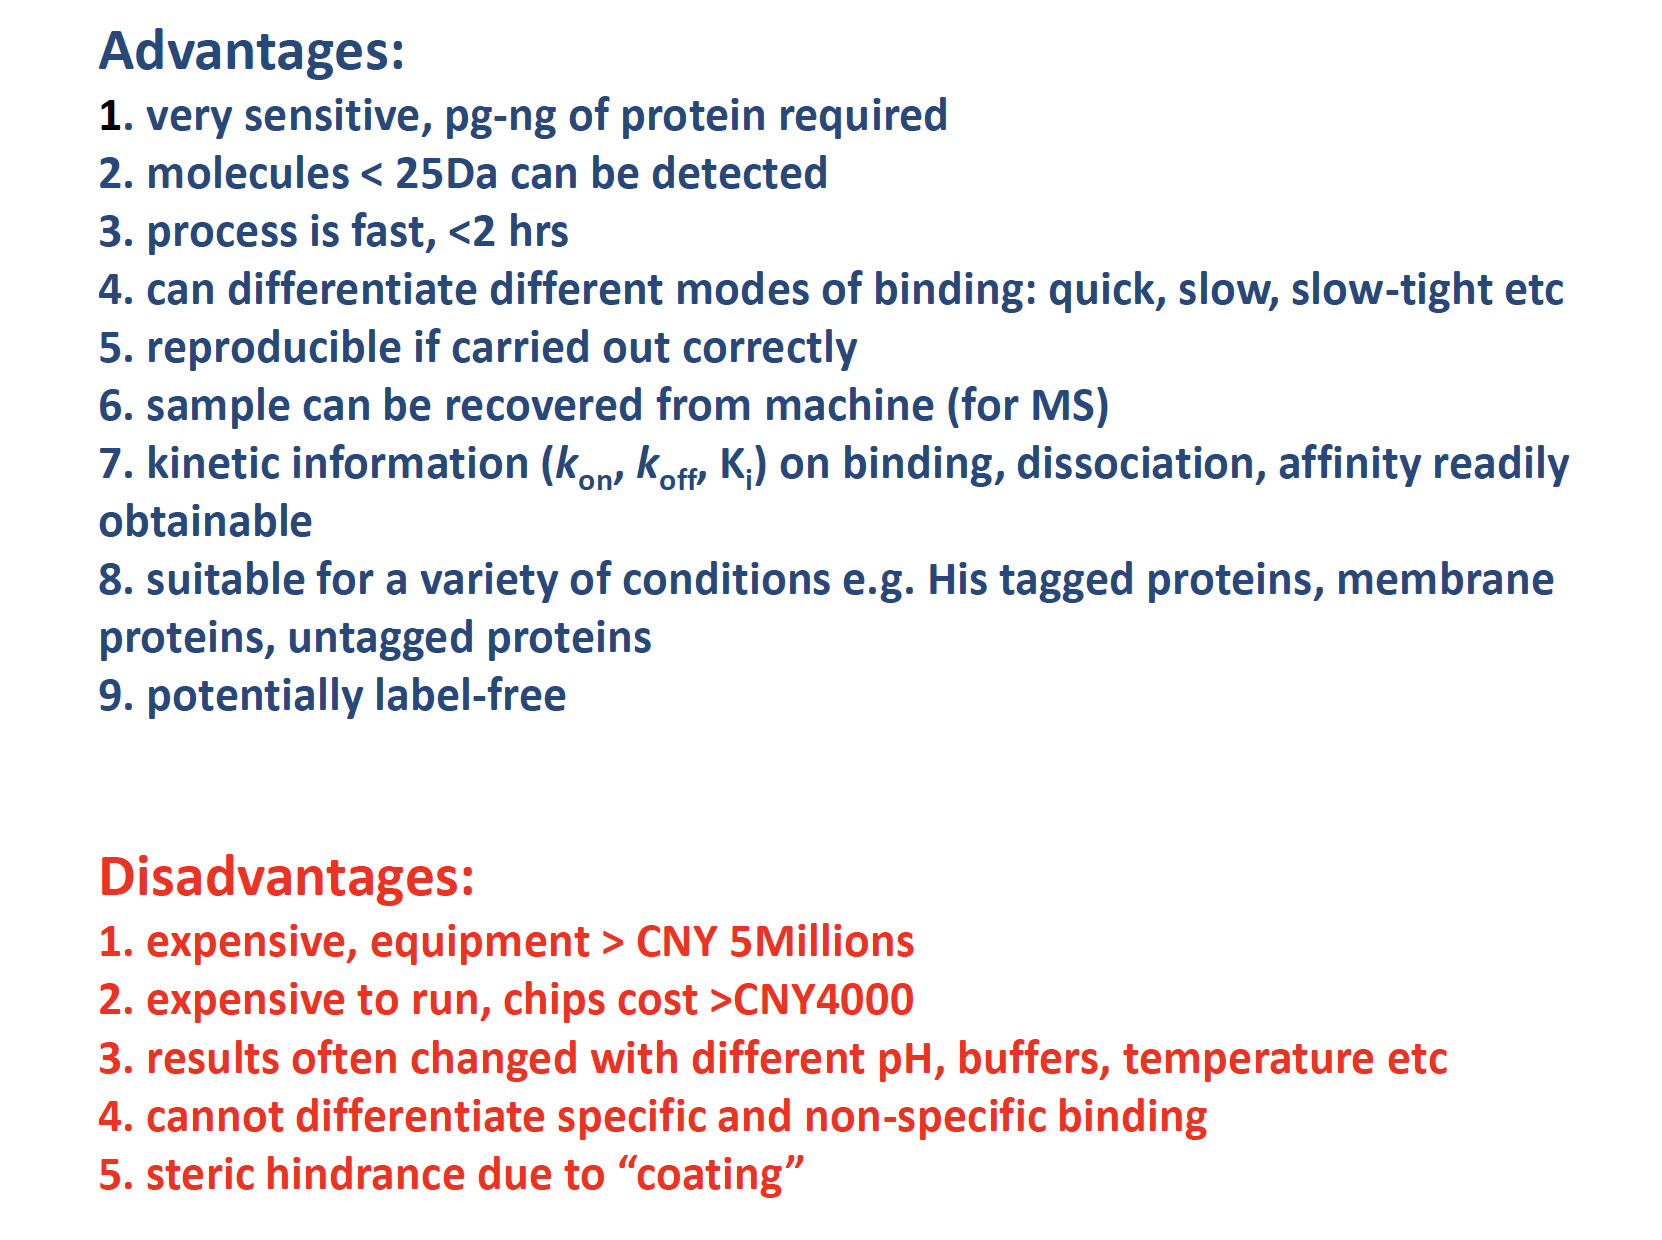
pros & cons
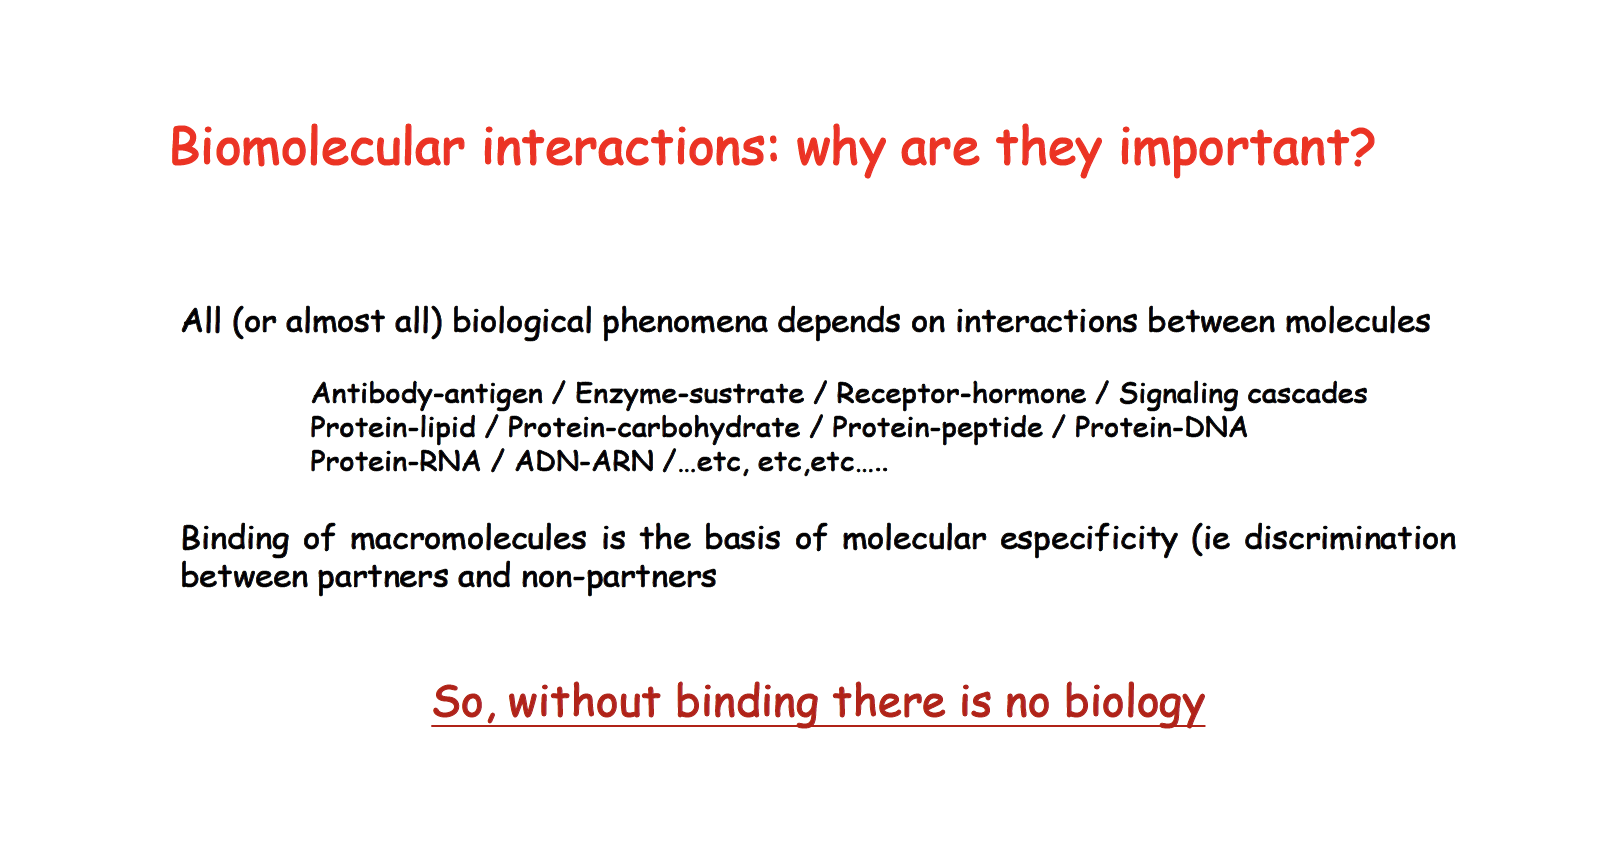
Binding affinity
Binding affinity is the strength of the binding interaction between a single biomolecule (e.g. protein or DNA) to its ligand/binding partner (e.g. drug or inhibitor). Binding affinity is typically measured and reported by the equilibrium dissociation constant (KD), which is used to evaluate and rank order strengths of bimolecular interactions. The smaller the KD value, the greater the binding affinity of the ligand for its target. The larger the KD value, the more weakly the target molecule and ligand are attracted to and bind to one another.
Binding affinity is influenced by non-covalent intermolecular interactions such as hydrogen bonding, electrostatic interactions, hydrophobic and Van der Waals forces between the two molecules. In addition, binding affinity between a ligand and its target molecule may be affected by the presence of other molecules.
Tutorial
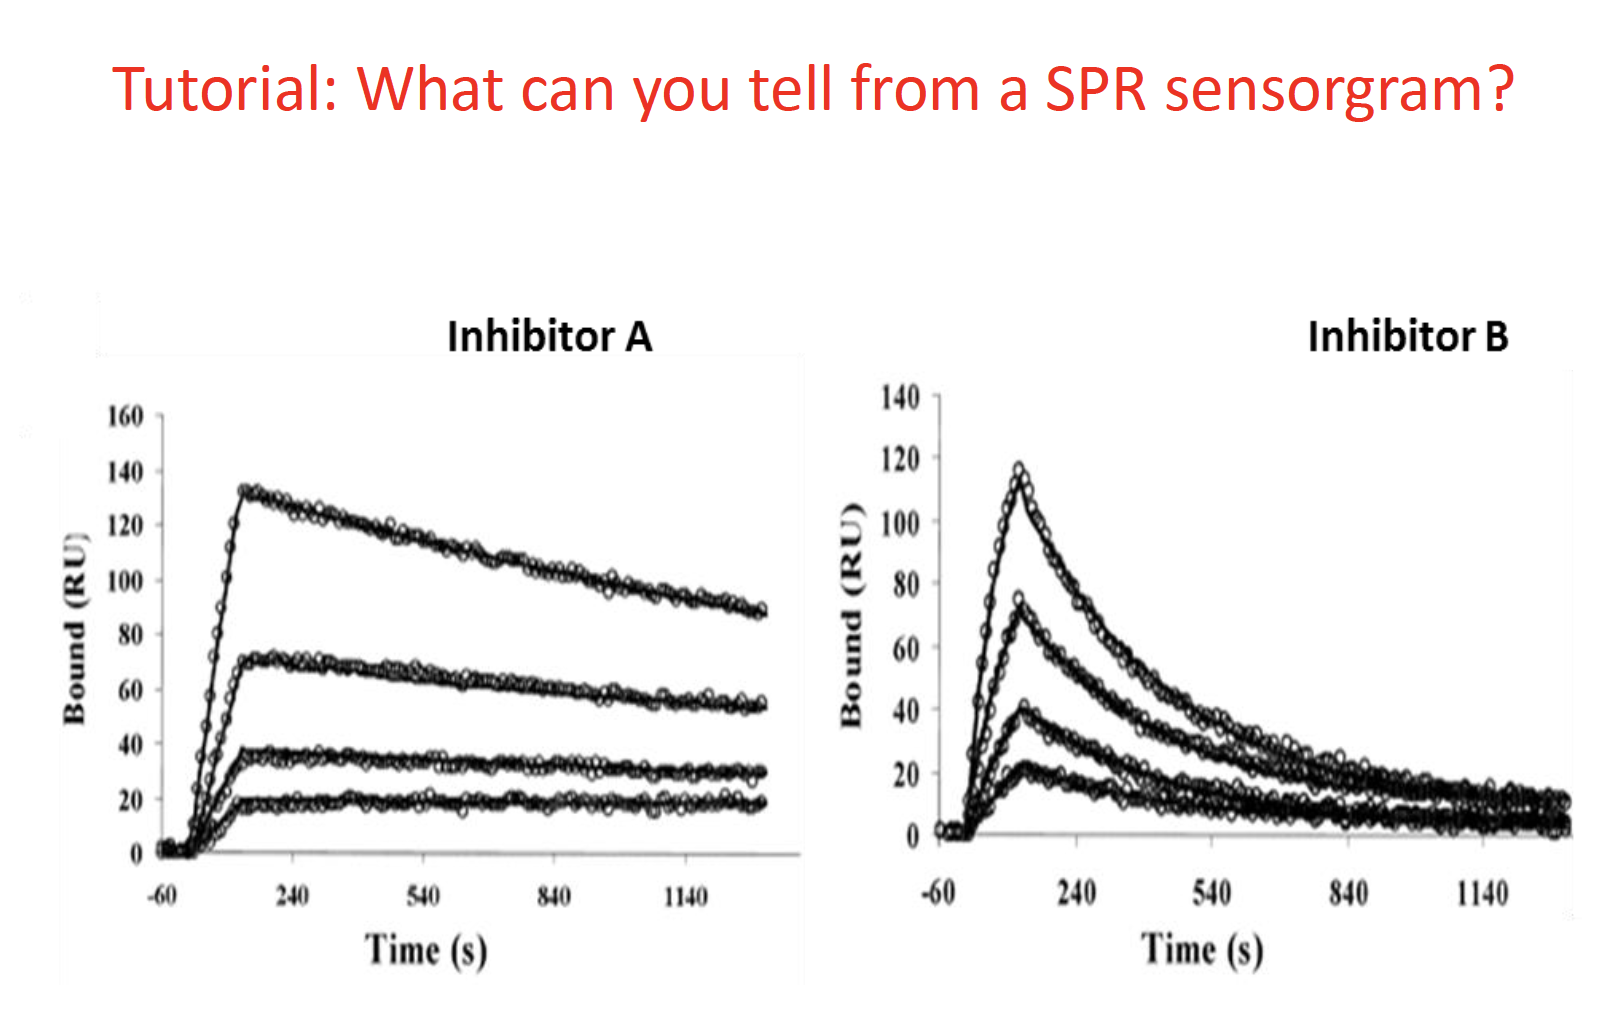
Inhibitaor A has a low ki value
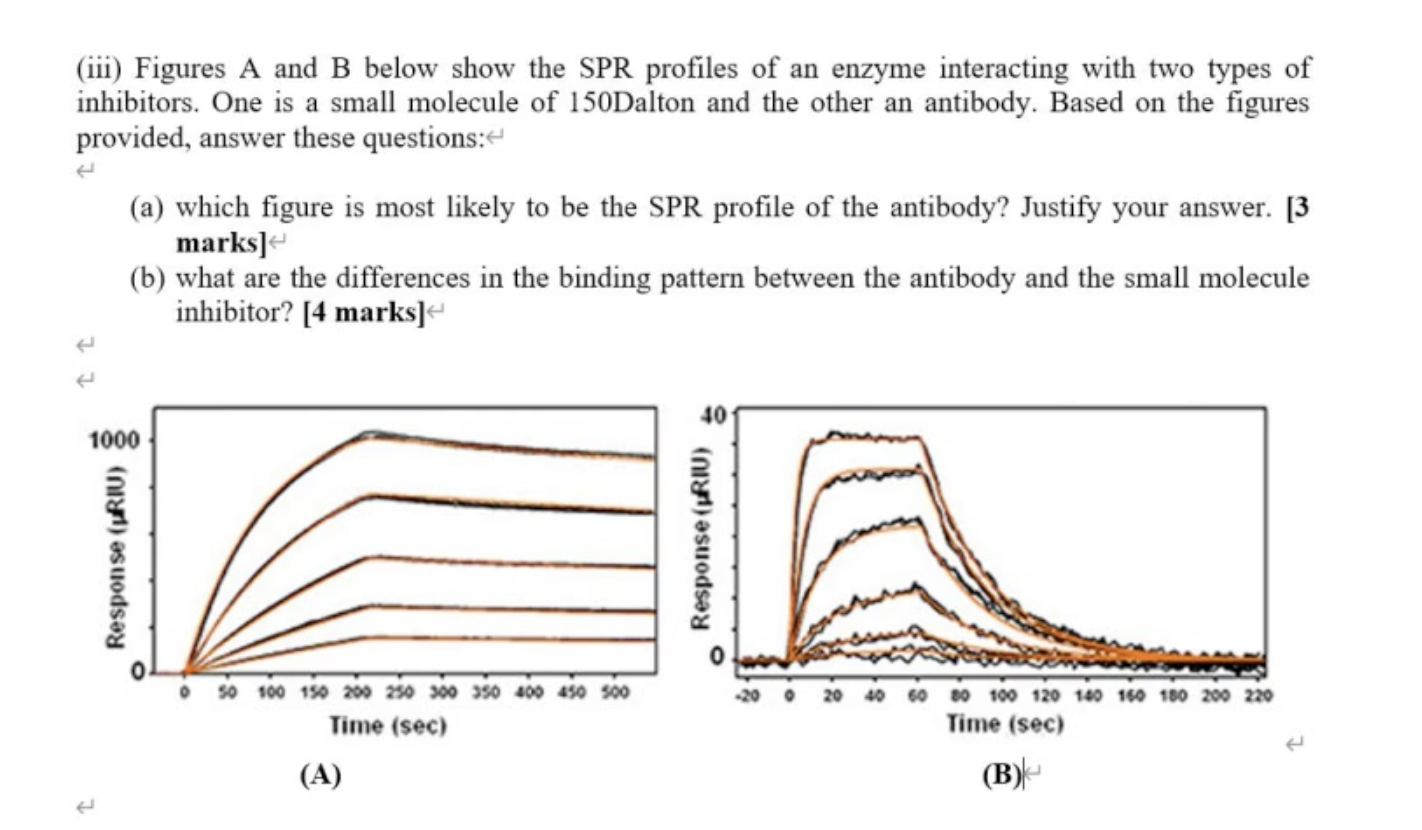
Question (a)
The bigger the molecule binding to the chip, the higher the shift of response you will see in the signal.
A: 1000 response unit – antibody
B: small molecular inhibitor
Question (b)
For antibody, it takes a long time (configuration and takes to time to stable for binding)
For small molecular, immediately (can go straight to the molecule site, when you wash it, everything come out, nothing changed in the conformation of the size)
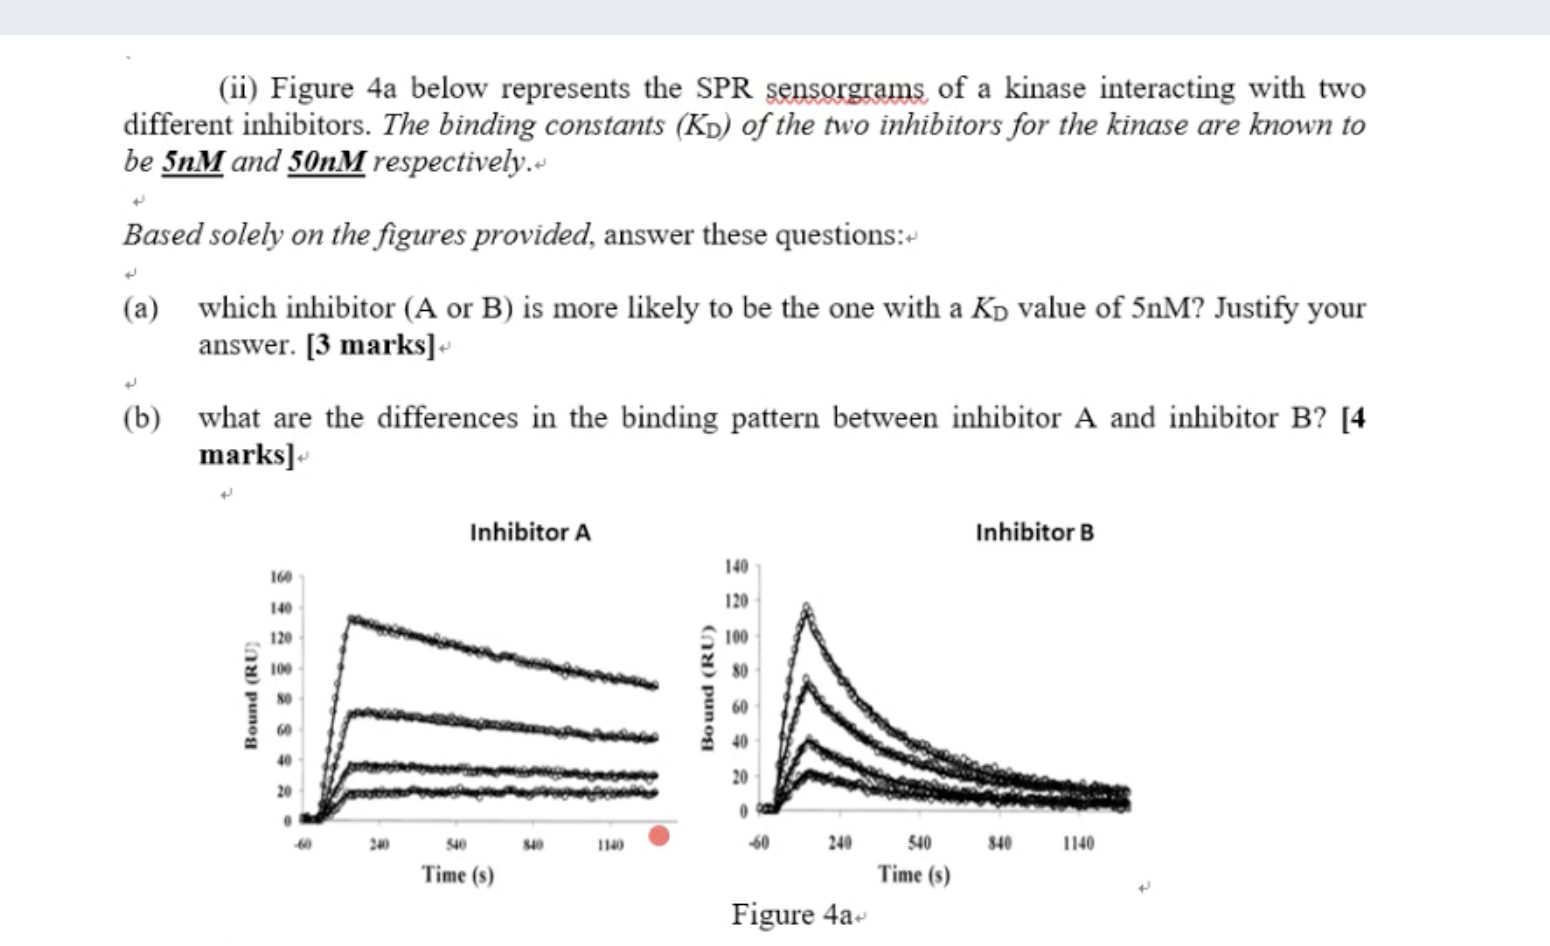
a) lower kD value means higher affinity
Which one is better in drug design ?
A long type binding, bind very tightly and let drug stay in the body for a long time. Avoid take pill regularly (short term problem)
But based on the profile of the drug design, you have take care of the drug significantly
The answer should be Ms
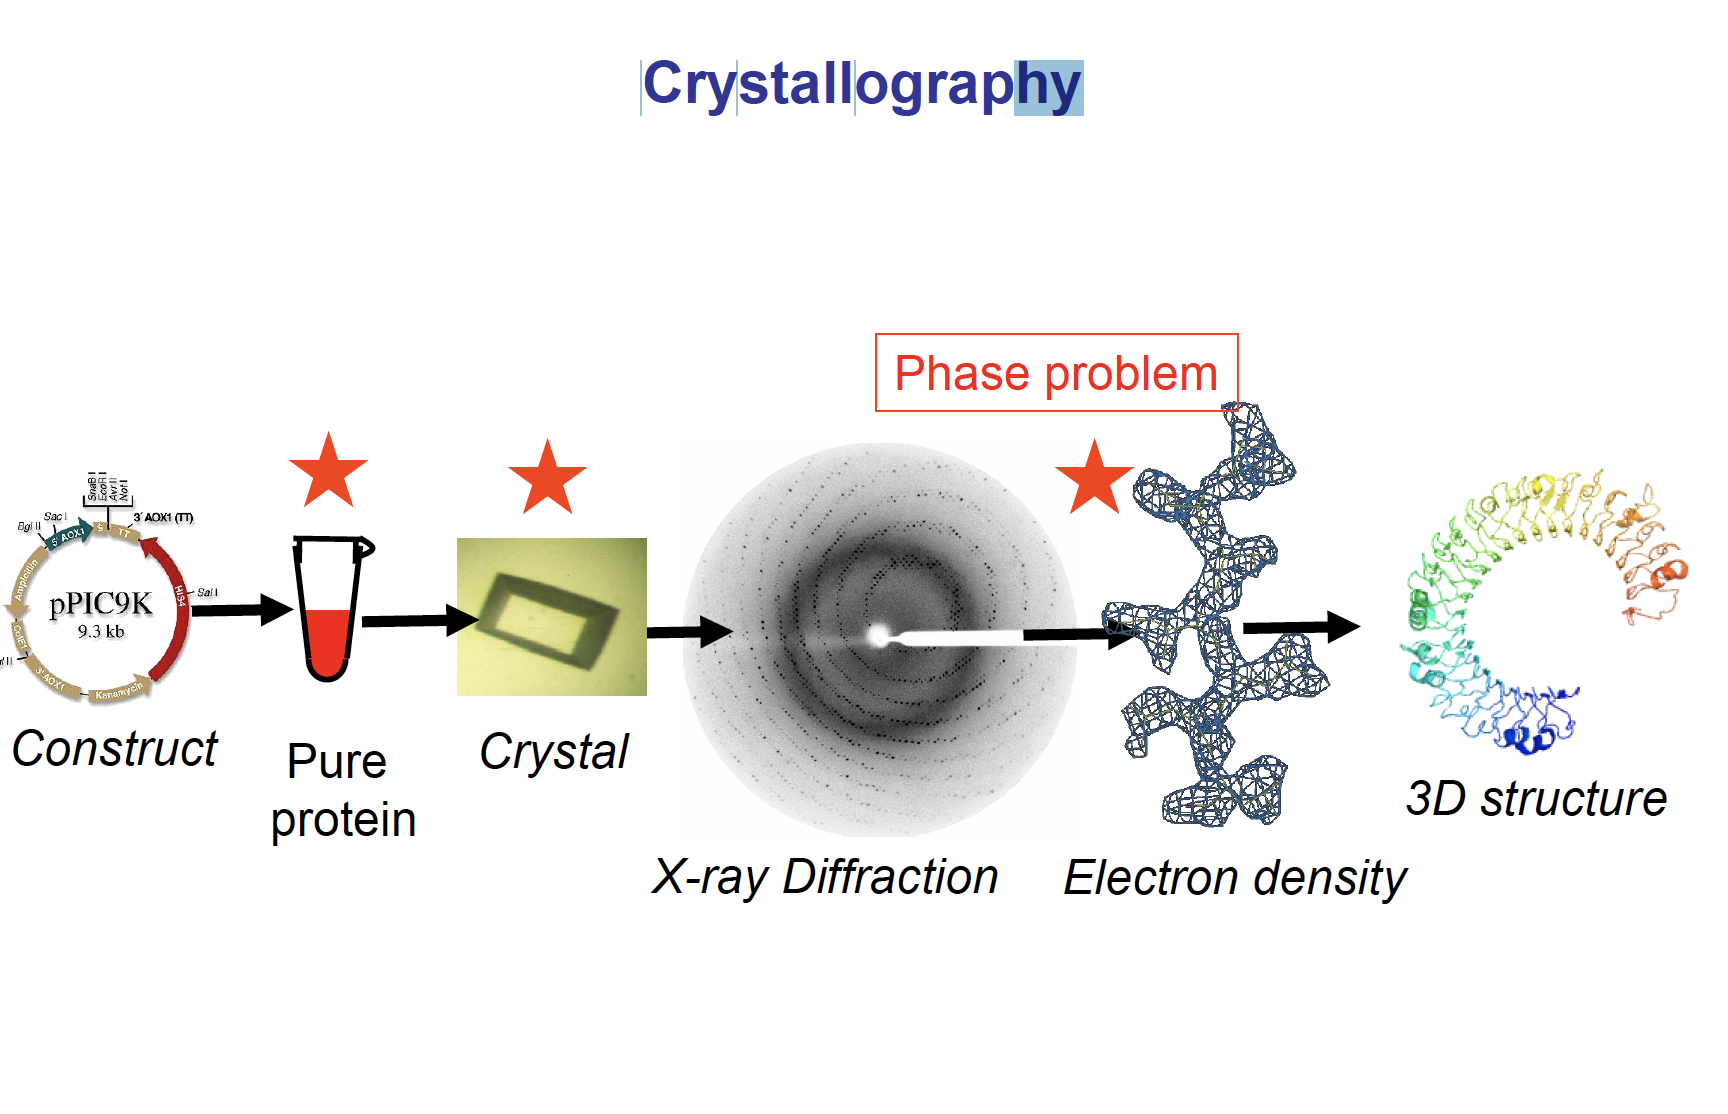
Lecture 12 Crystallography
Whole process
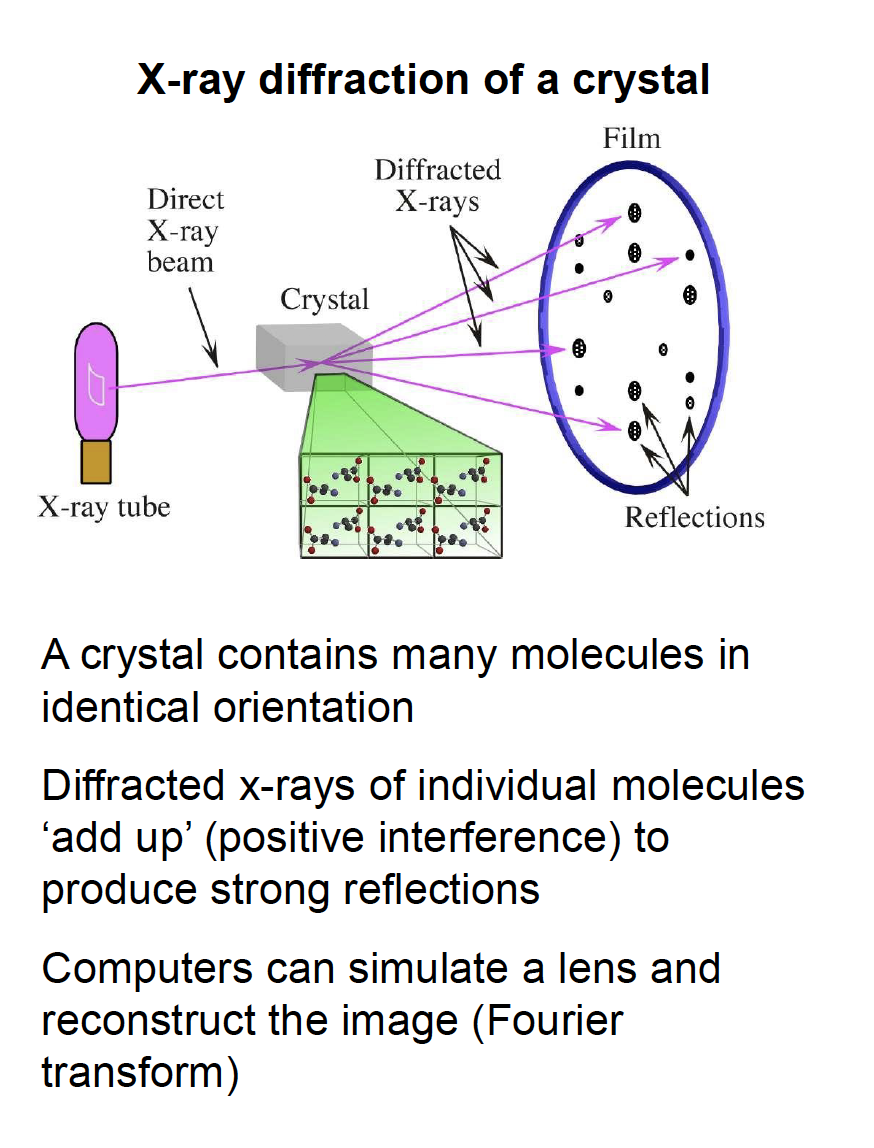
X-ray diffraction of a crystal
Raw data
Every atom in a unit cell contributes to every reflection in the diffraction pattern.
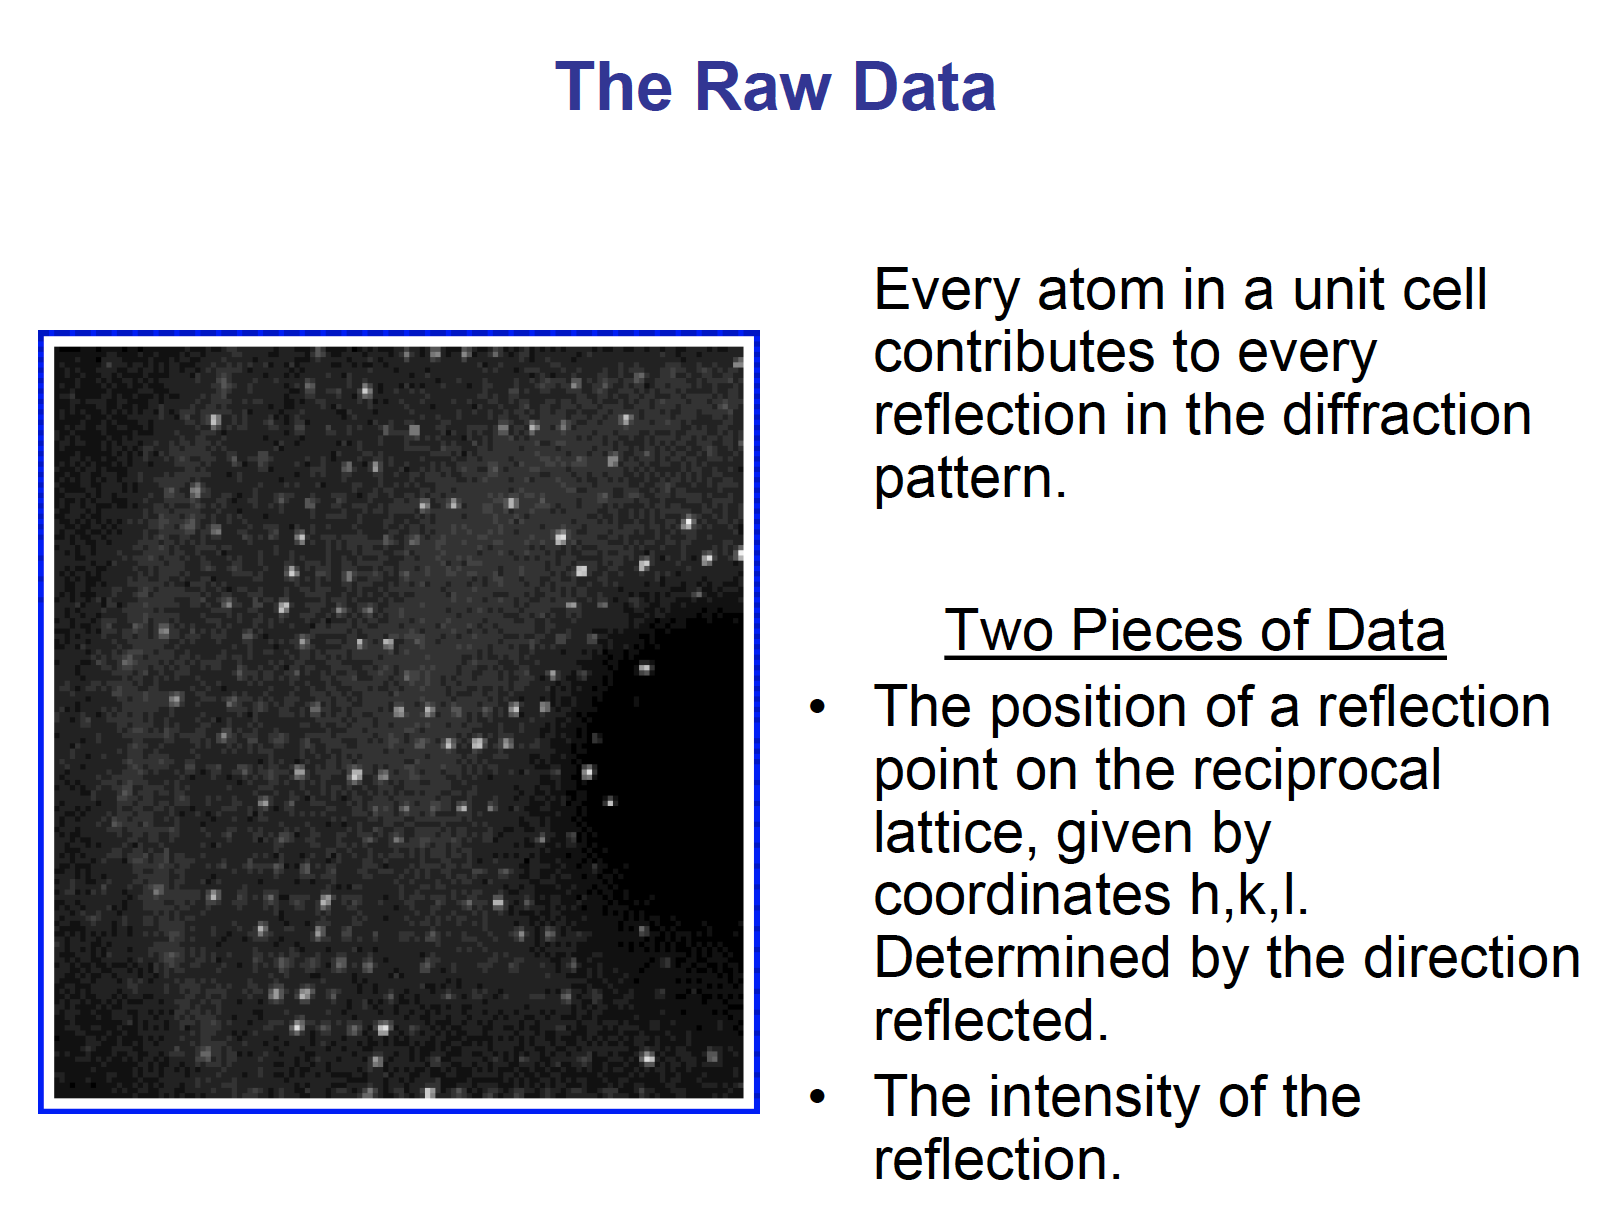
Each diffraction spot (reflection) contains information on the position of every atom!
The degree of order in the crystal determines the quality of the diffraction data and ultimately the quality of the final atomic model
“low resolution”
“high resolution”
From diffraction to electron density map
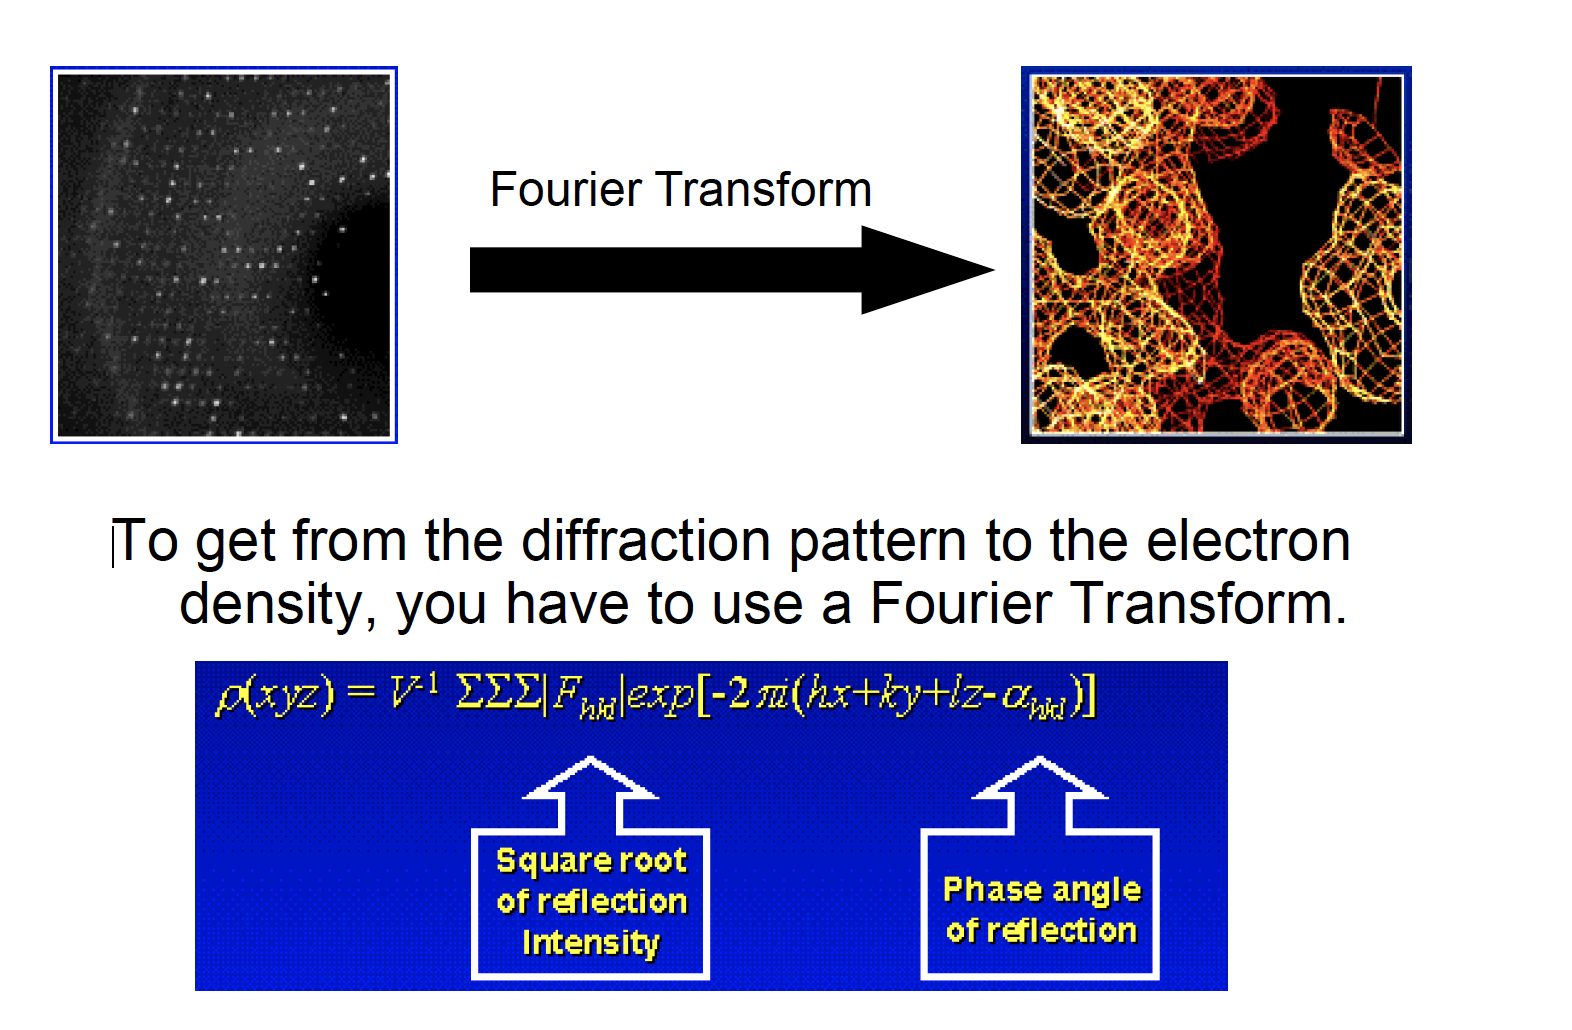
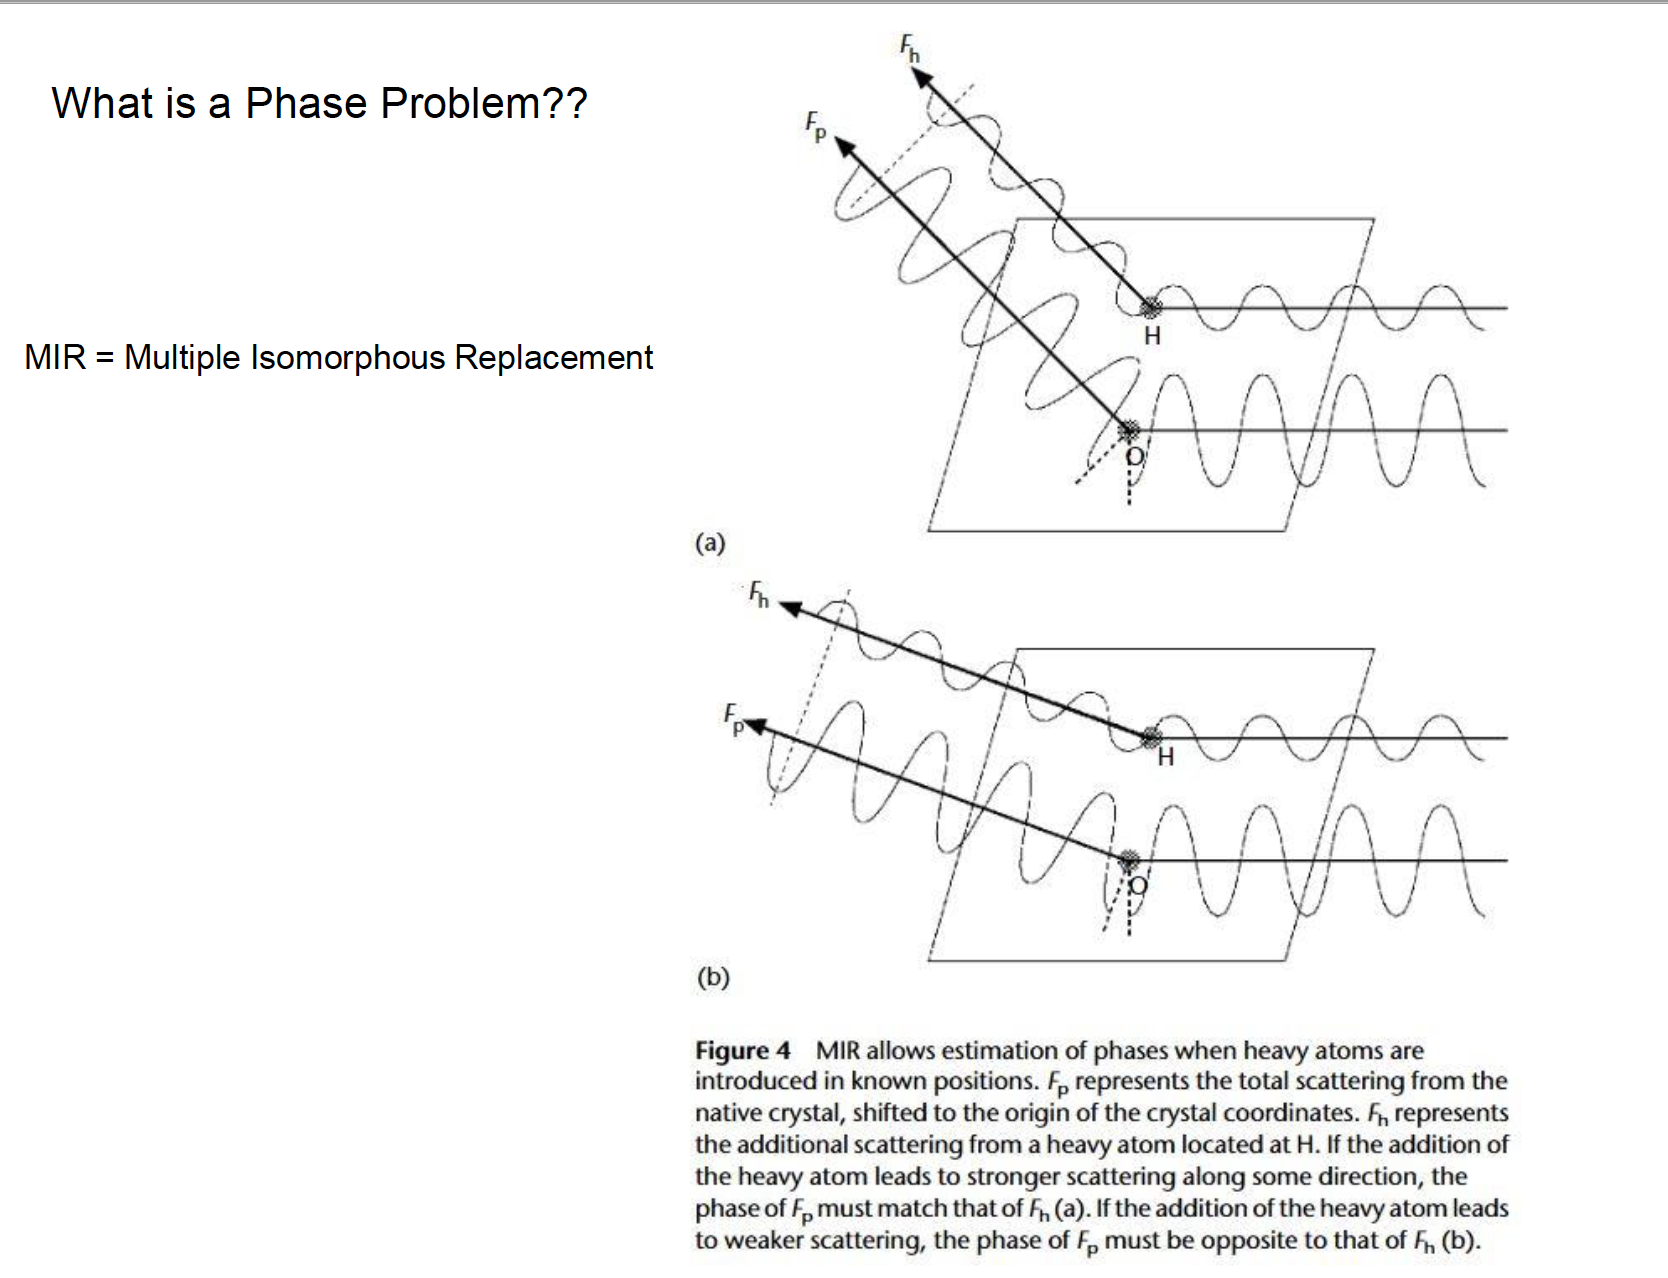
Solving the phase problem
- The diffraction data
does not give the phase anglethat is needed to calculate the electron density map. - Have to
get the phase angle through other methods.- Isomorphous Replacement:
Insert a heavy metal atom into crystal protein, andlocate in diffraction patternand in the cell. Use the location of metal ion to find the phase angle for the other protein atoms.
- Isomorphous Replacement:
- Requirements:
- Add atom with same unit cell size.
- Cannot disturb protein structure.
Phase problem
Resolution
Resolution:
another measure of how good your model is.
- Resolution gives the size of the smallest molecule you can see or resolve.
- Dependent on the amount of data ultimately phased and used in structure determination.
Limitations of the phase problem
Crystallizing Protein:
- Fragile
- Requires a crystal with shortest side 0.2 mm
Flaws of Crystallization:
- Disorder in Unit Cell
- Vibrations of molecules
- Distortion in Crystallization
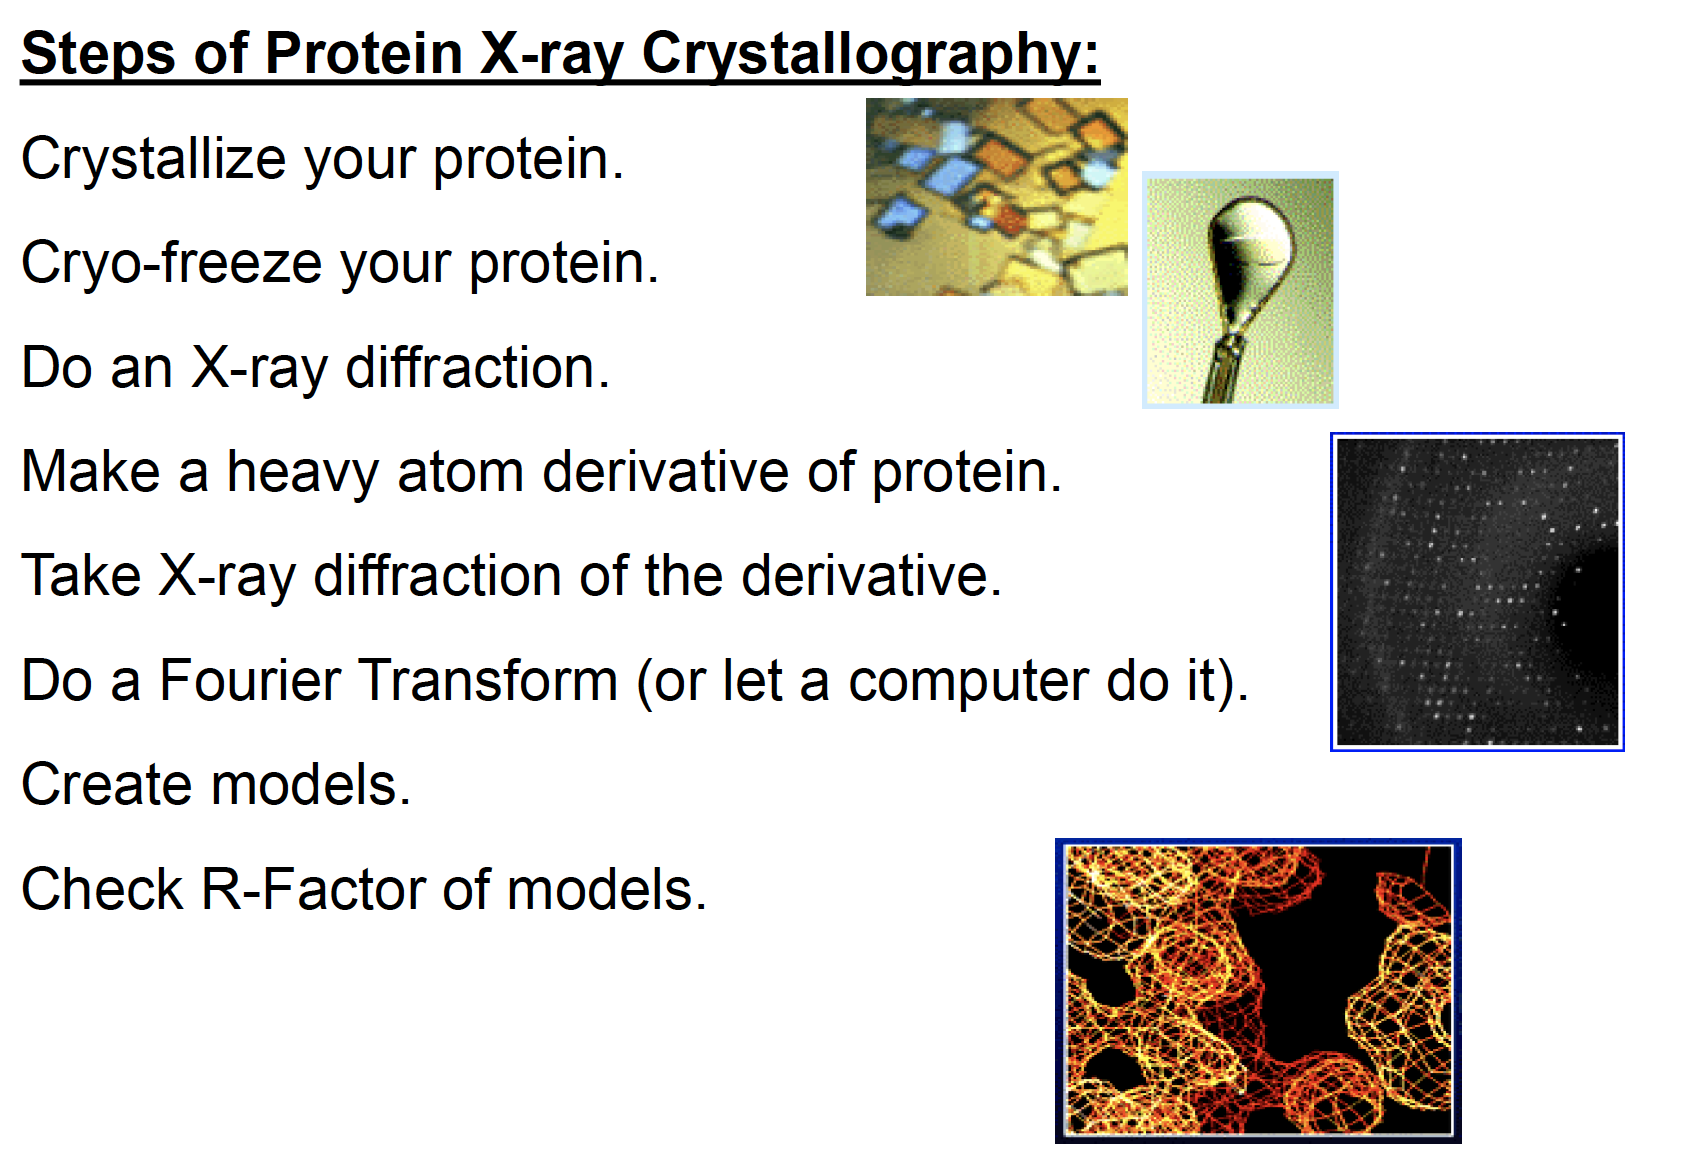
Steps of protein X-ray crystallography
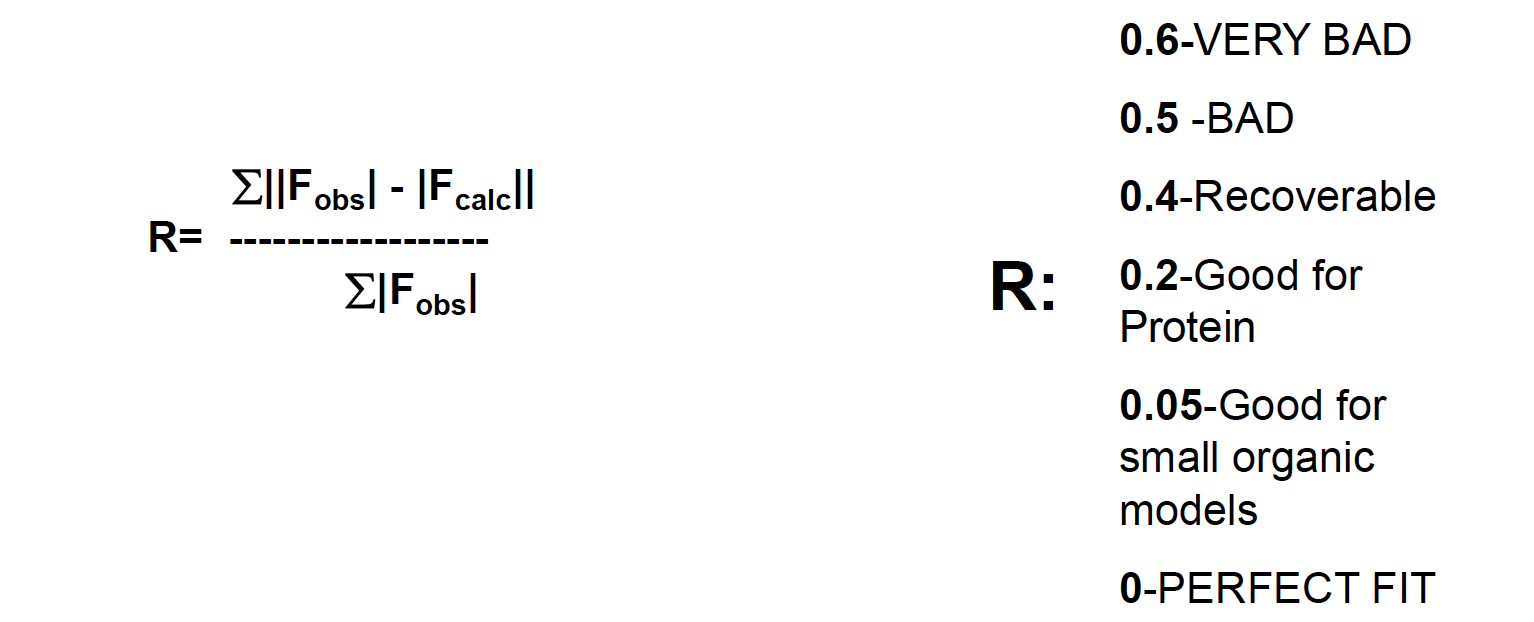
R-factor: measuring convergence
To compare the generated electron density map and your model, you have to use the R-factor (Reliability Factor)
Measurement of the agreement between the crystallographic model and the experimental X-ray diffraction ie. how well the refined structure predicts the observed data
Occupancy
The occupancy “nj” of atom “j”:
a measurement of the fraction of molecules in the crystal in which atom j actually occupies the position specified in the model.
If all molecules in the crystal are precisely identical, then occupancies for all atoms are 1.00.
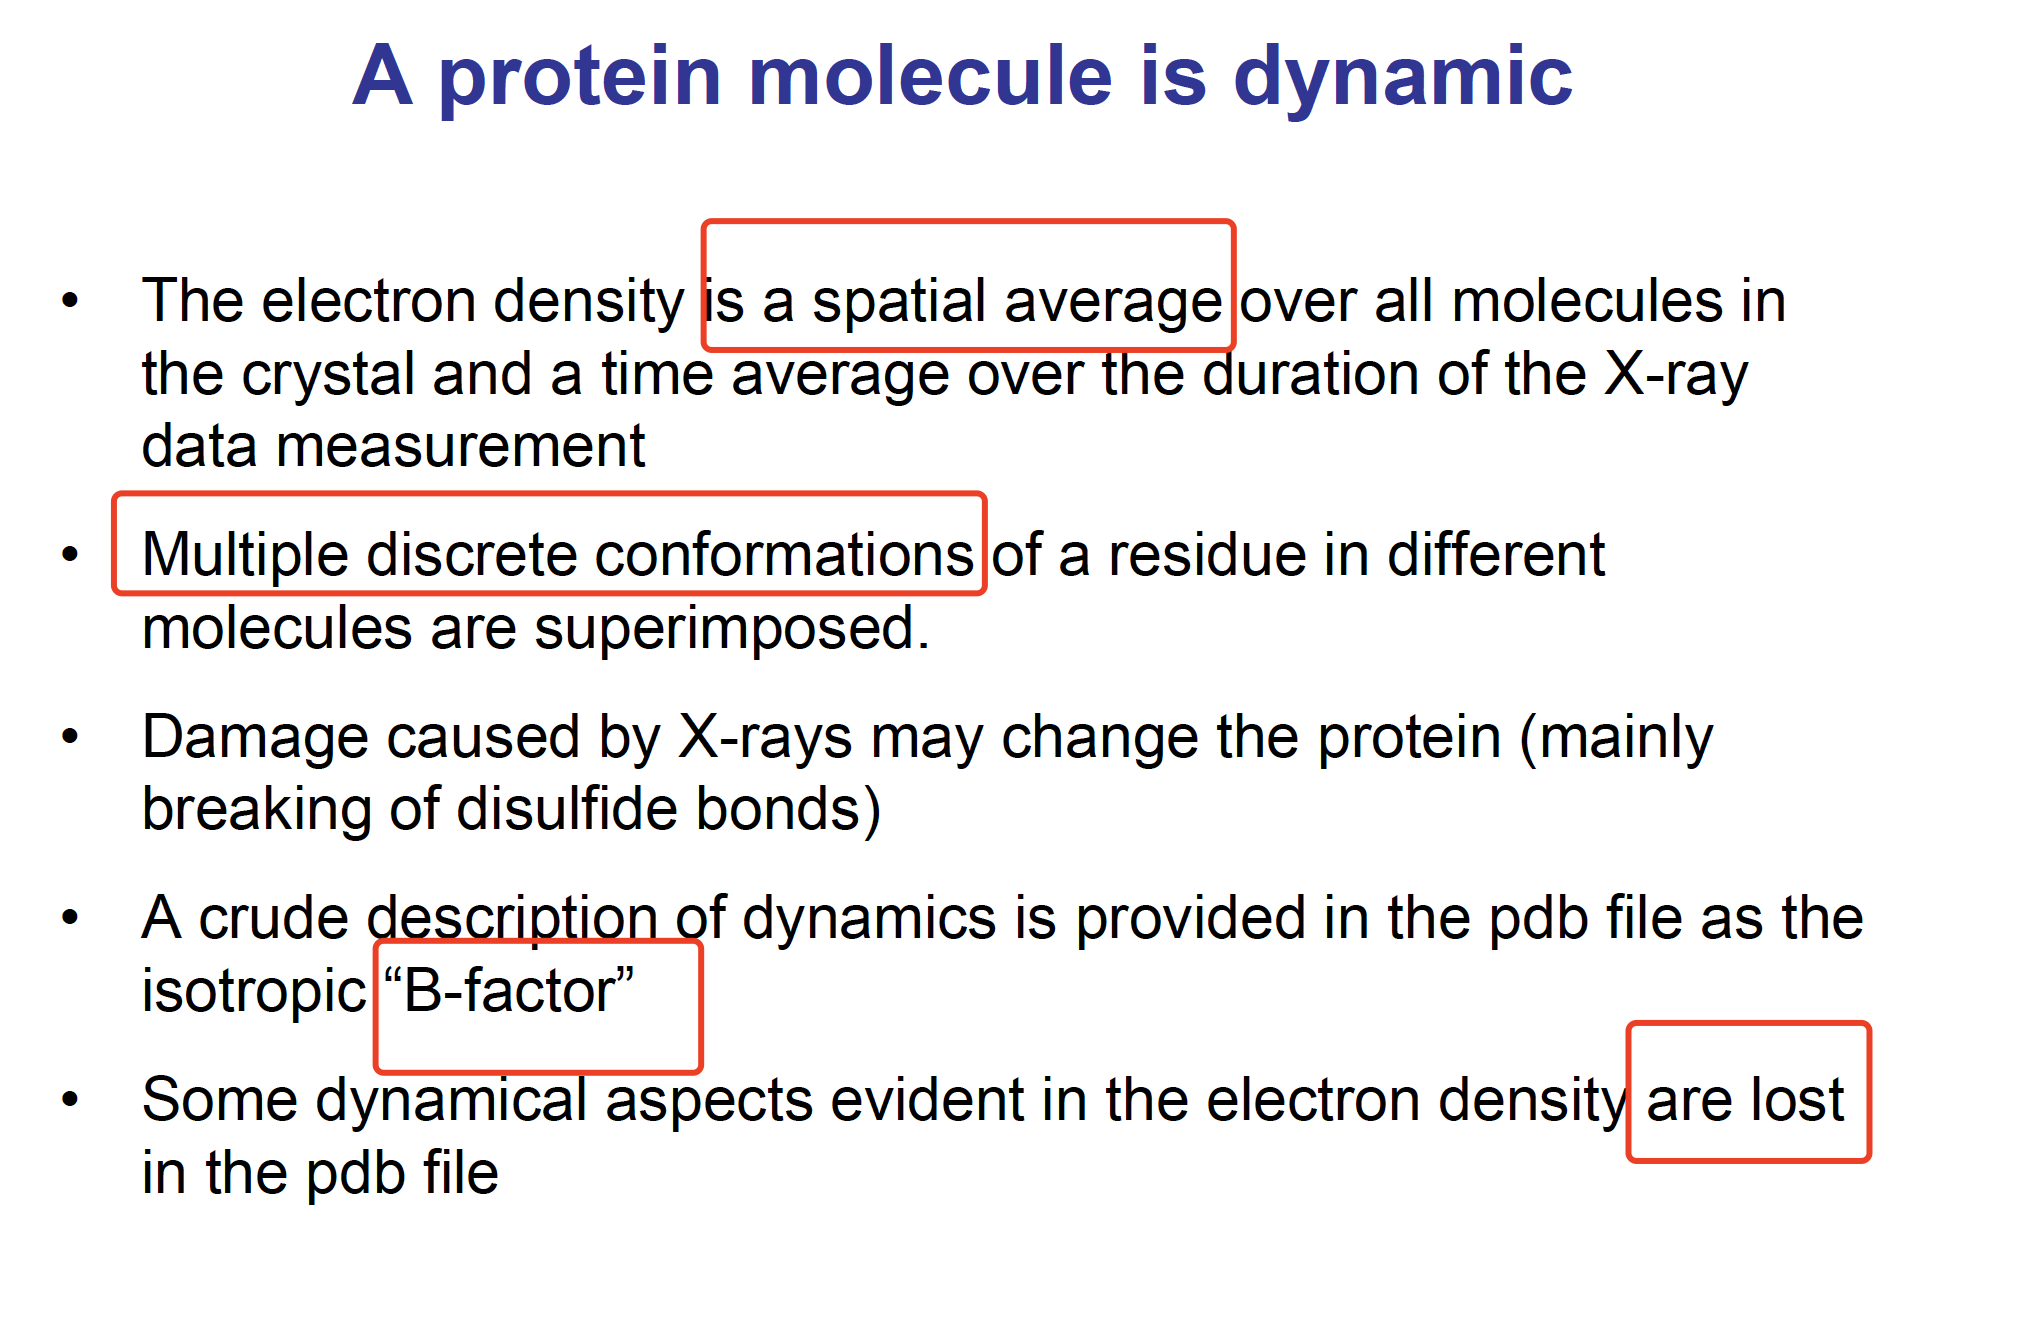
Occupancy is necessary because occasionally two or more distinct conformations are observed for a small region like a surface side chain. For example, if the two conformations occur with equal frequency, then atoms involved receive occupancies of 0.5 in each of their two possible positions.
So, “occupancies” is an estimates of the frequency of alternative conformations, giving some additional information about the dynamics of the protein molecule.
Redundancy
Redundancy = (number of measured reflections) / (number of unique reflections).
The calculation gives the average number of independent measurements of each reflection in a crystallographic data set.
Because several independent measurements are done for each reflection.
To improve accuracy in measuring reflection intensities, data collection strategies are intentionally designed to take advantage of symmetry and overlap to give redundancy of measurement.
Such statistical parameters as standard deviation are used to measure agreement among the repeated measurements.
Resolution
Reflect the quality of the image.
In X-ray crystallography, “2-Å model” means that the model takes into account diffraction from sets of equivalent, parallel planes of atoms spaced as closely as 2 Å in the unit cell.
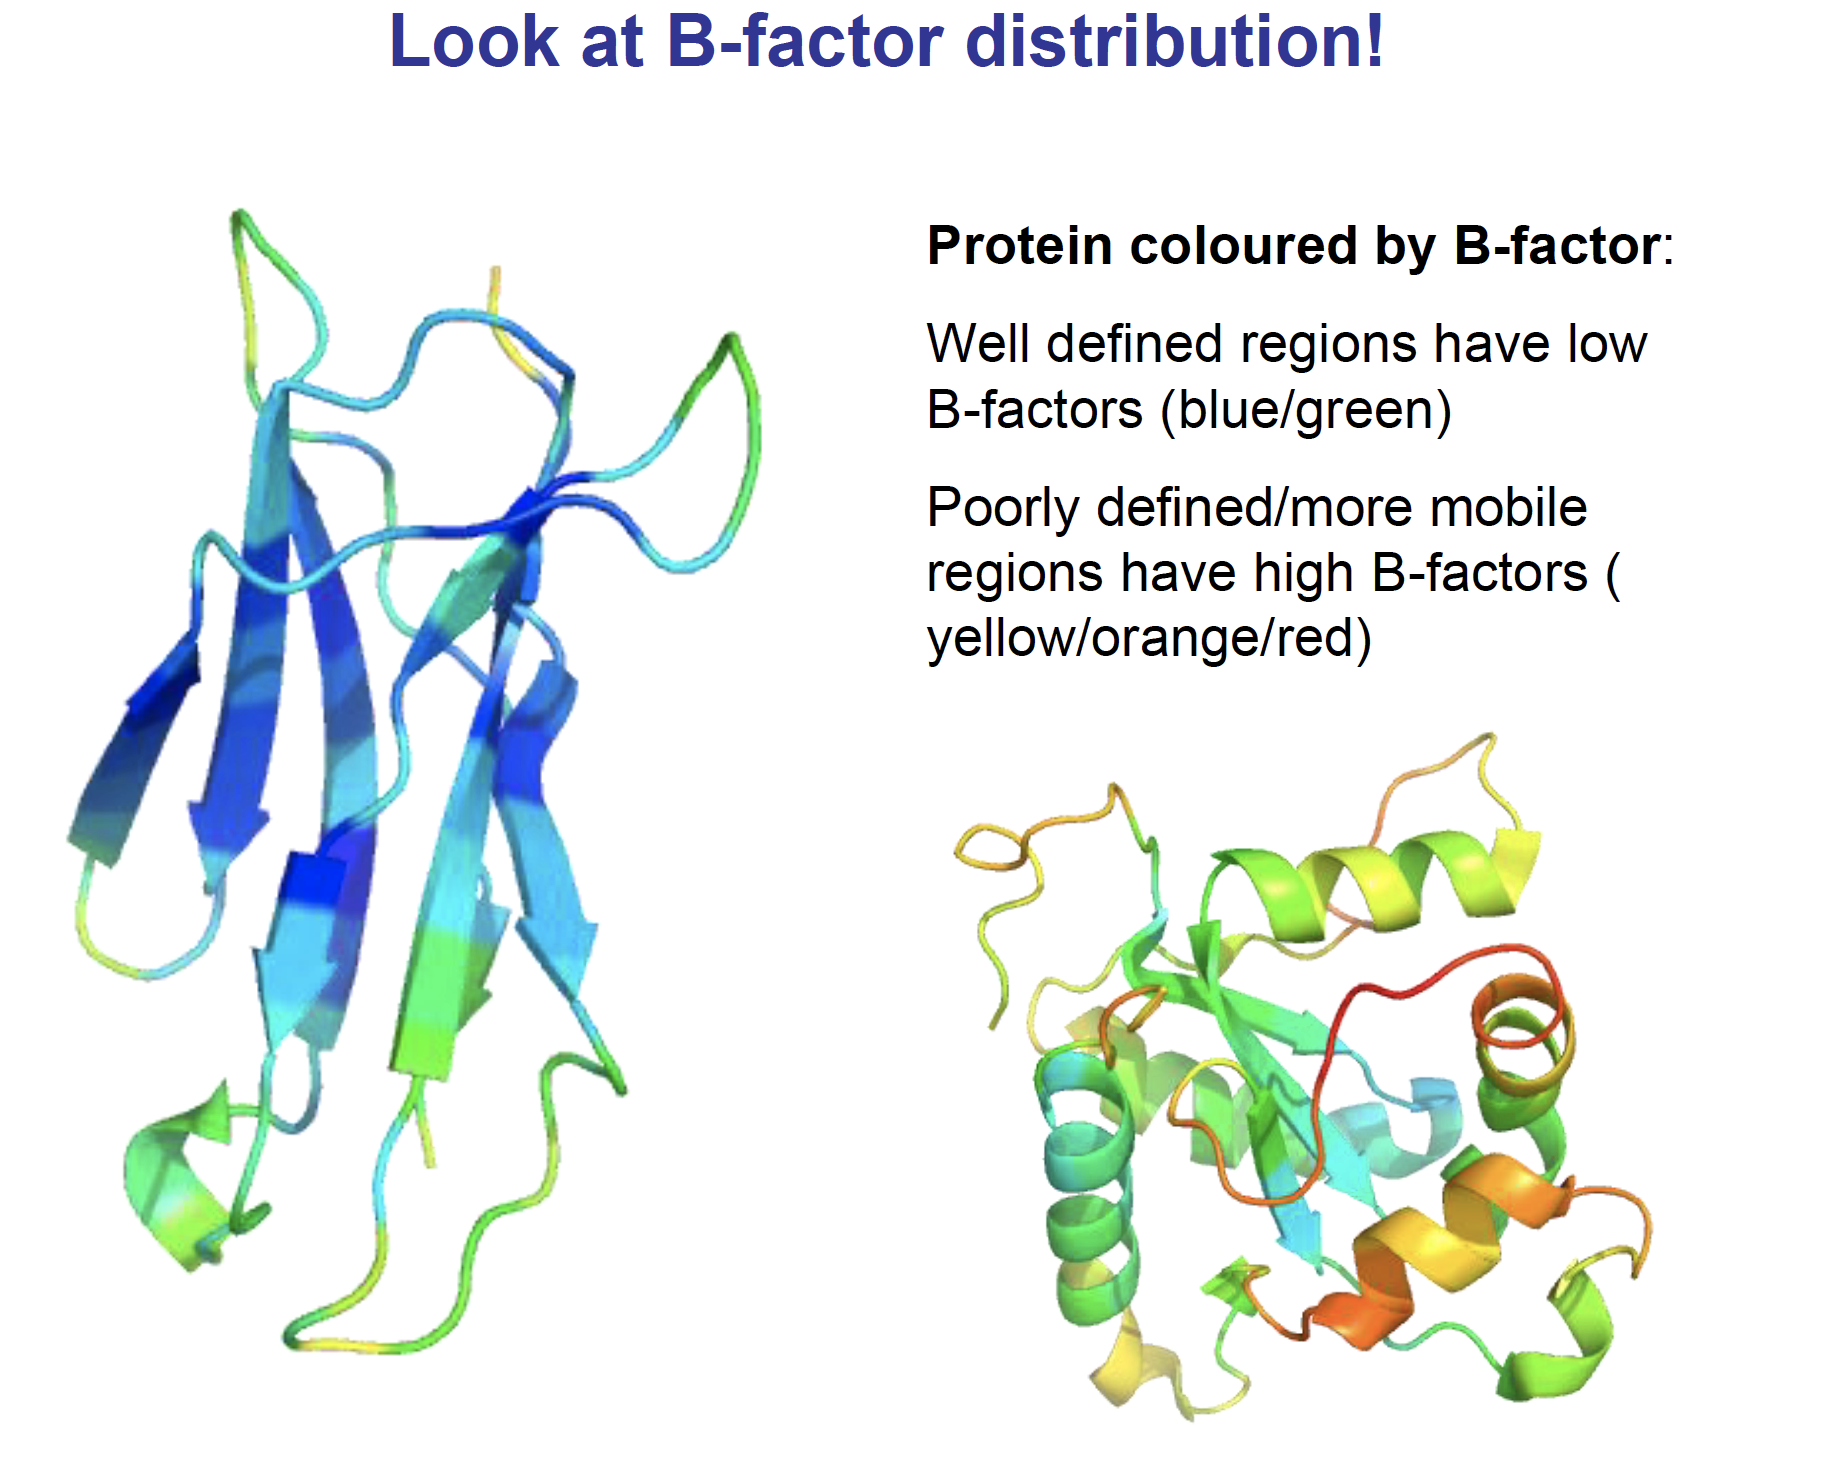
“B-Factor (Temperature factor)”
B-factor can be thought of as a measure of
how much an atom oscillates or vibratesaround the position specified in the model.Atoms at
side-chain terminiare expected toexhibit more freedom of movementthan main-chain atoms, and this movement amounts to spreading each atom over a small region of space.Diffraction is affected by this variation in atomic position.
From the
temperature factorscomputed during refinement, we learn which atoms in the molecule have the most freedom of movement, and we gain some insight into the dynamics of our largely static model.
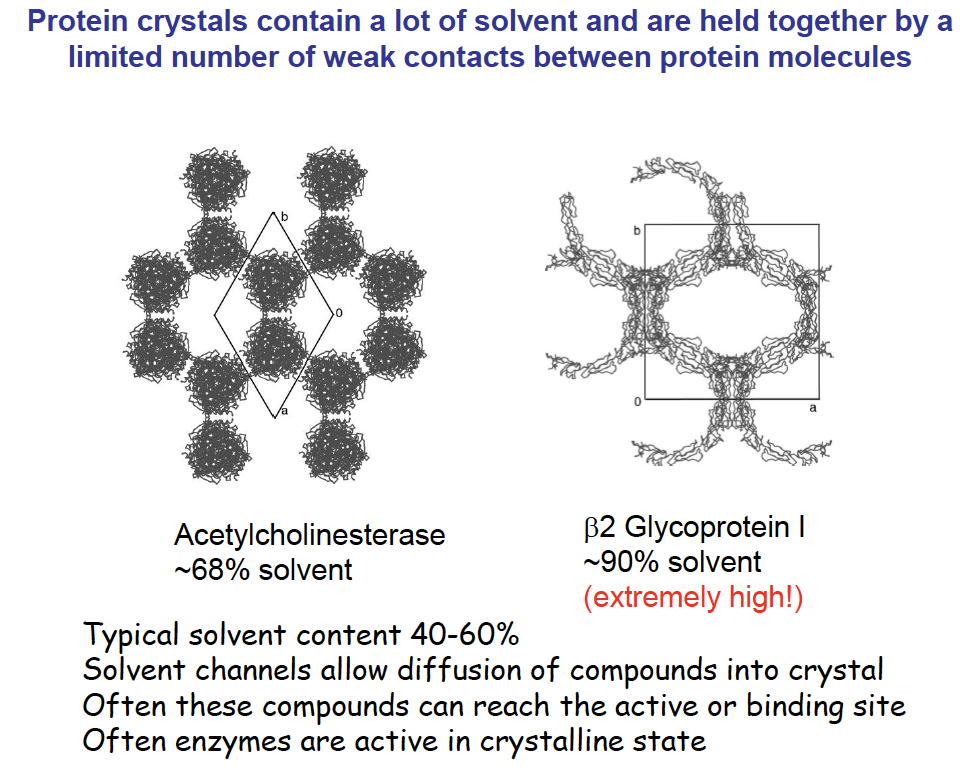
Two types of solvent: ordered and disordered
Ordered watermolecules show up as discrete blobs of electron density in contact with the protein or with other ordered water moleculesDisordered waterregions show up as featureless (flat) electron density
crystals and crystal in crystallographic data
Quiz
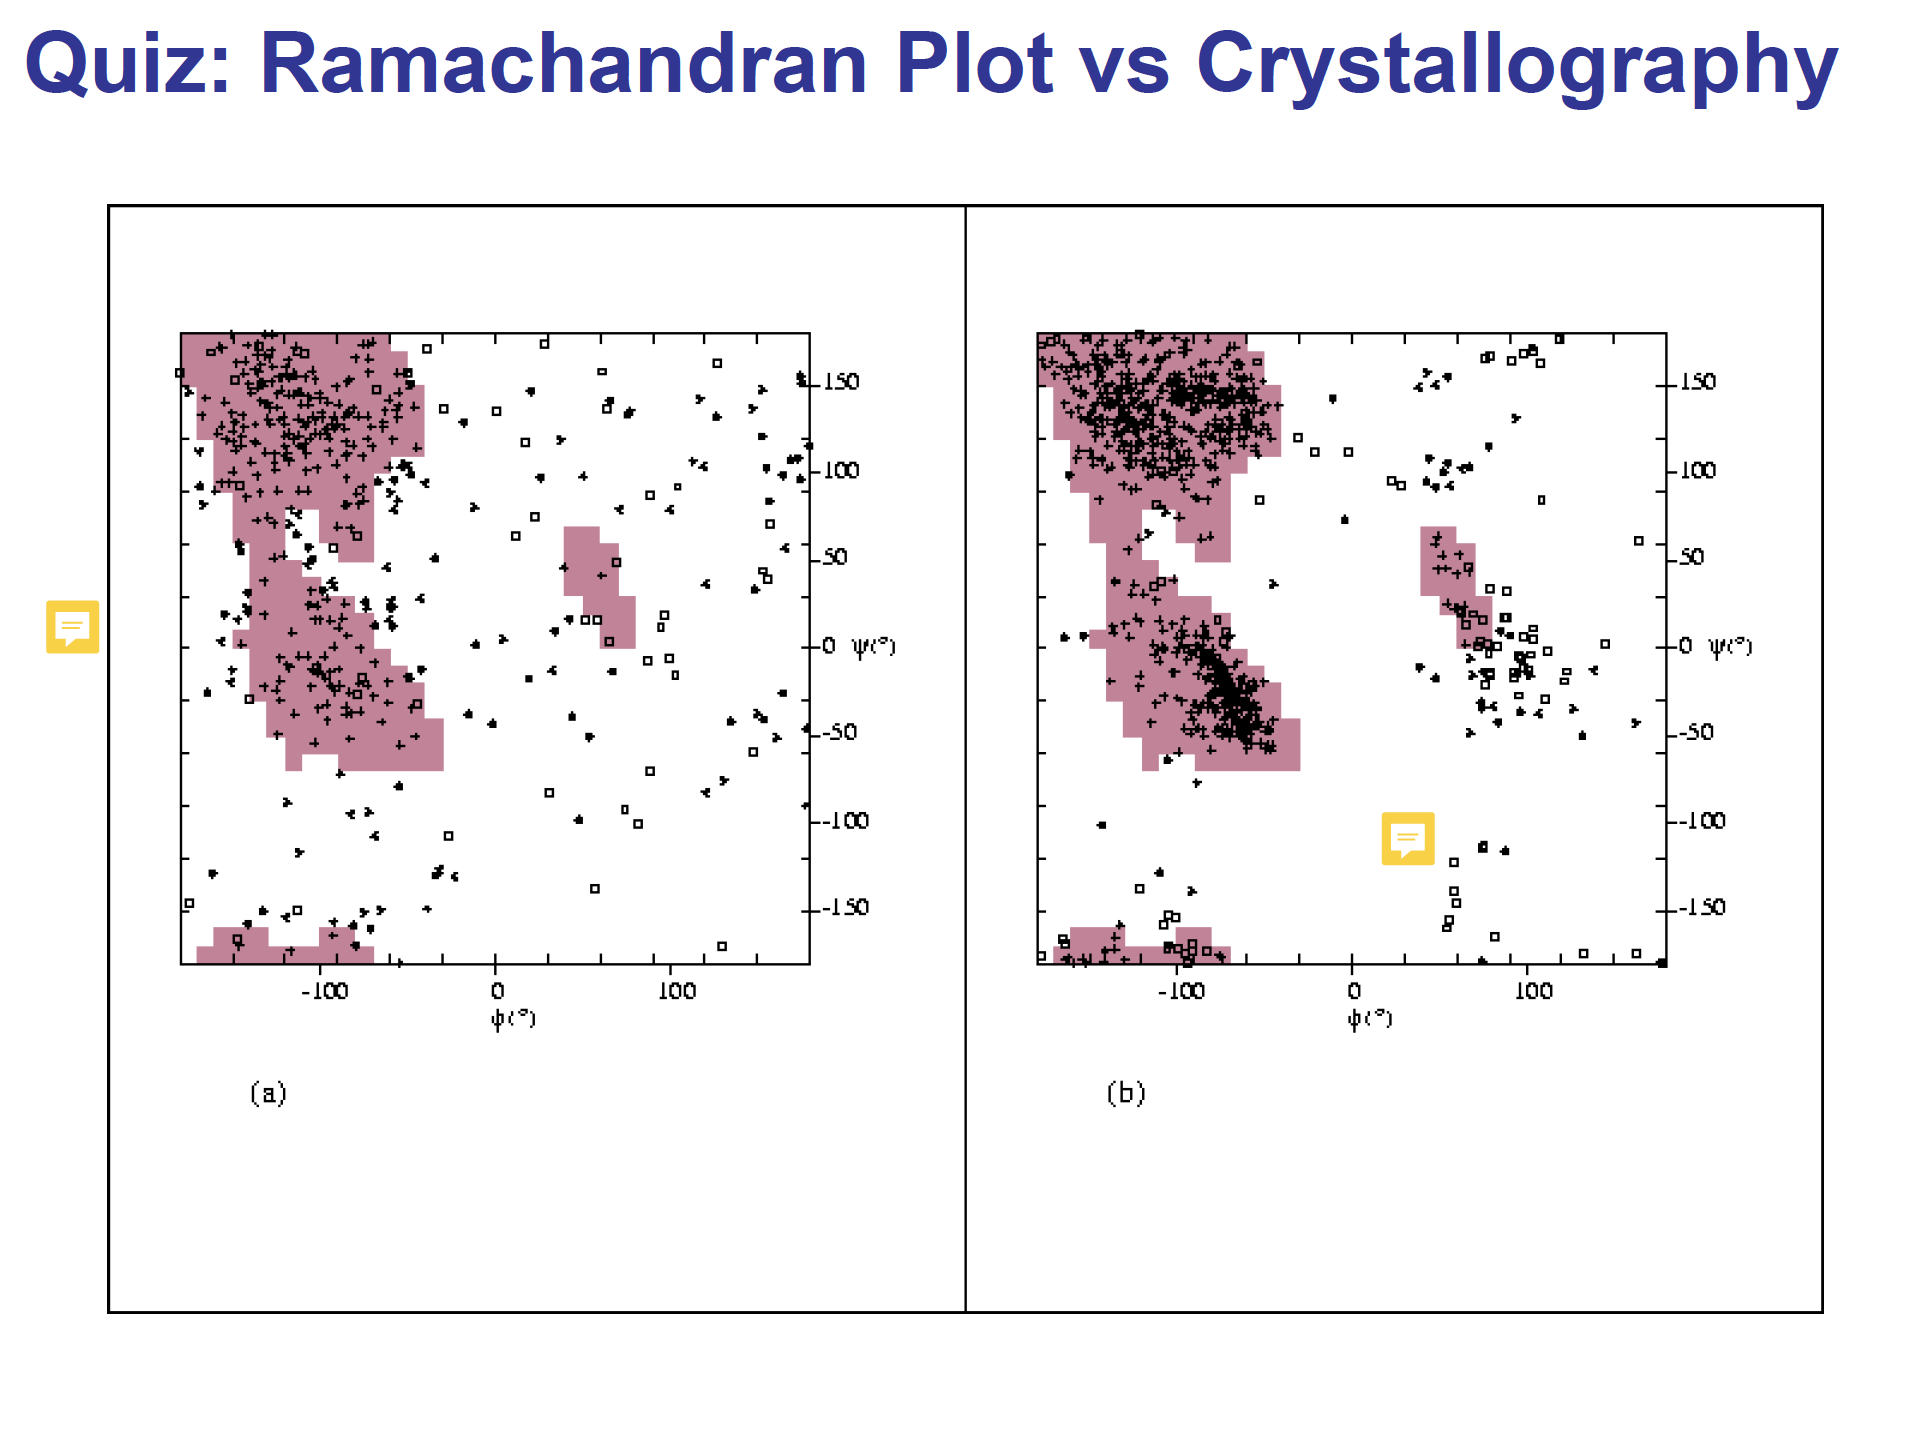
左图:lousy; may precipitate; not comfortable
右图:comfortable protein
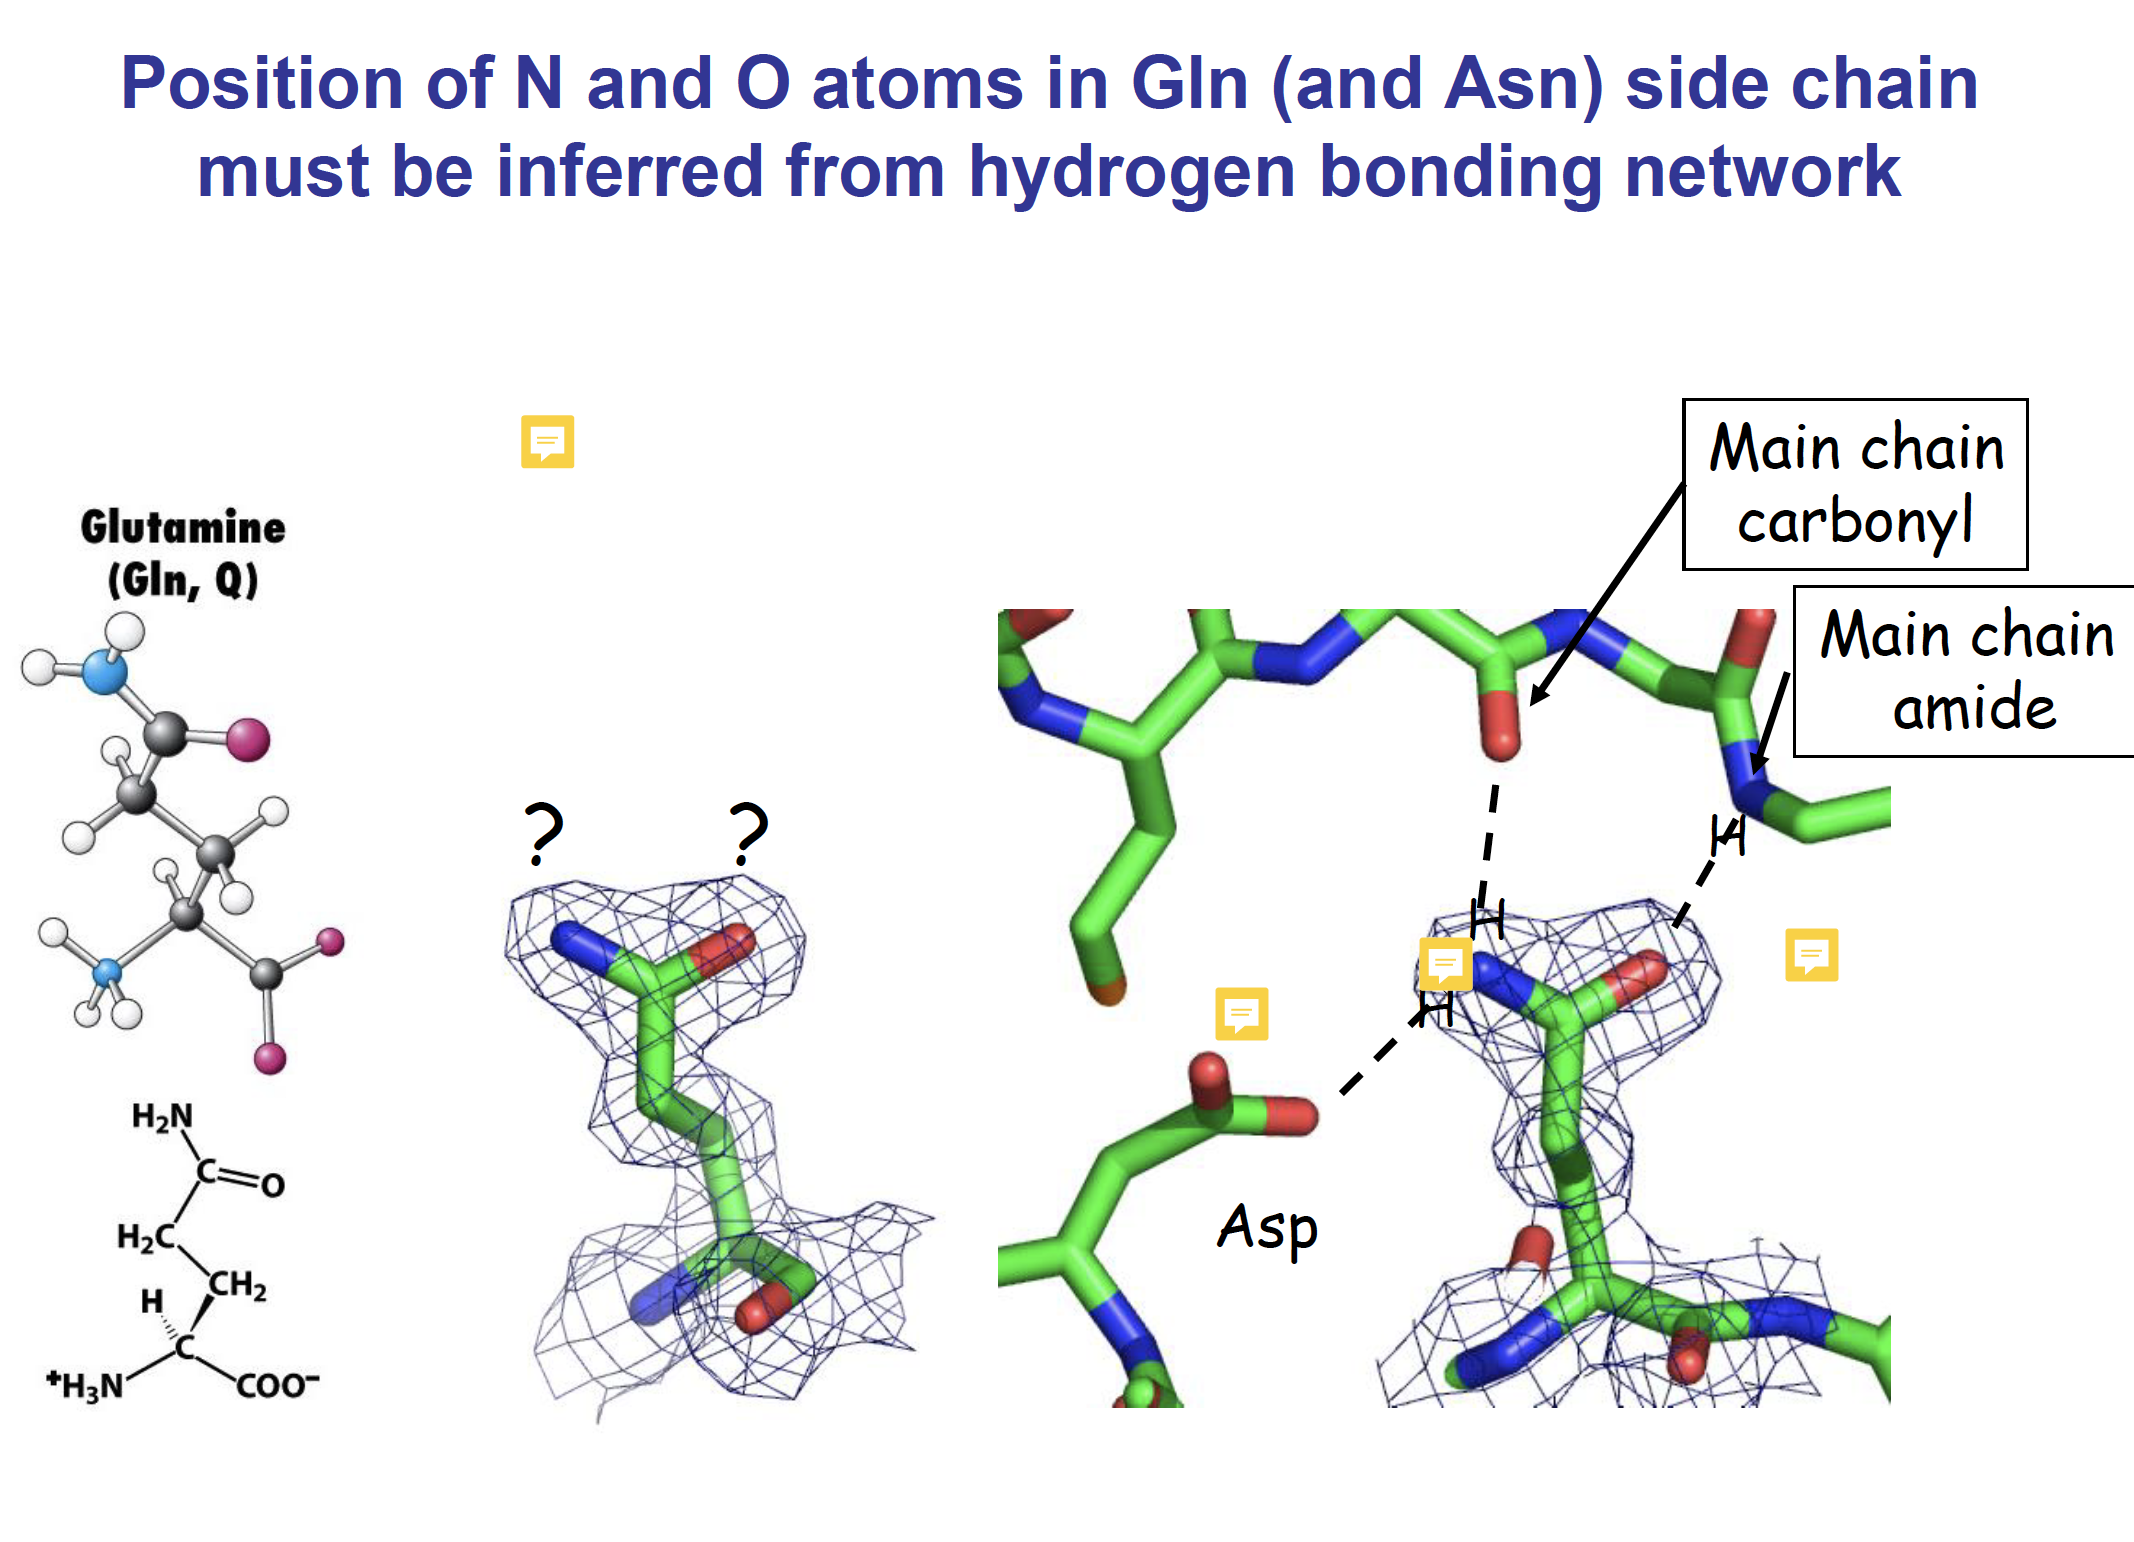
Asp开始从左到右O-N-O
Asparagine and glutamine side-chains can form hydrogen-bonded ladders which contribute significantly to the stability of amyloid fibrils.
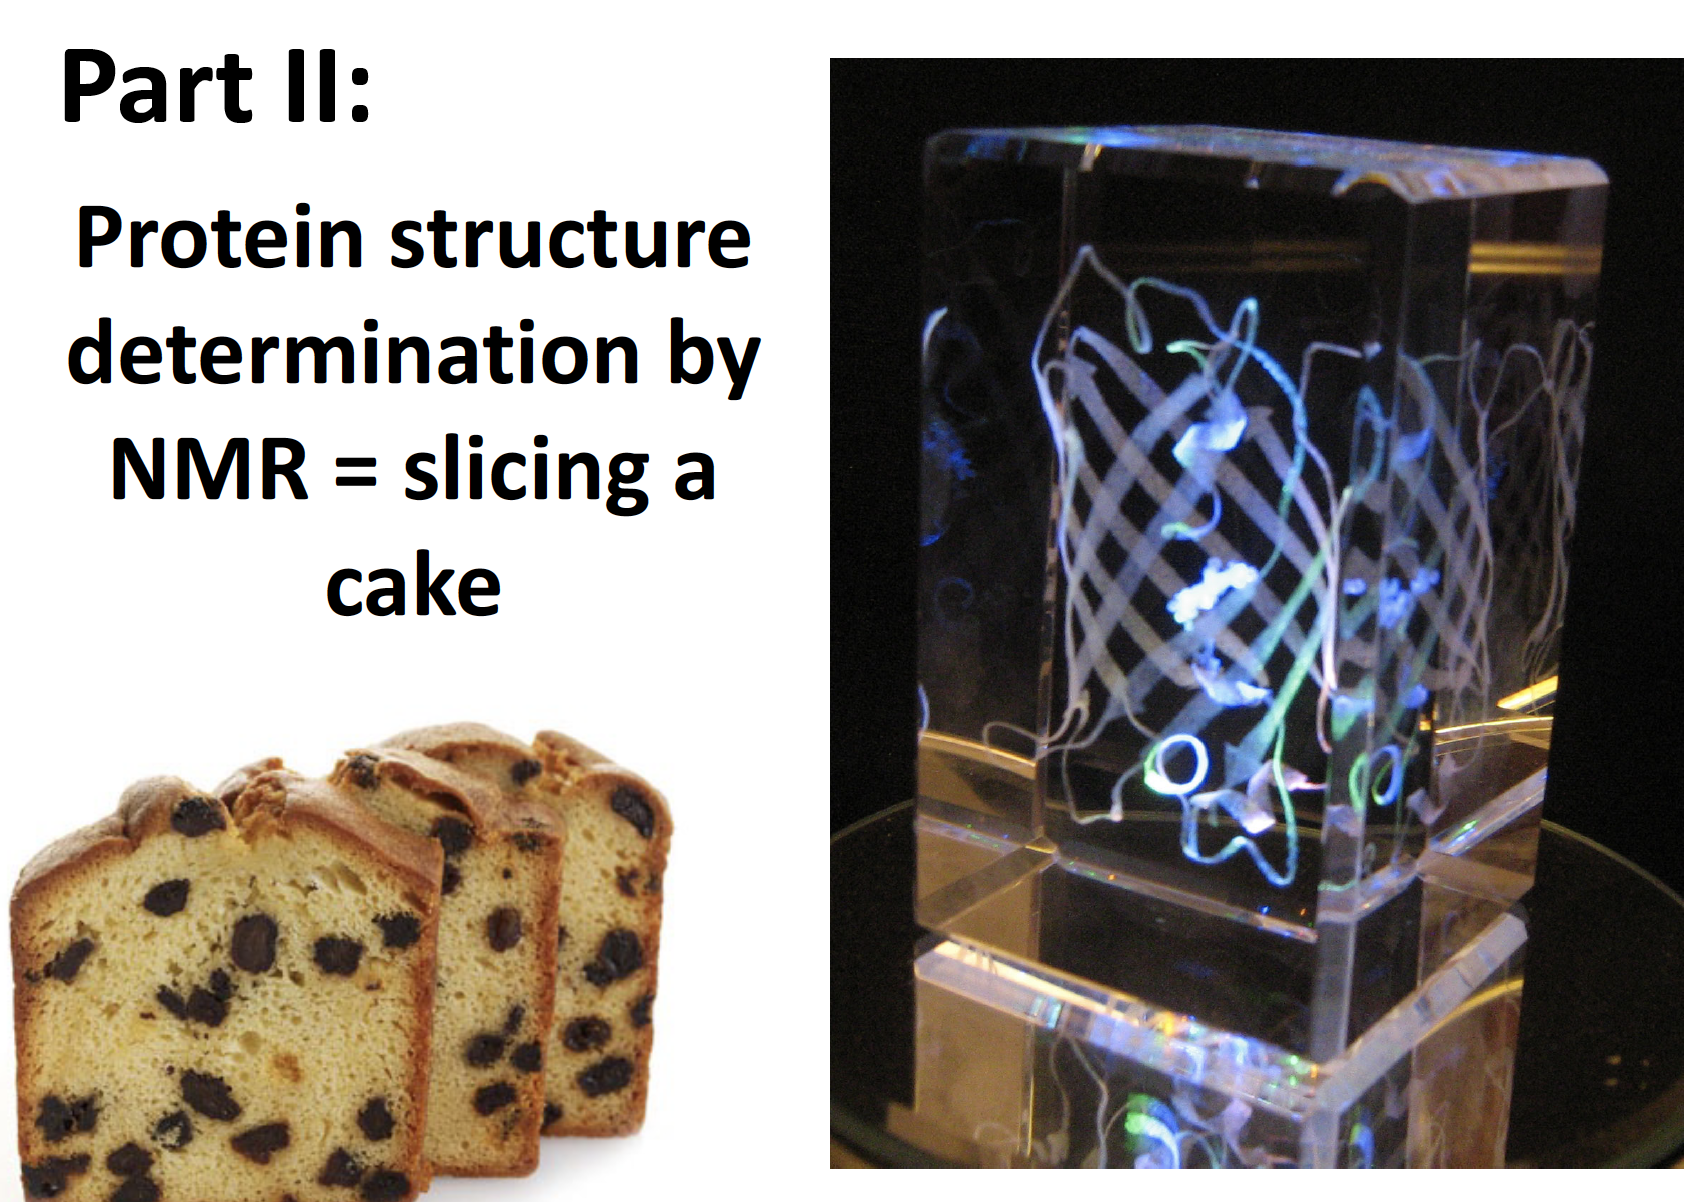
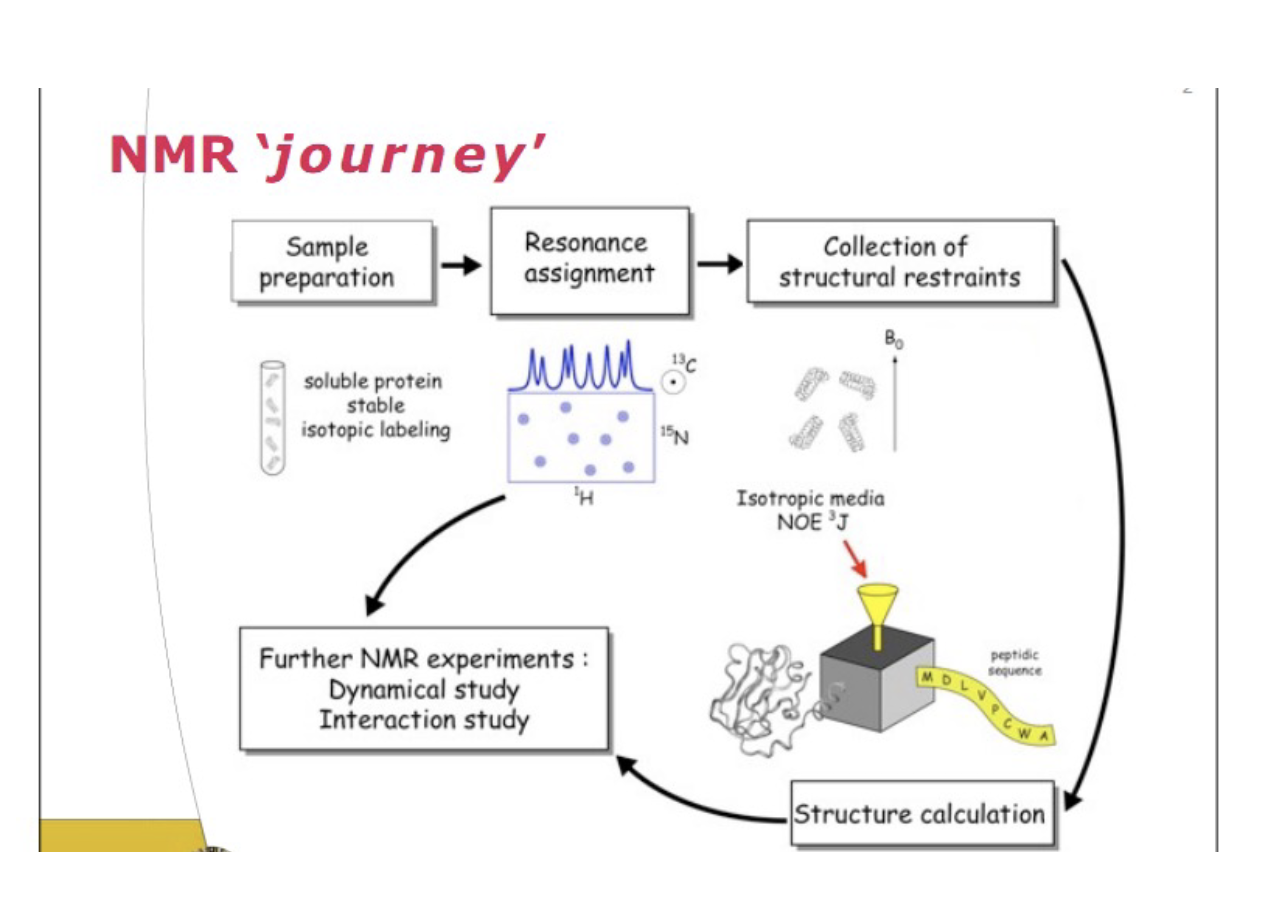
Lecture 13 14 NMR
What is NRM
Nuclear magnetic resonance (NMR) is a physical phenomenon in which nuclei in a strong constant magnetic field are perturbed by a weak oscillating magnetic field (in the near field[1]) and respond by producing an electromagnetic signal with a frequency characteristic of the magnetic field at the nucleus.
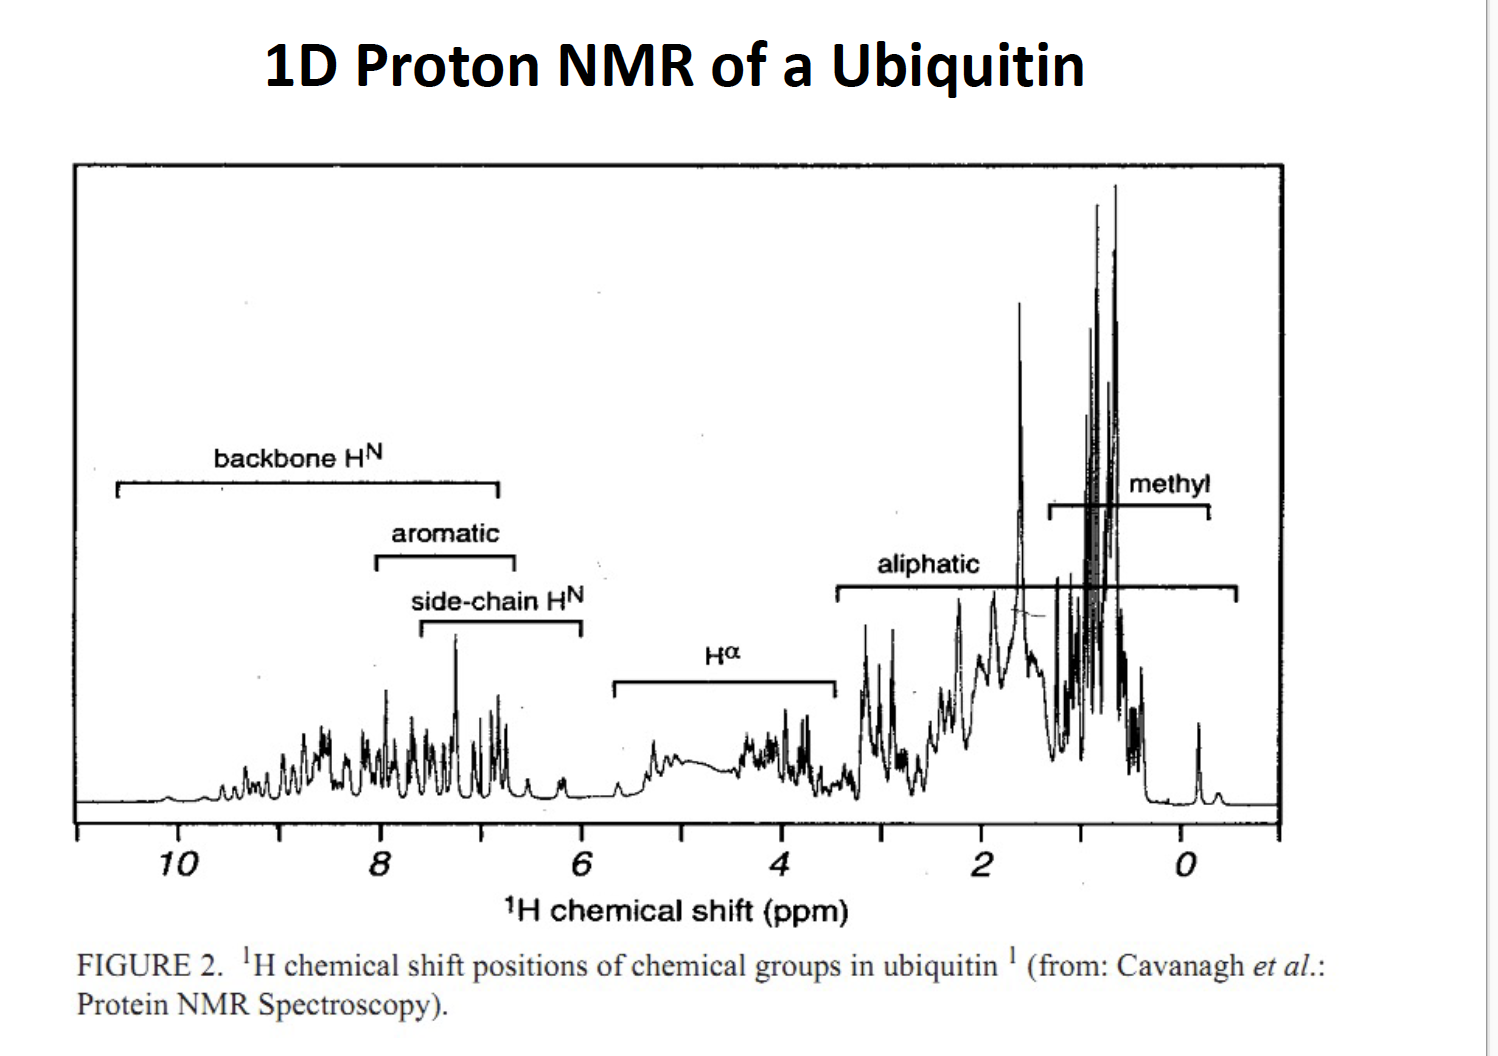
used to identity peptide amide chain
demo in class
answer a:
answer b:
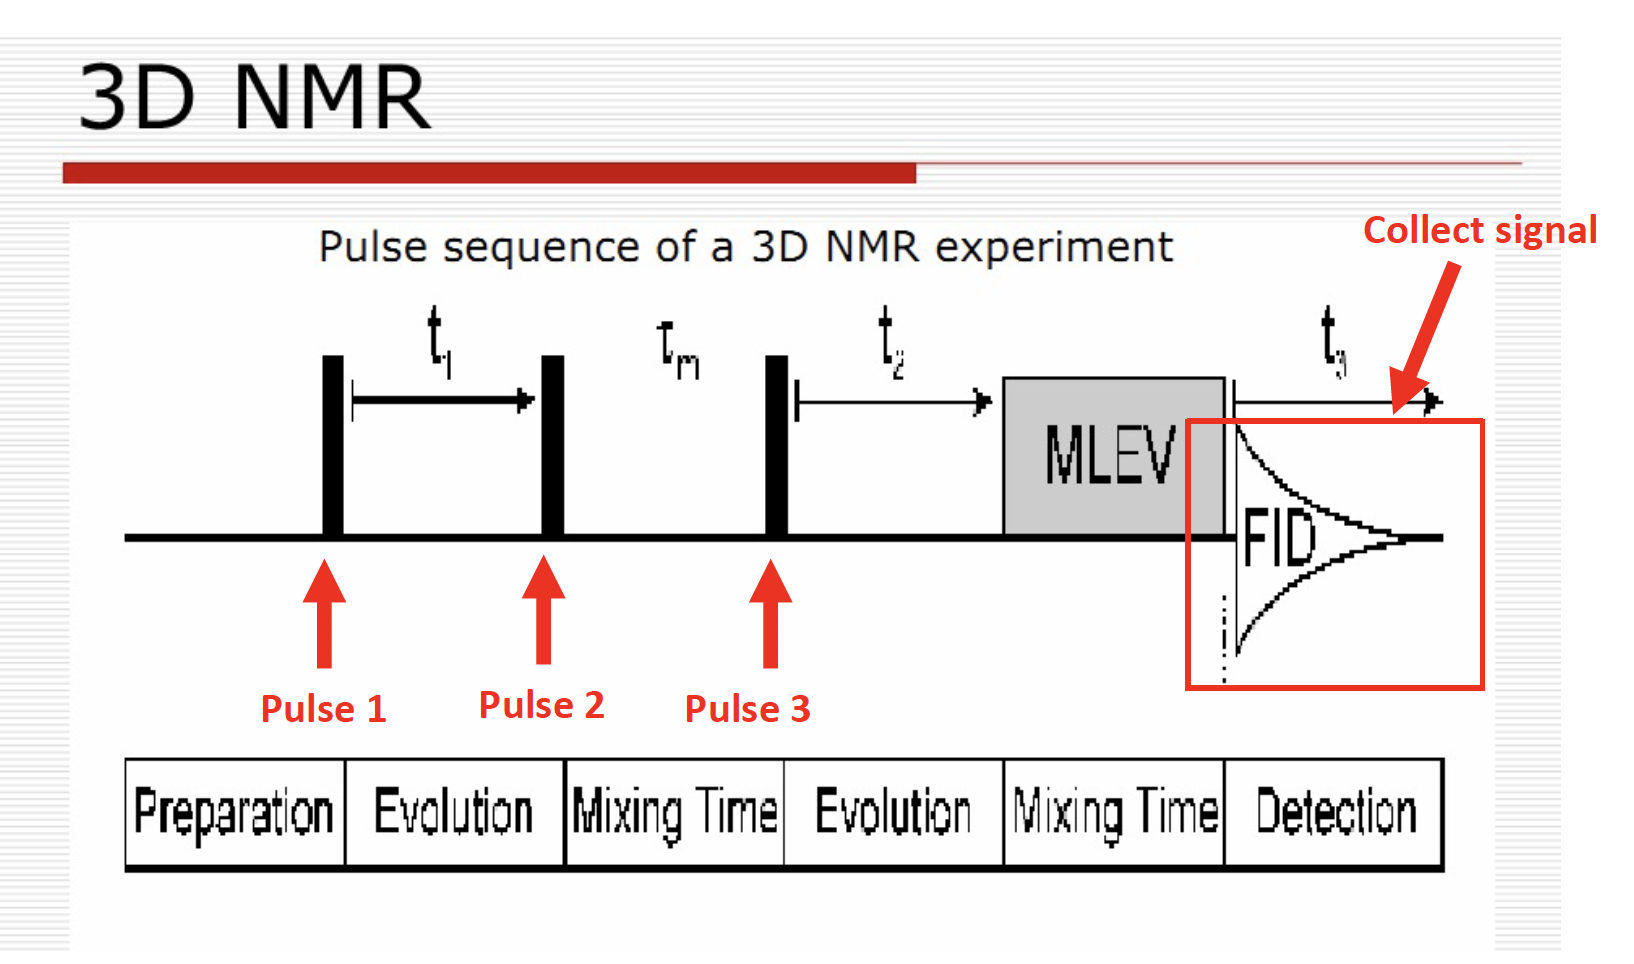
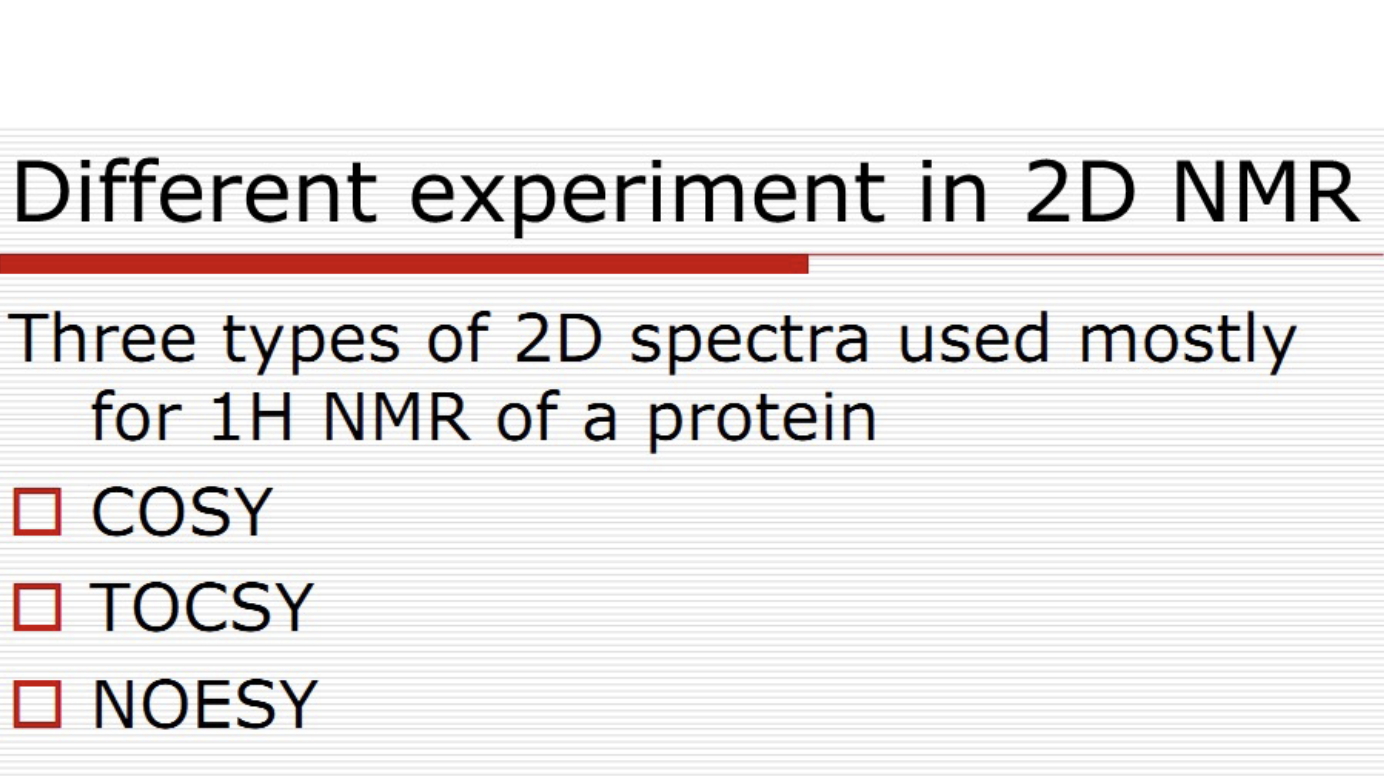
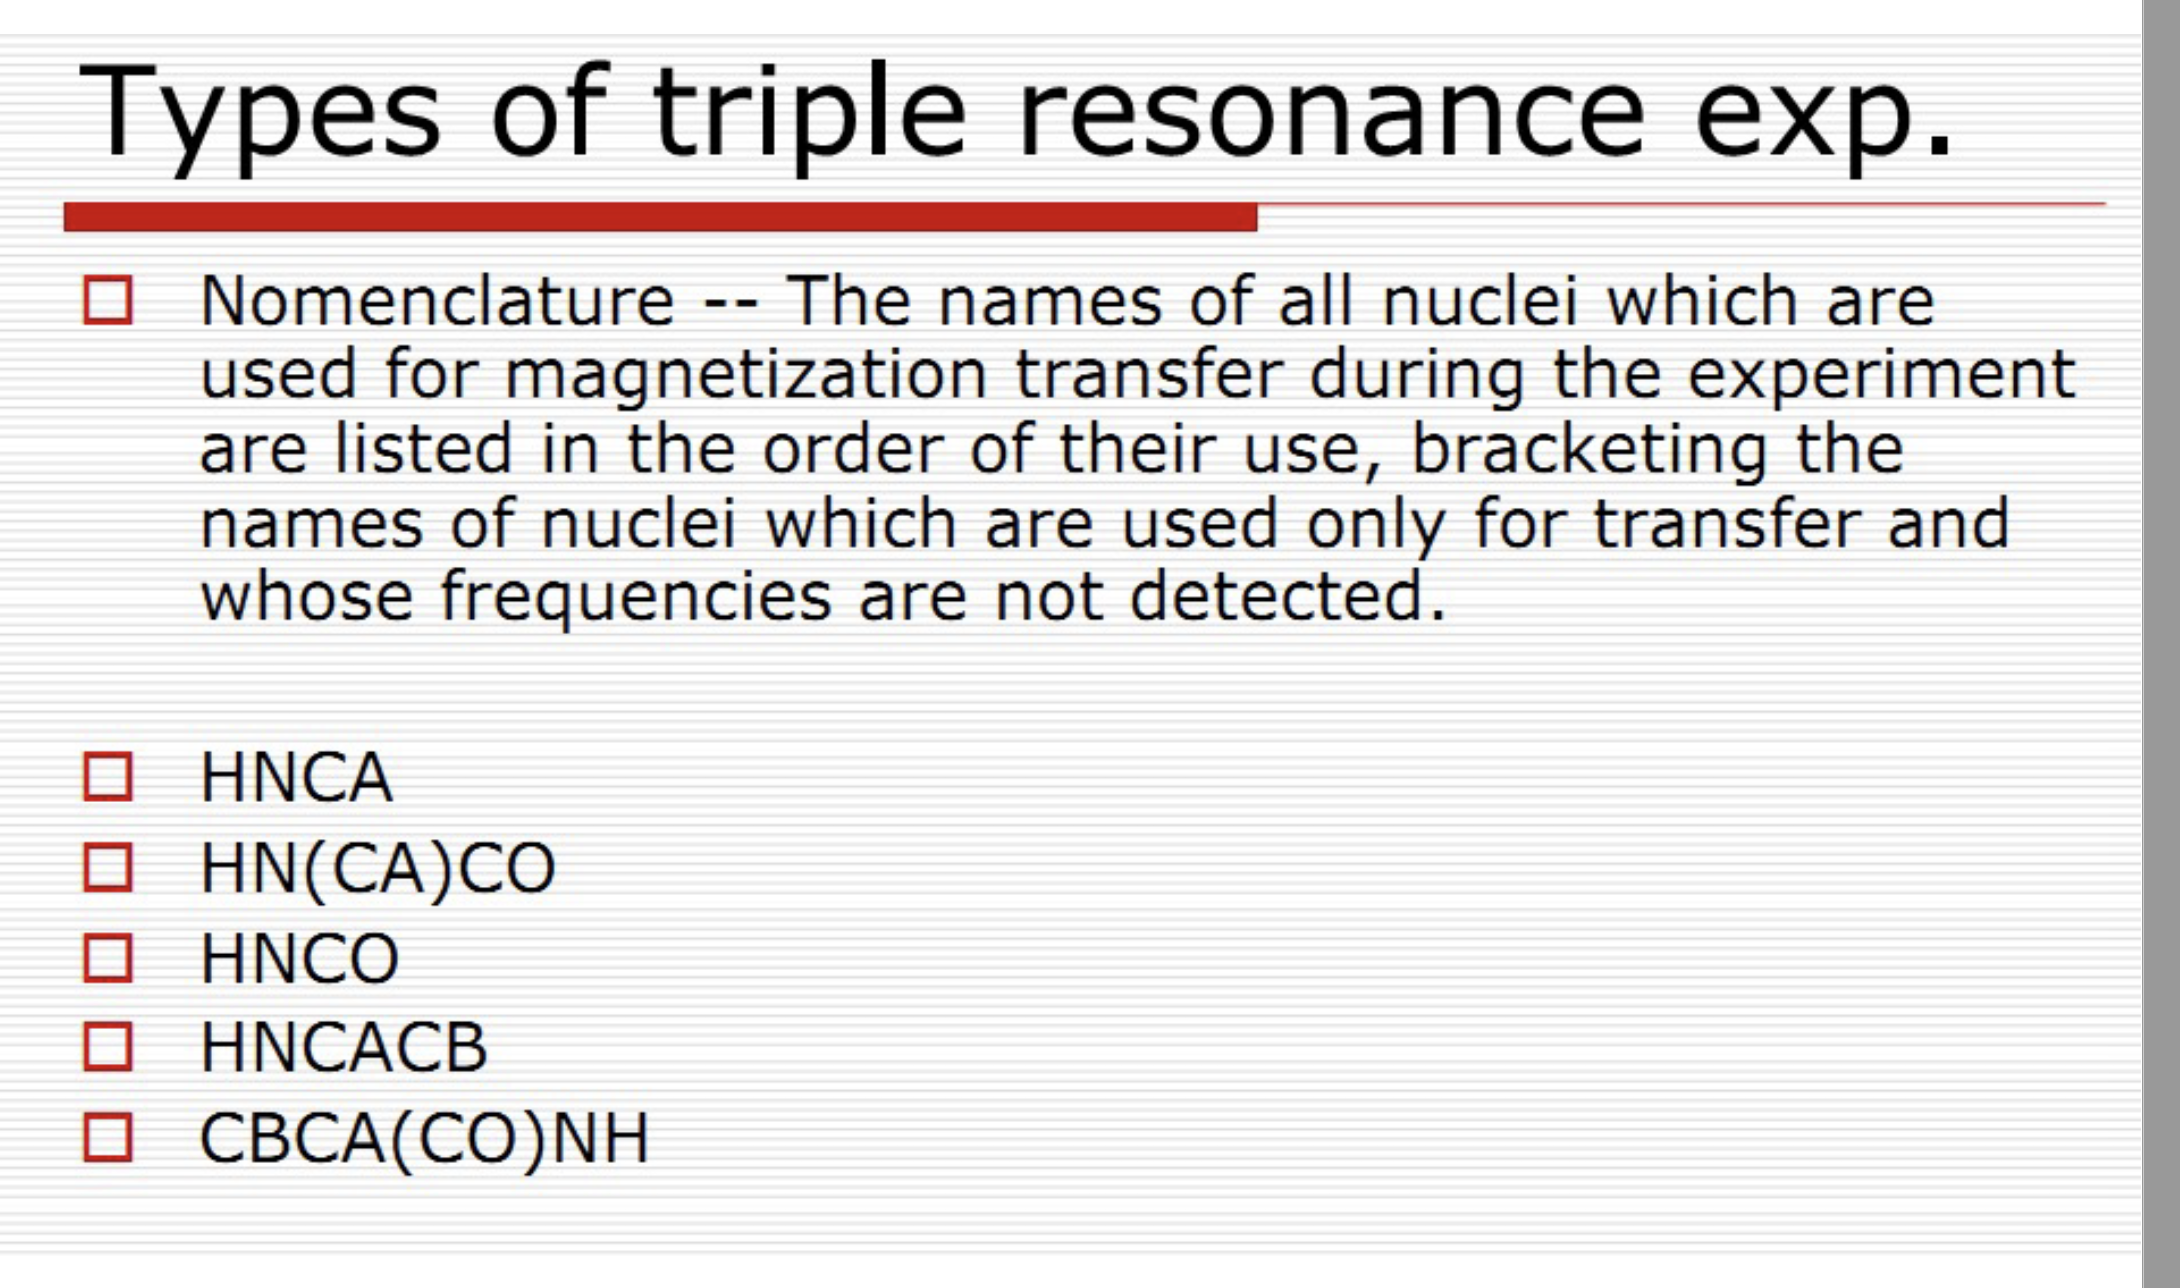
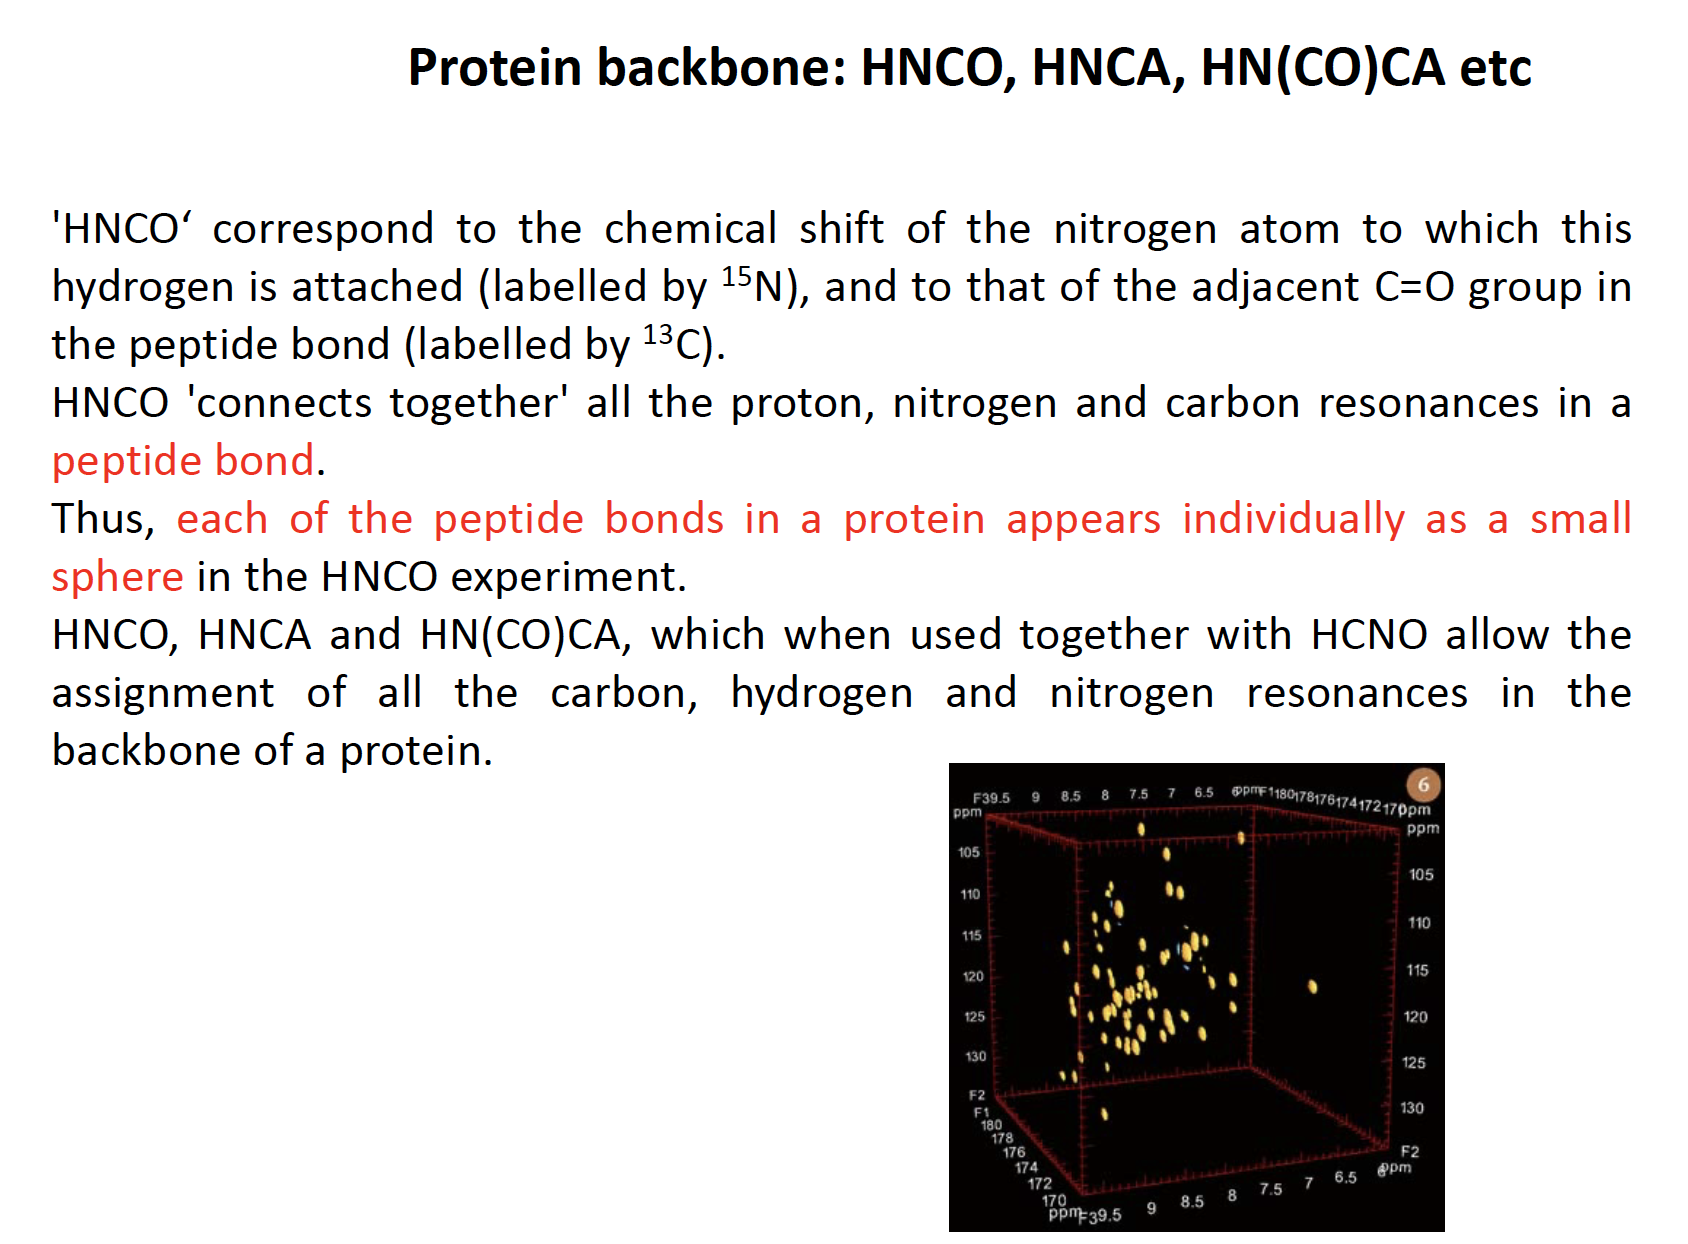
Types of triple resonance
Nomenclature:
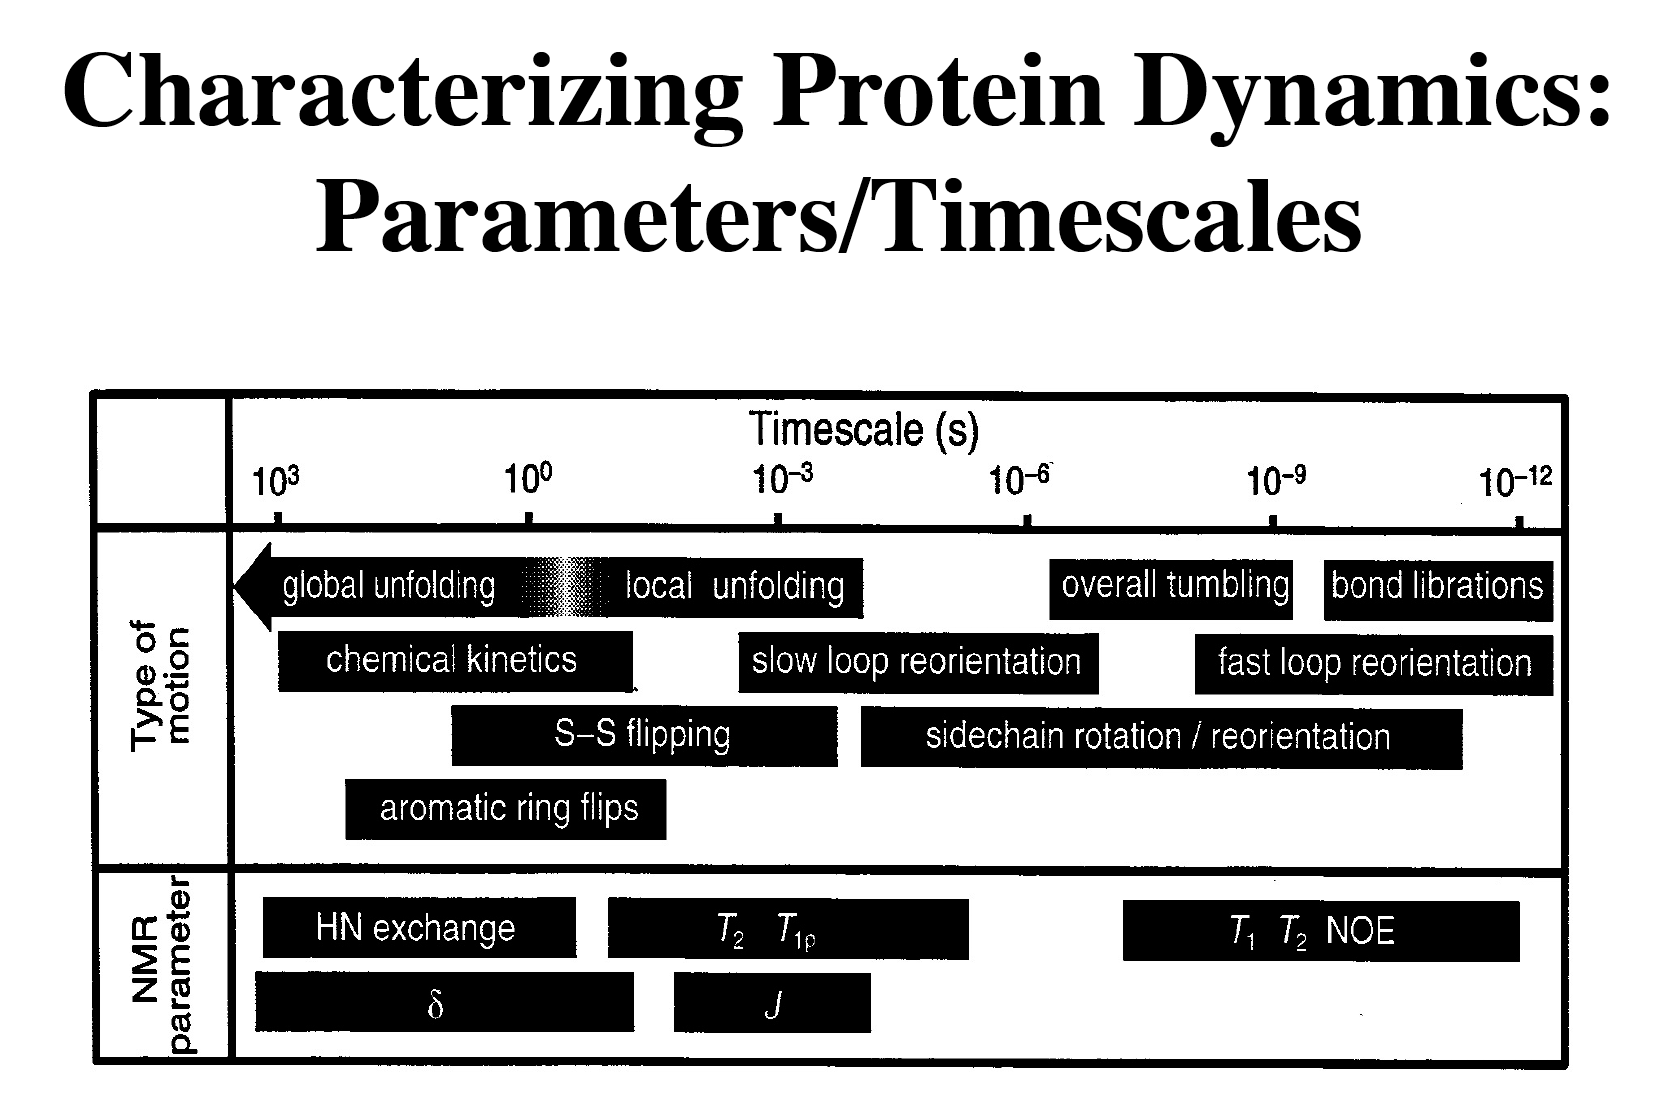
Protein dynamics
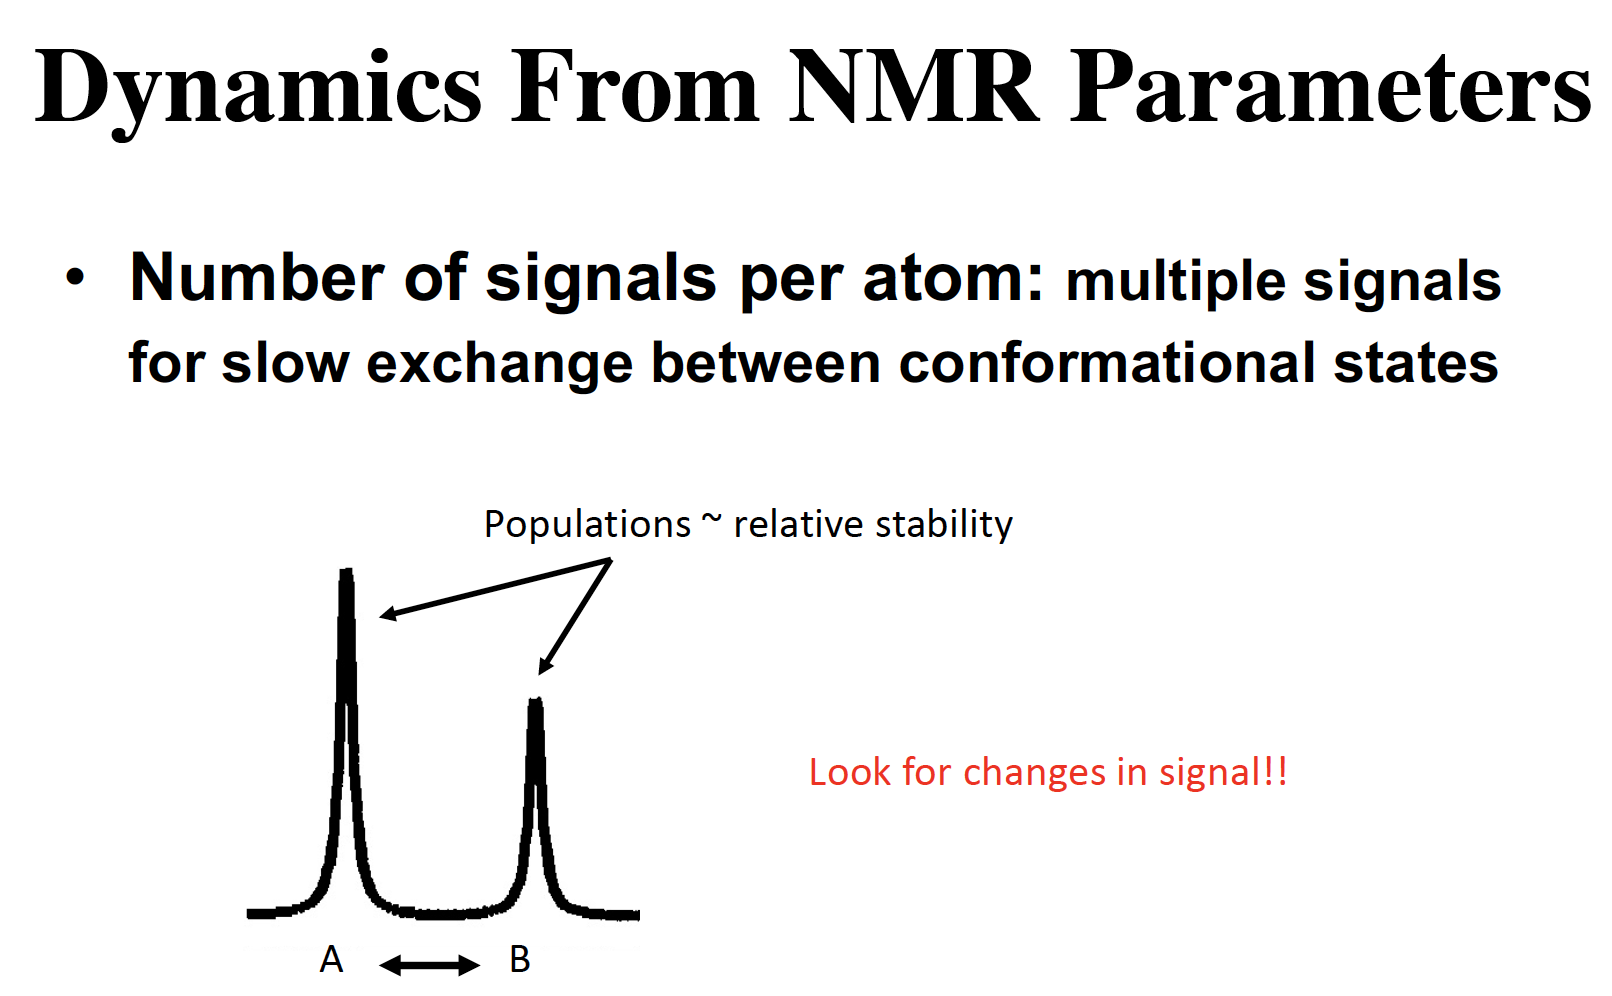
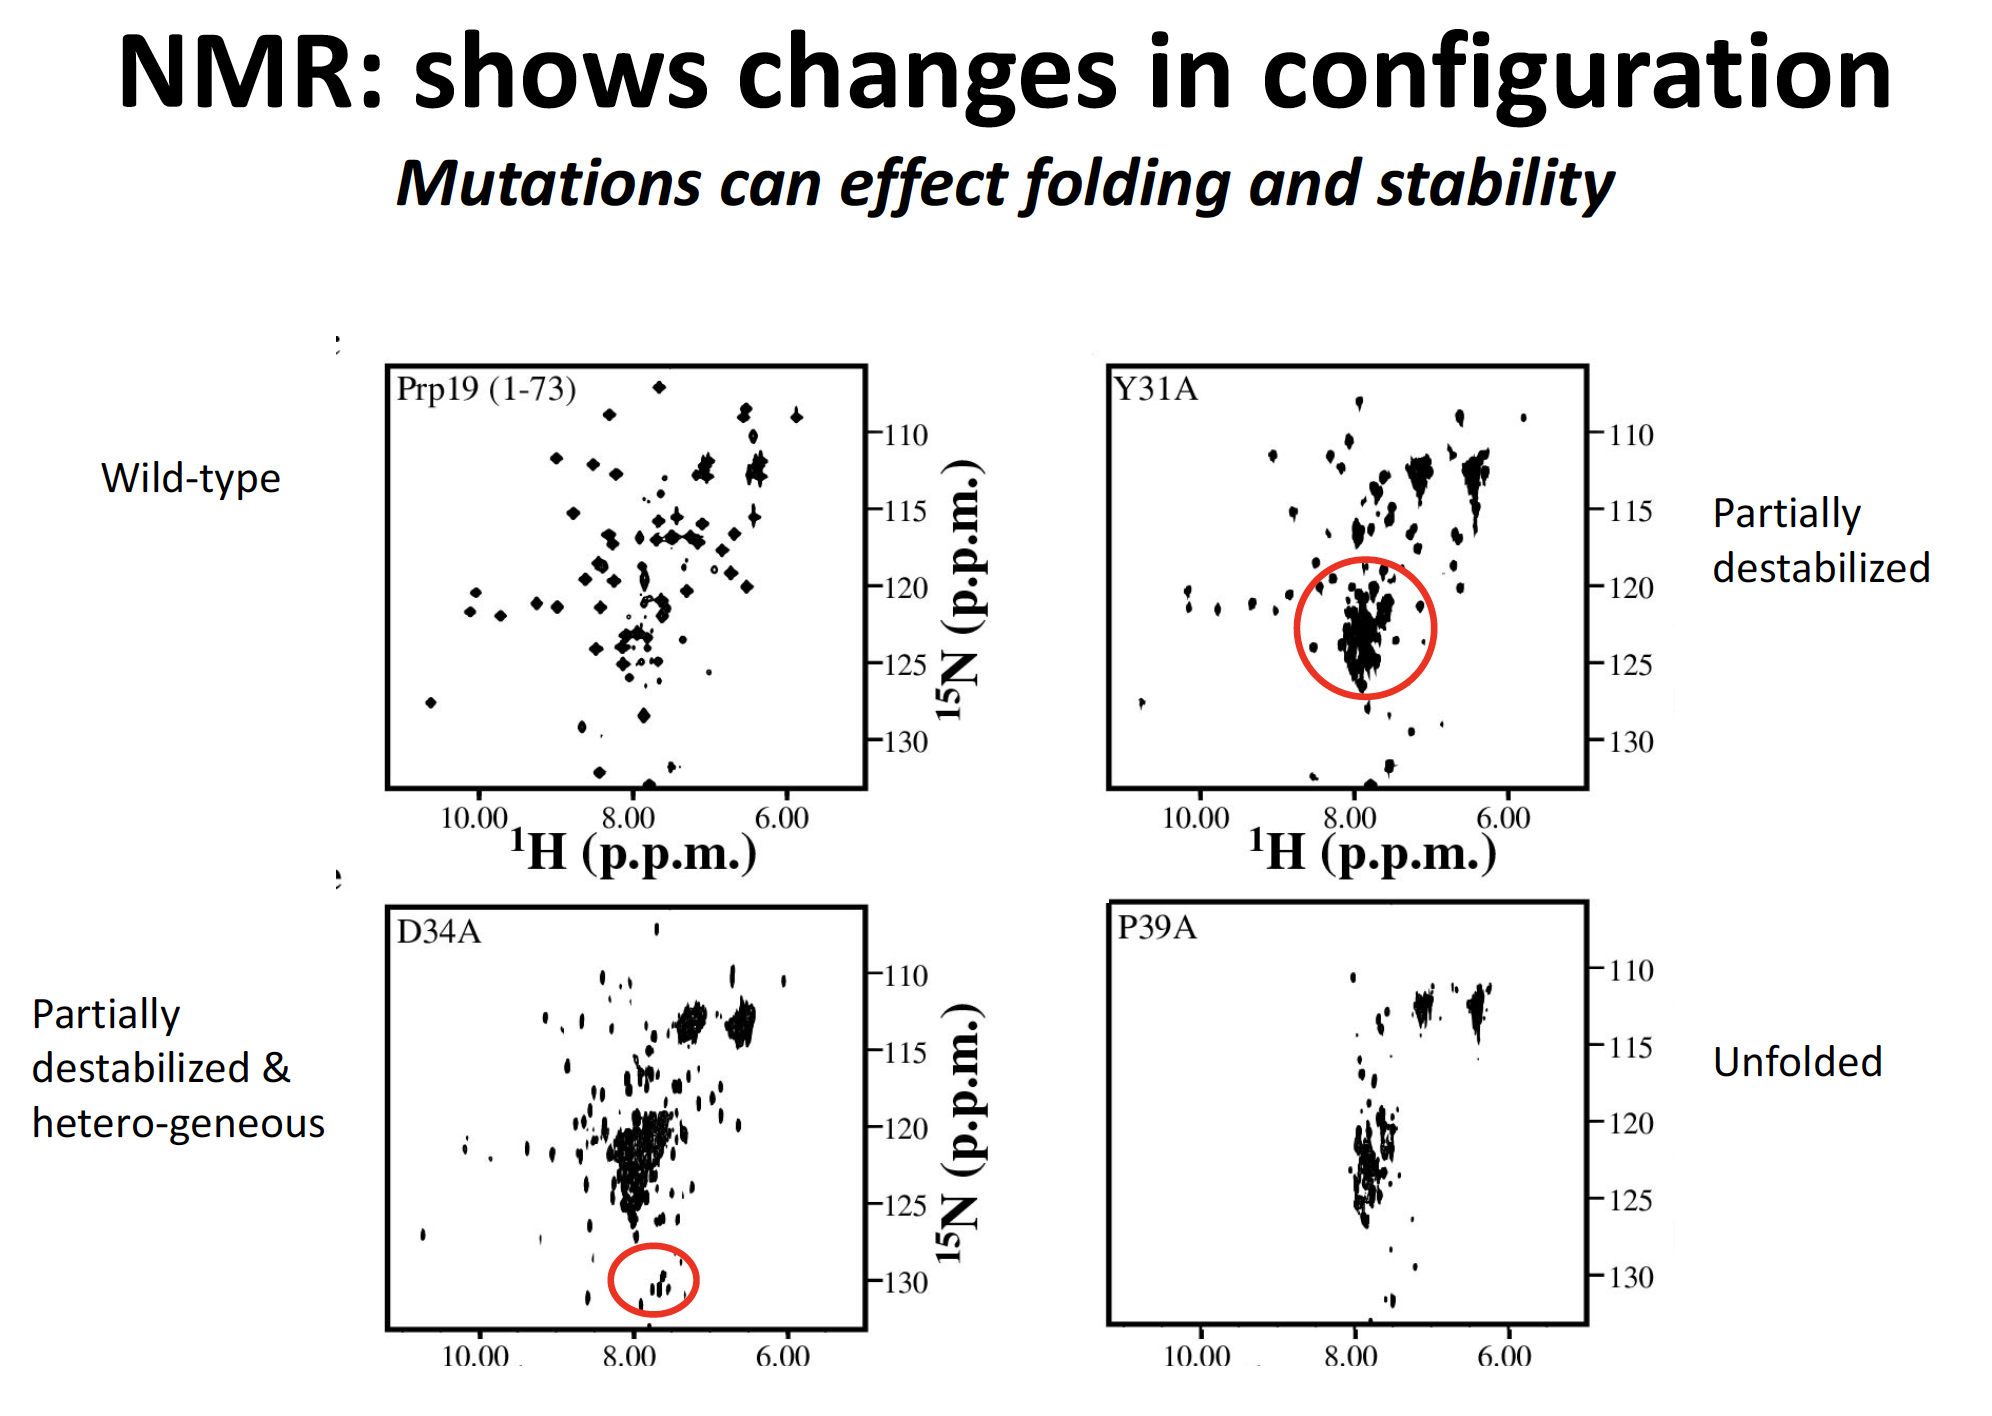
NMR: shows change in configuration
mutations can effect folding and stability
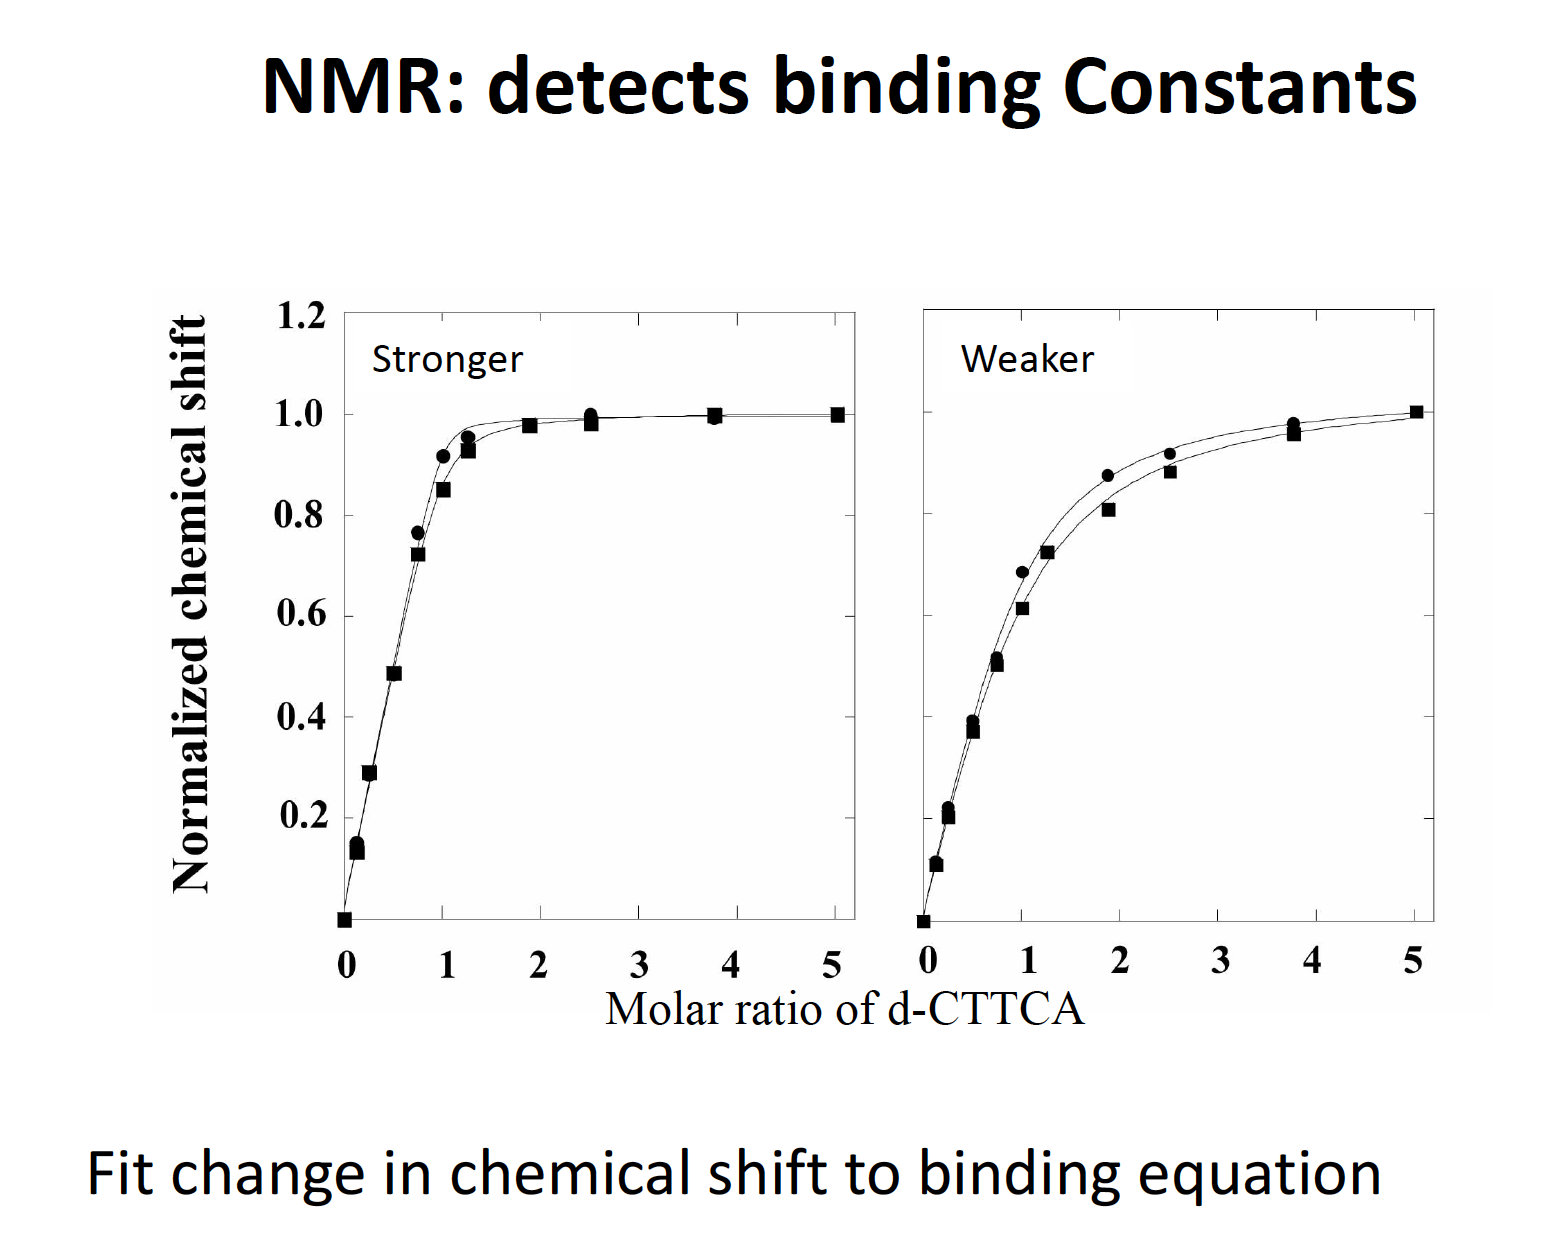
Binding constants
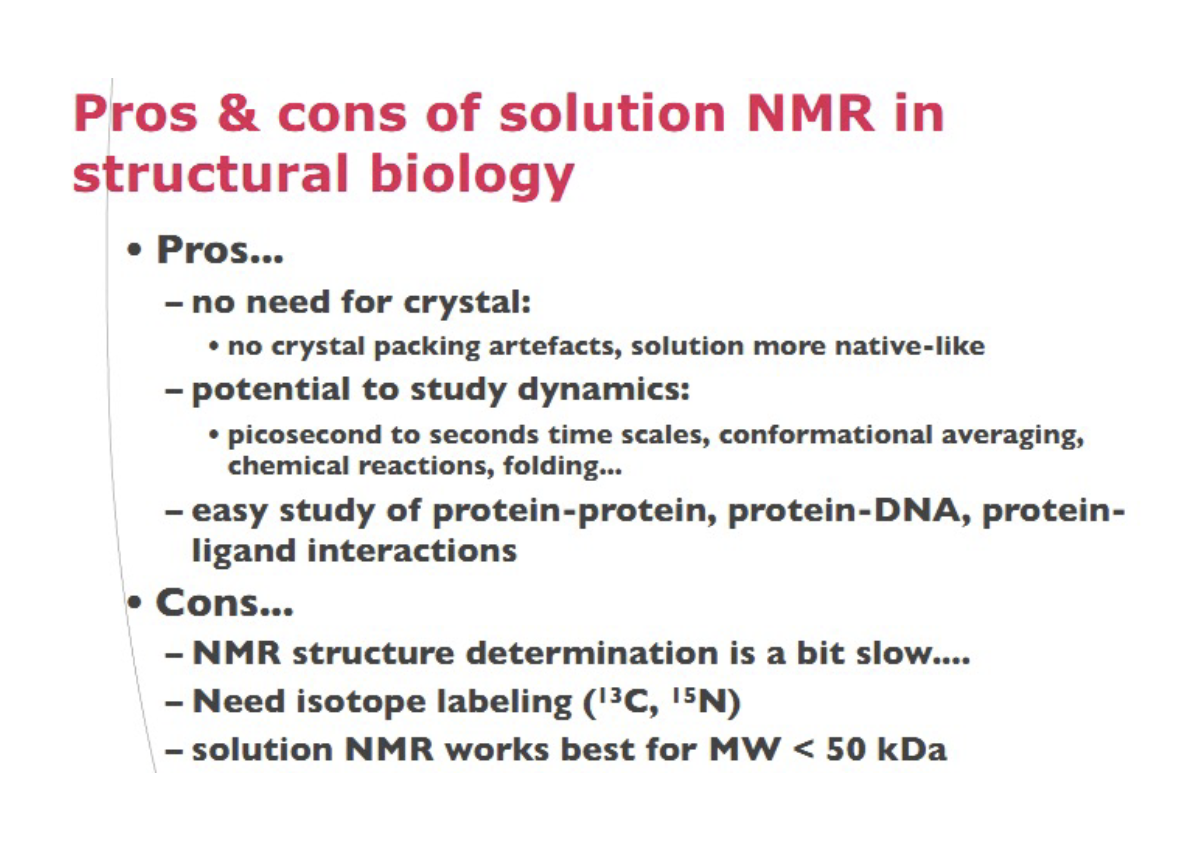
Pros and cons of NRM in structural biology
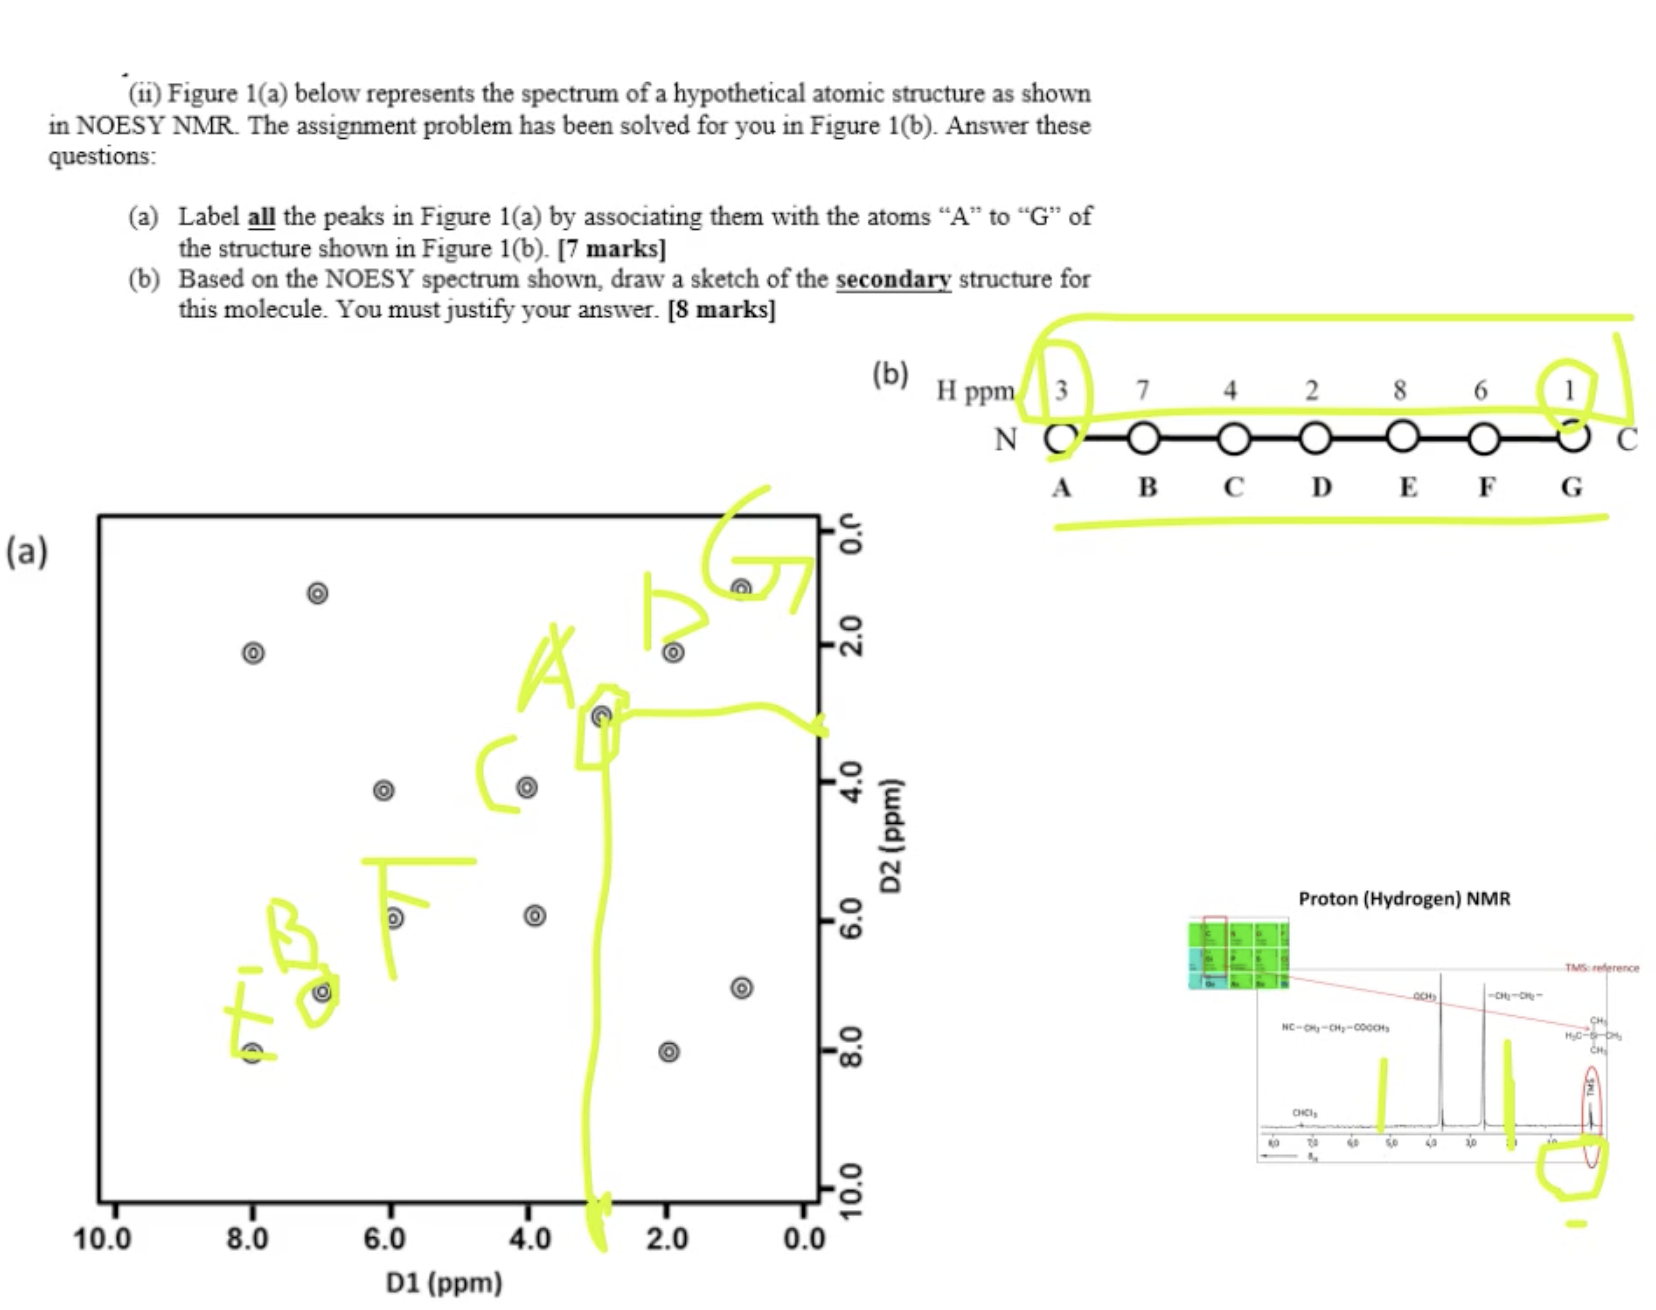
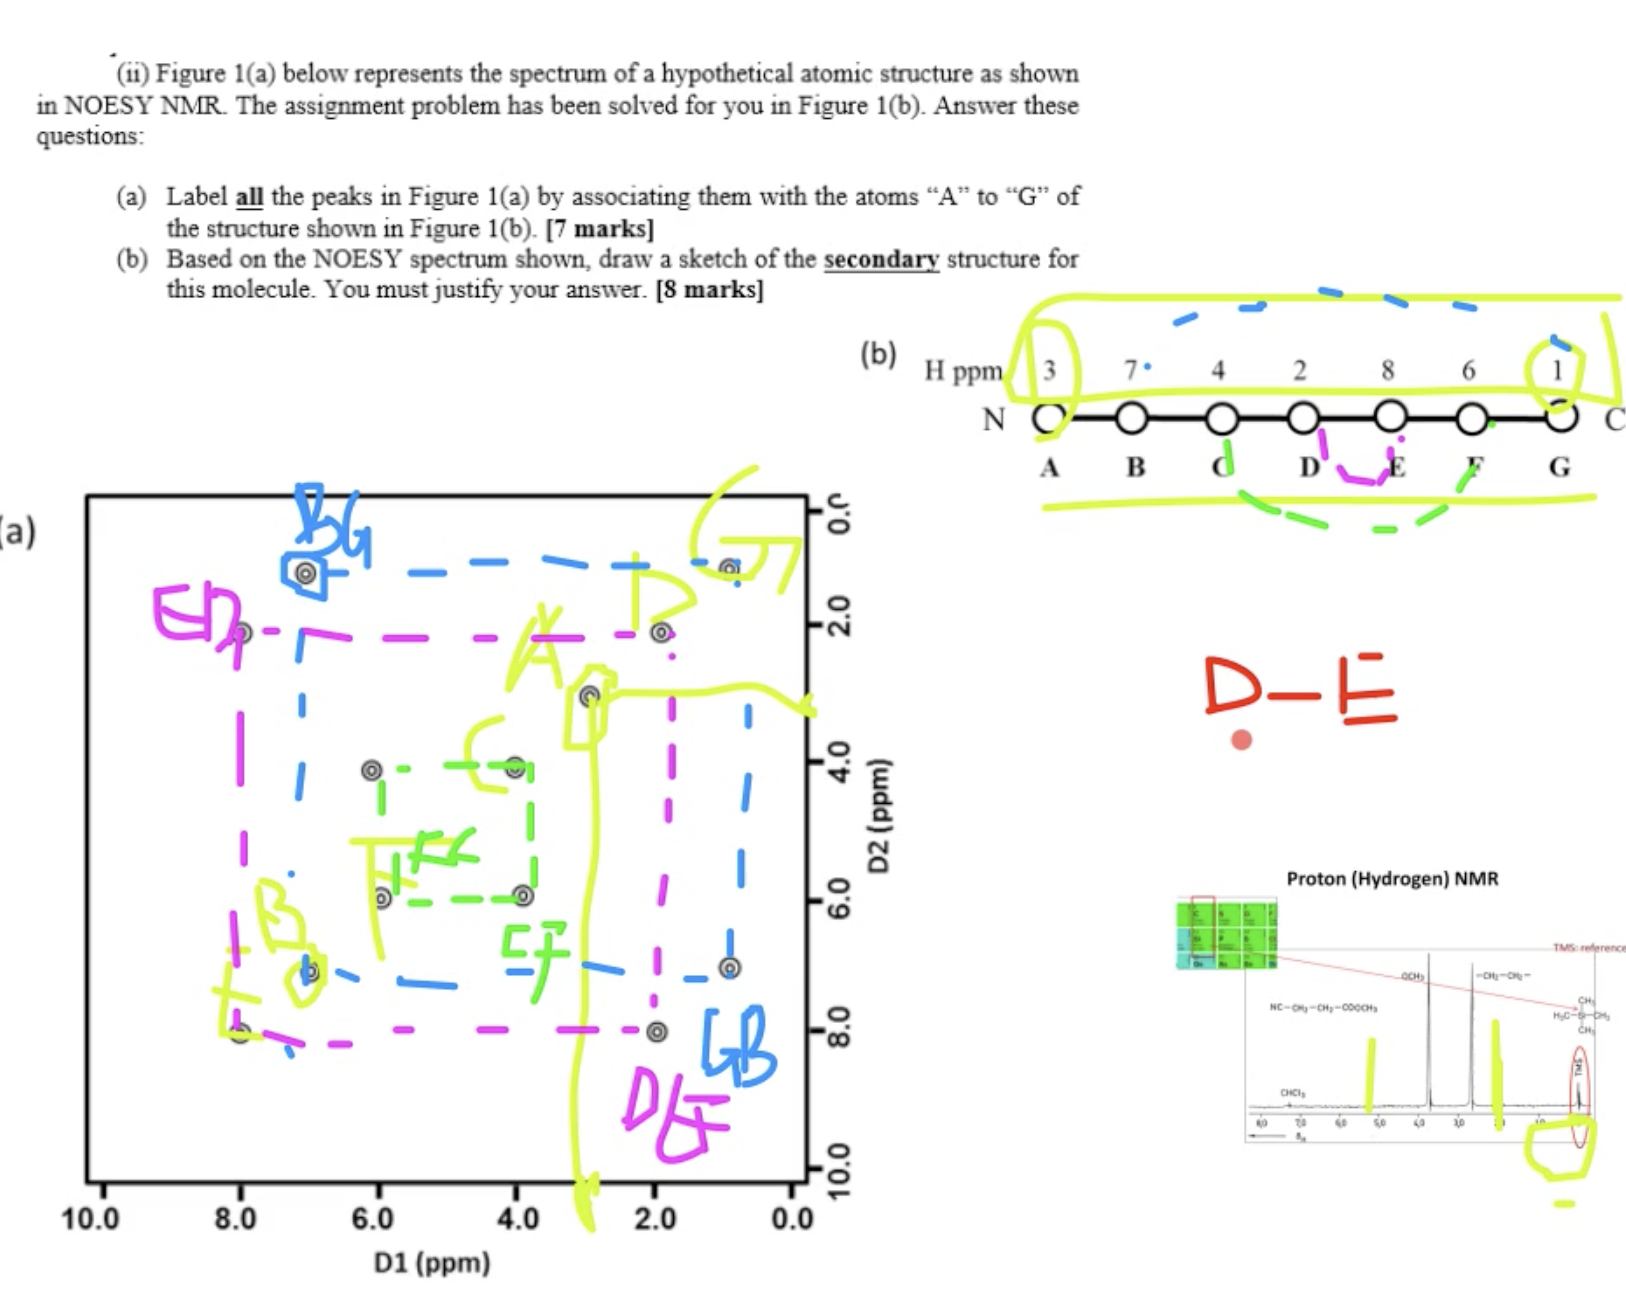
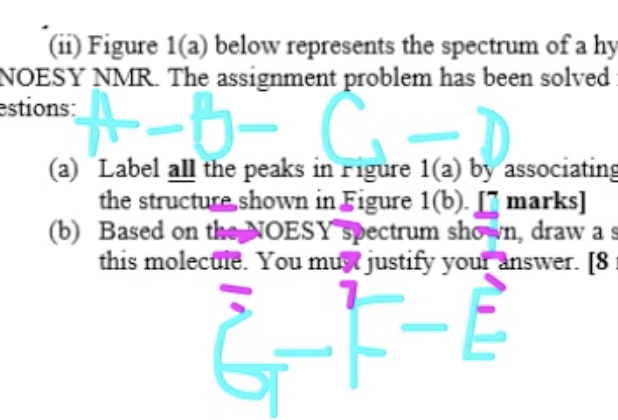
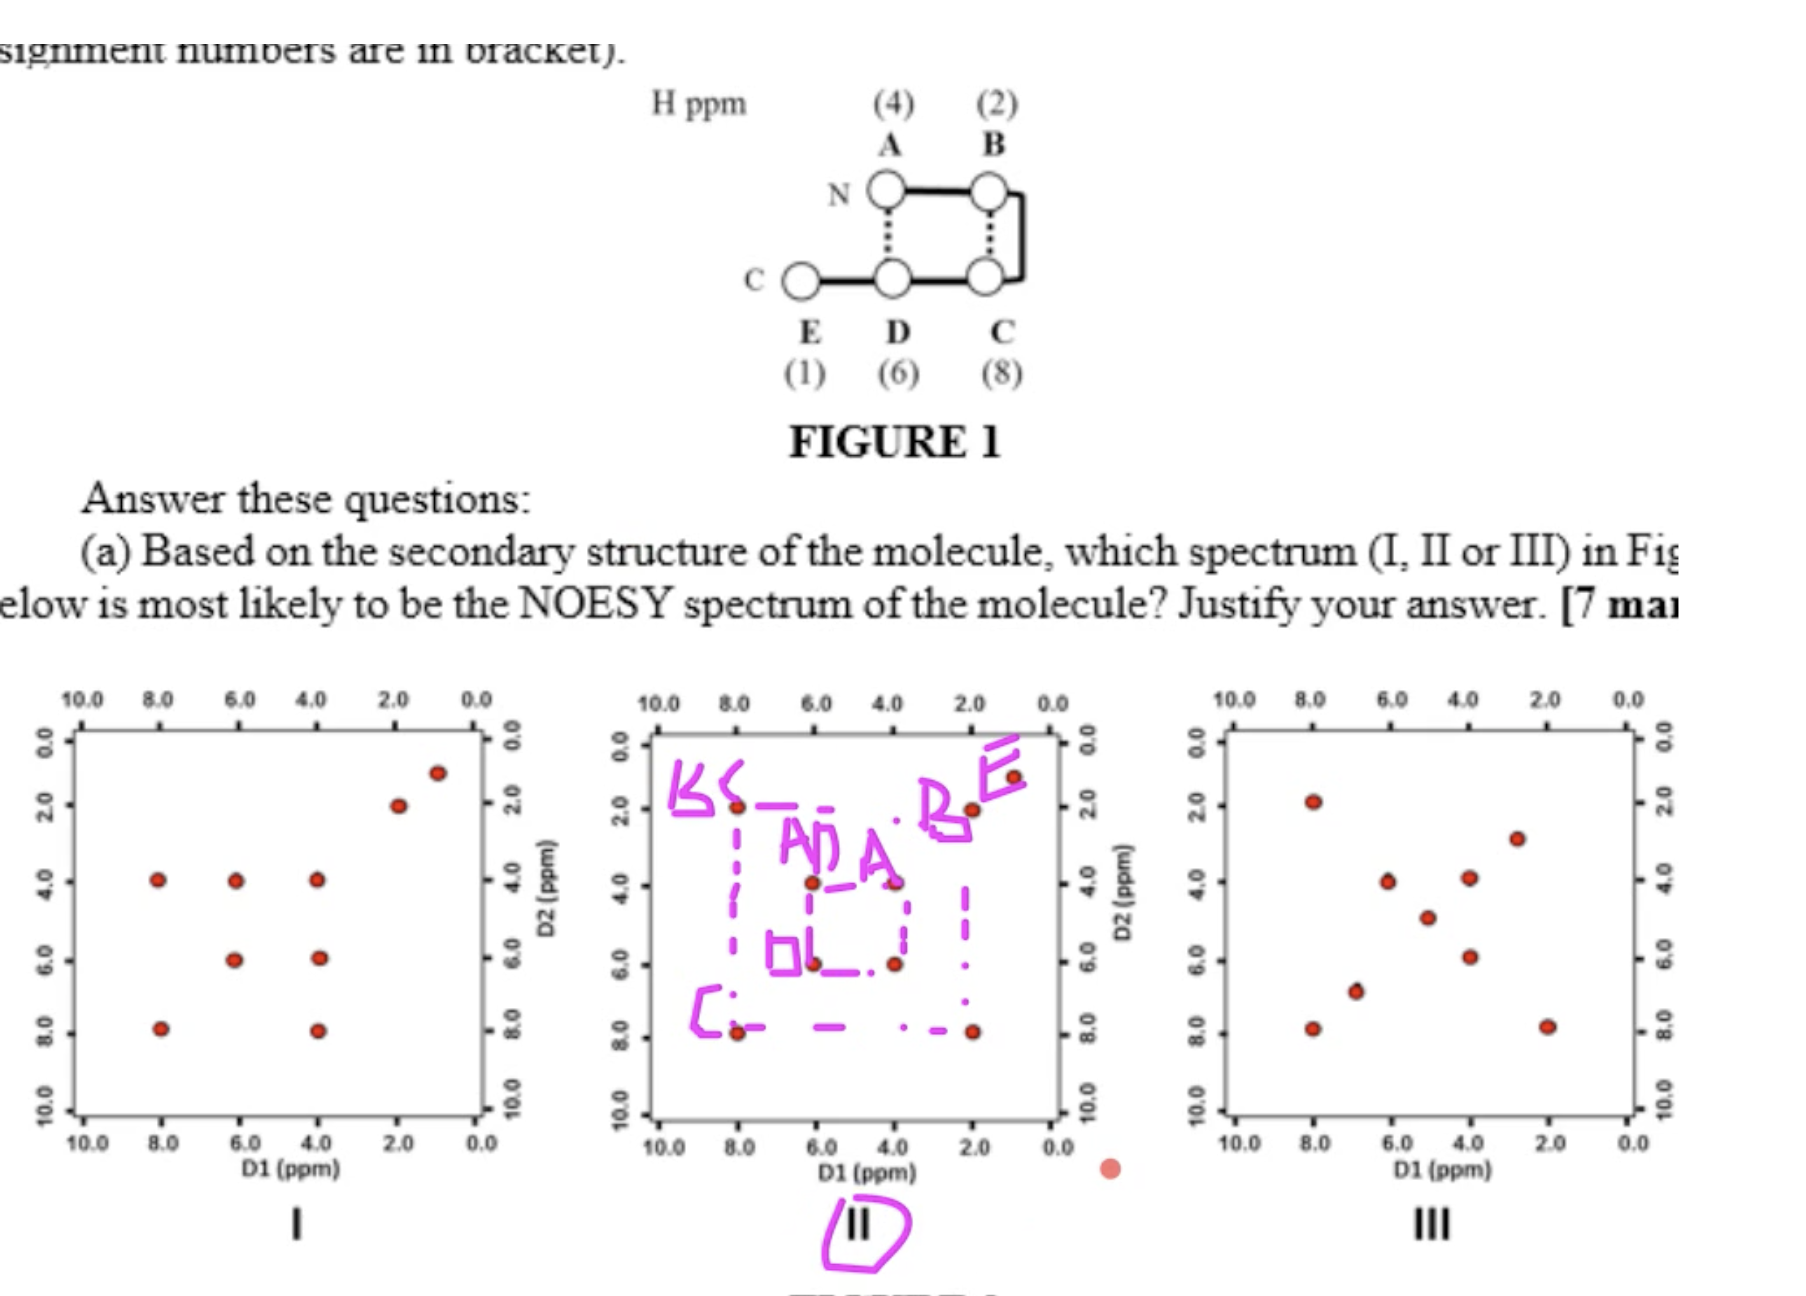
Tutorial on NMR
Question 1
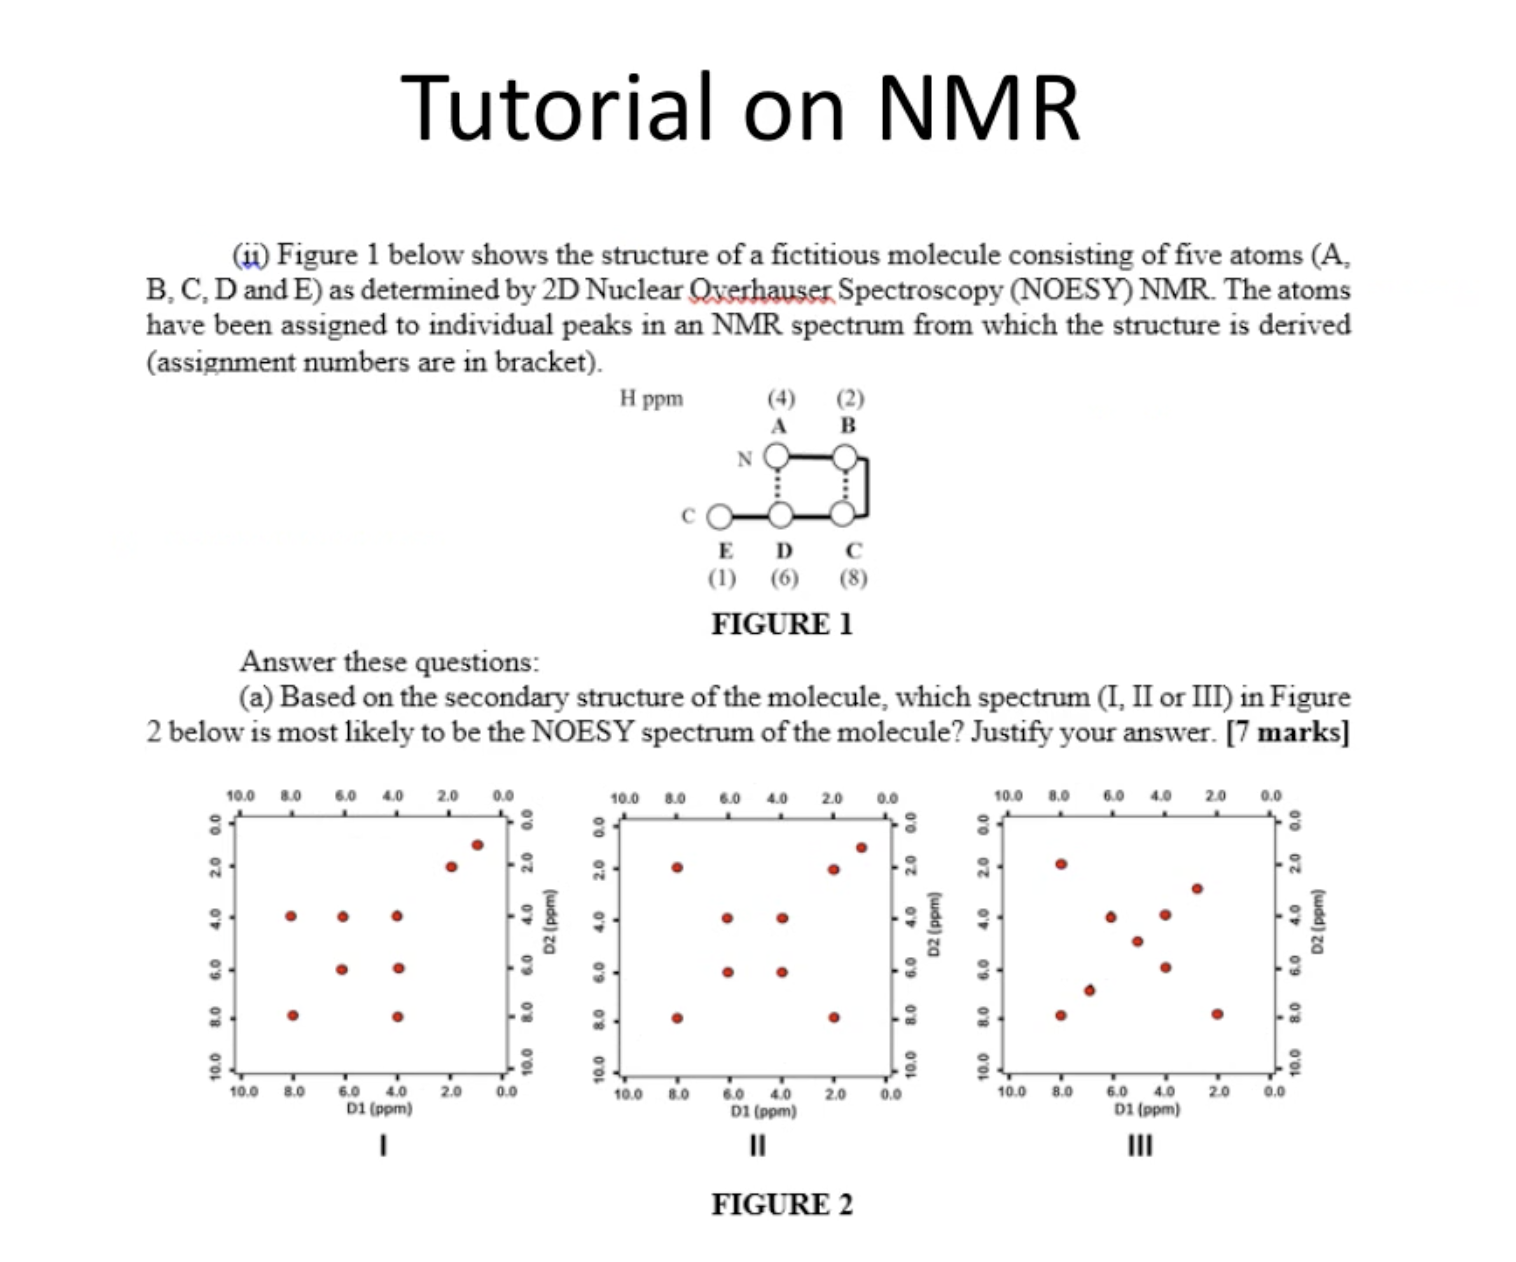
answer
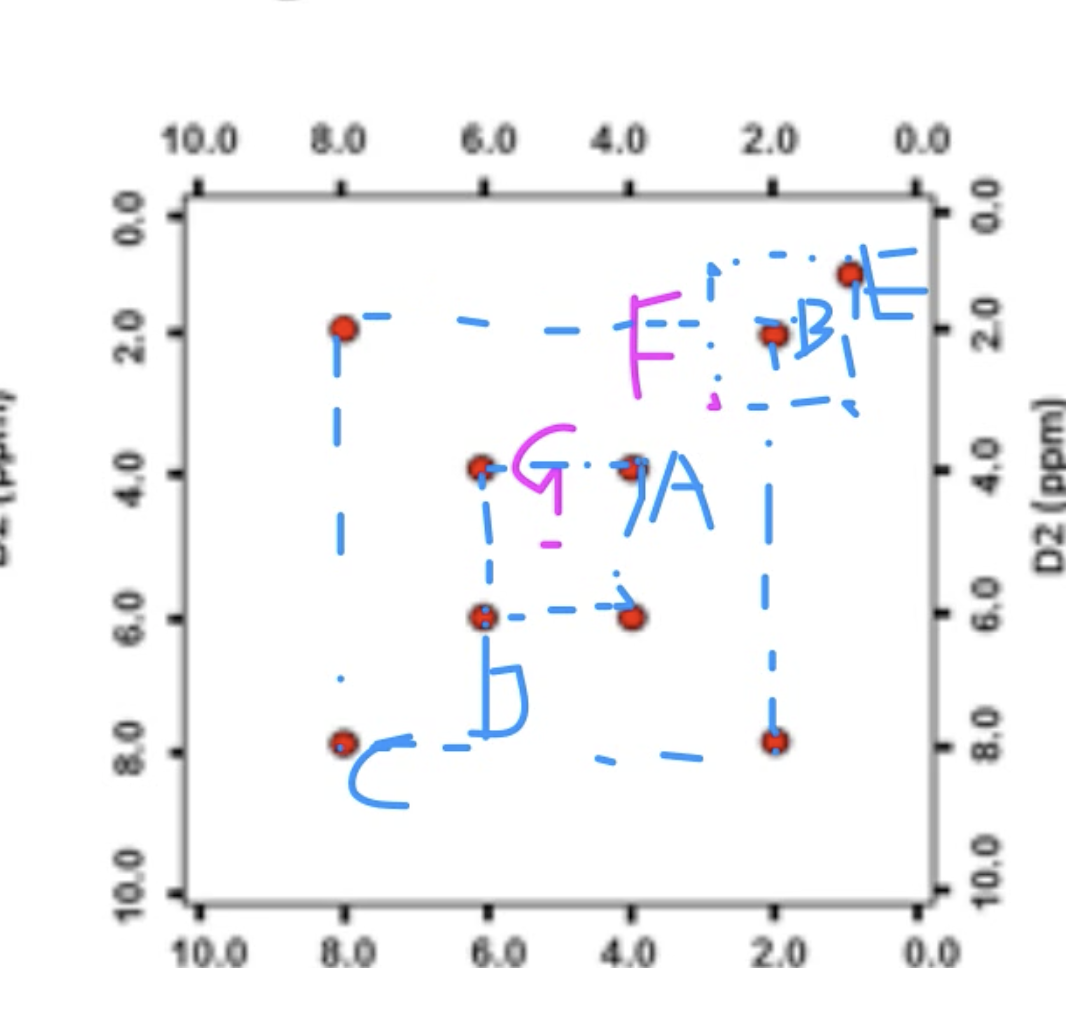
Question 2
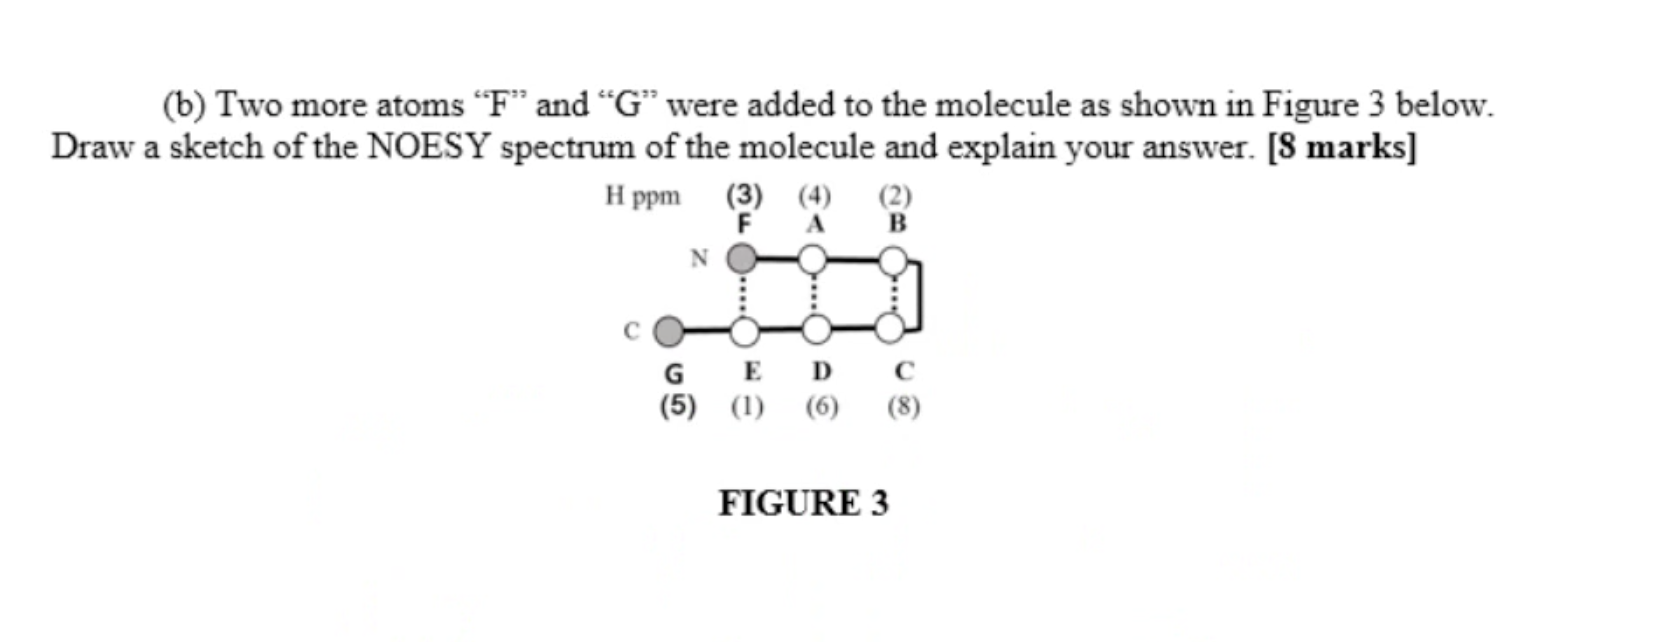
answer
Question 3
answer
Lecture 15 CD
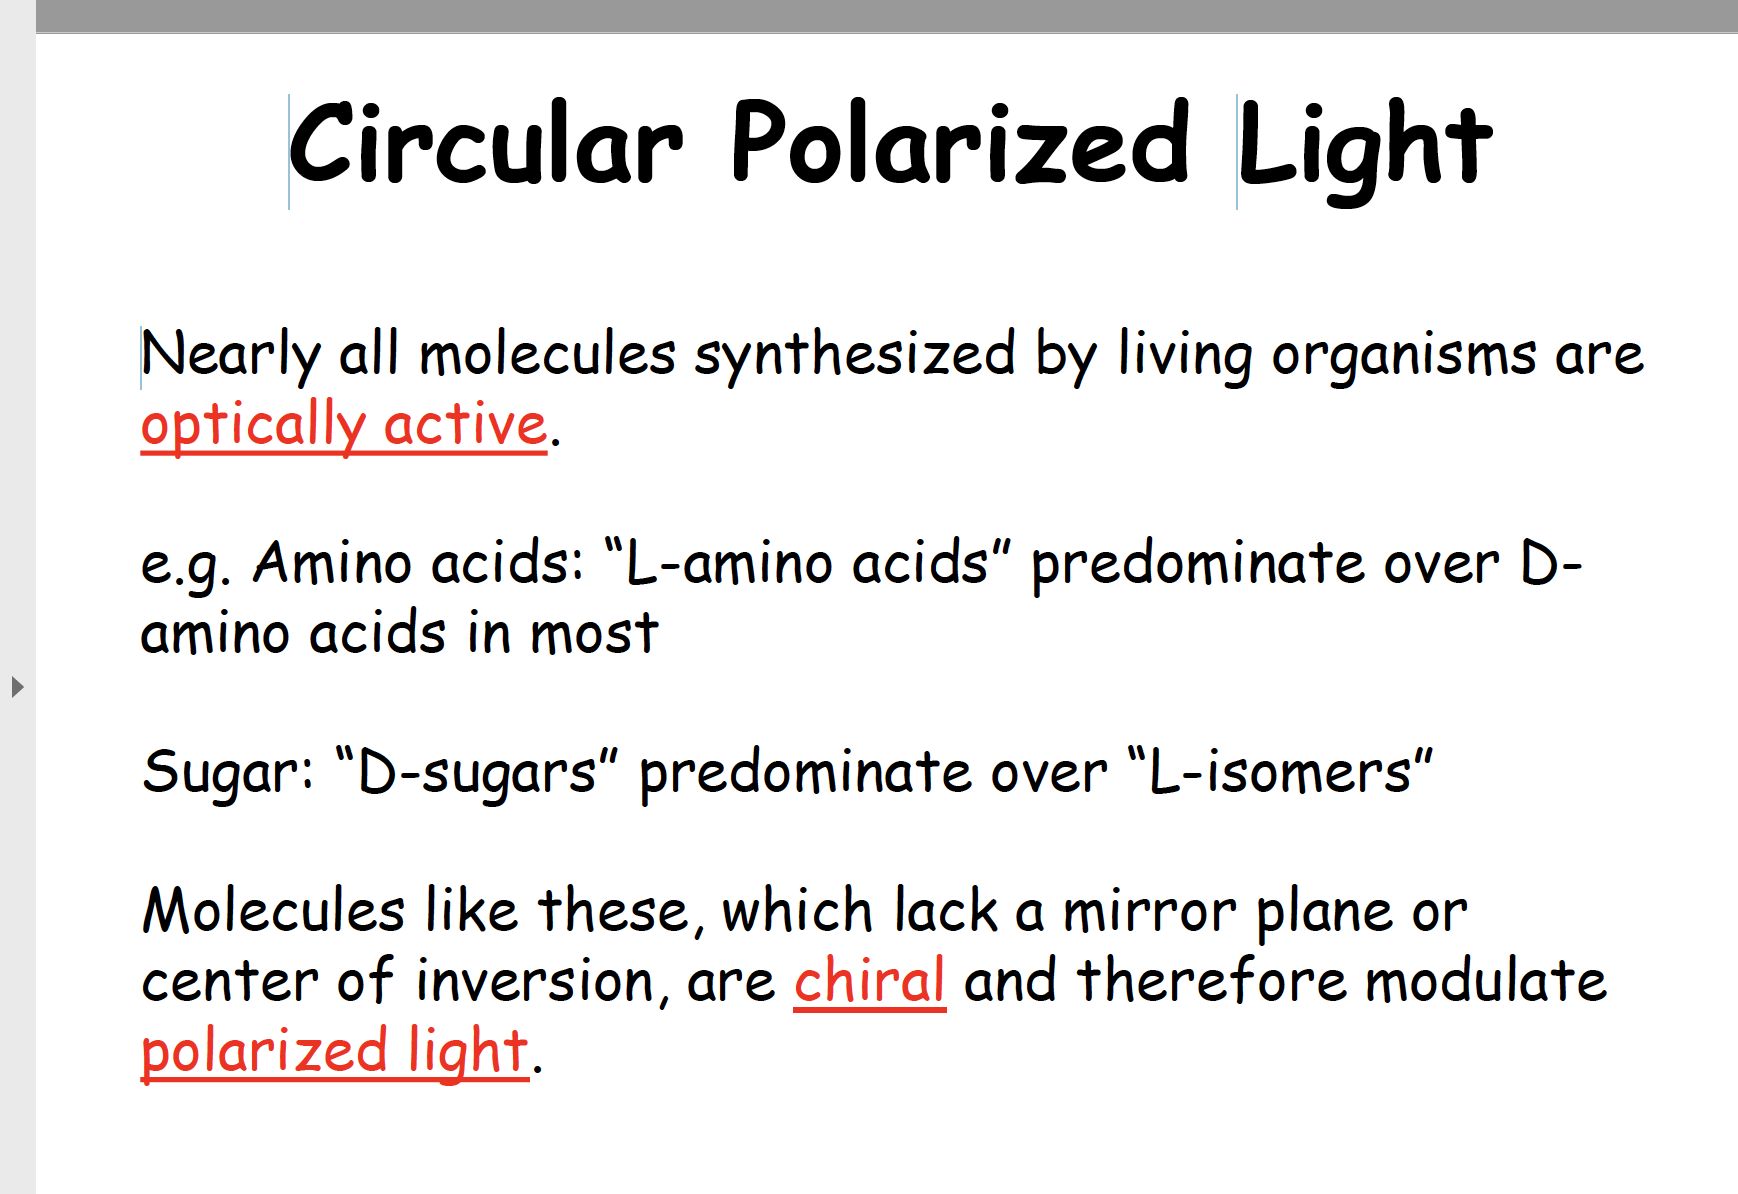
Circular Polarized Light
Nearly all molecules synthesized by living organisms are optically active
Circular Polarized Light
Ellipticity
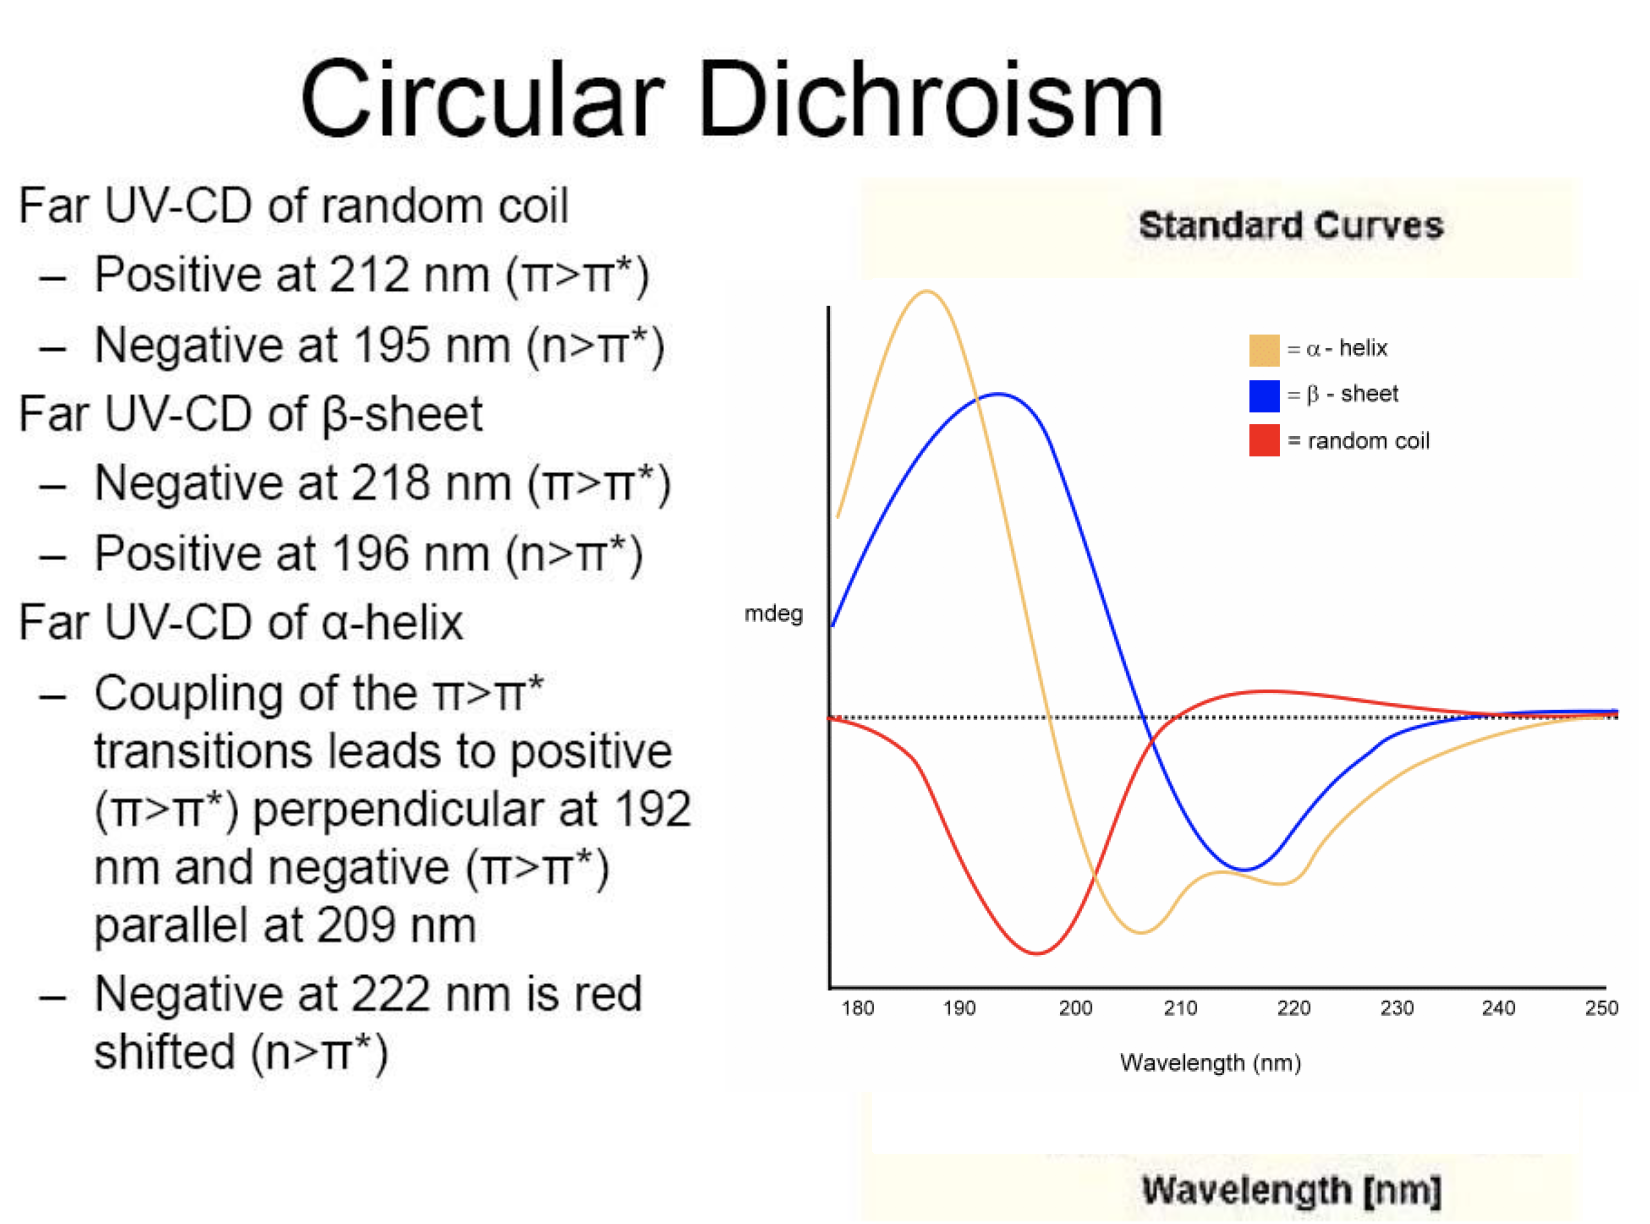
Plane polarized light is the sum of **left **and **right **circularly polarized light.
When plane polarized light passes through a solution containing an optically active substance the left and right circularly polarized components of the plane-polarized light are
absorbed by different amounts.When these components are recombined they appear as elliptically polarized light. The ellipticityis defined as Q, the angle of polarization and is measured in degrees, (deg) or millidegrees, (mdeg).
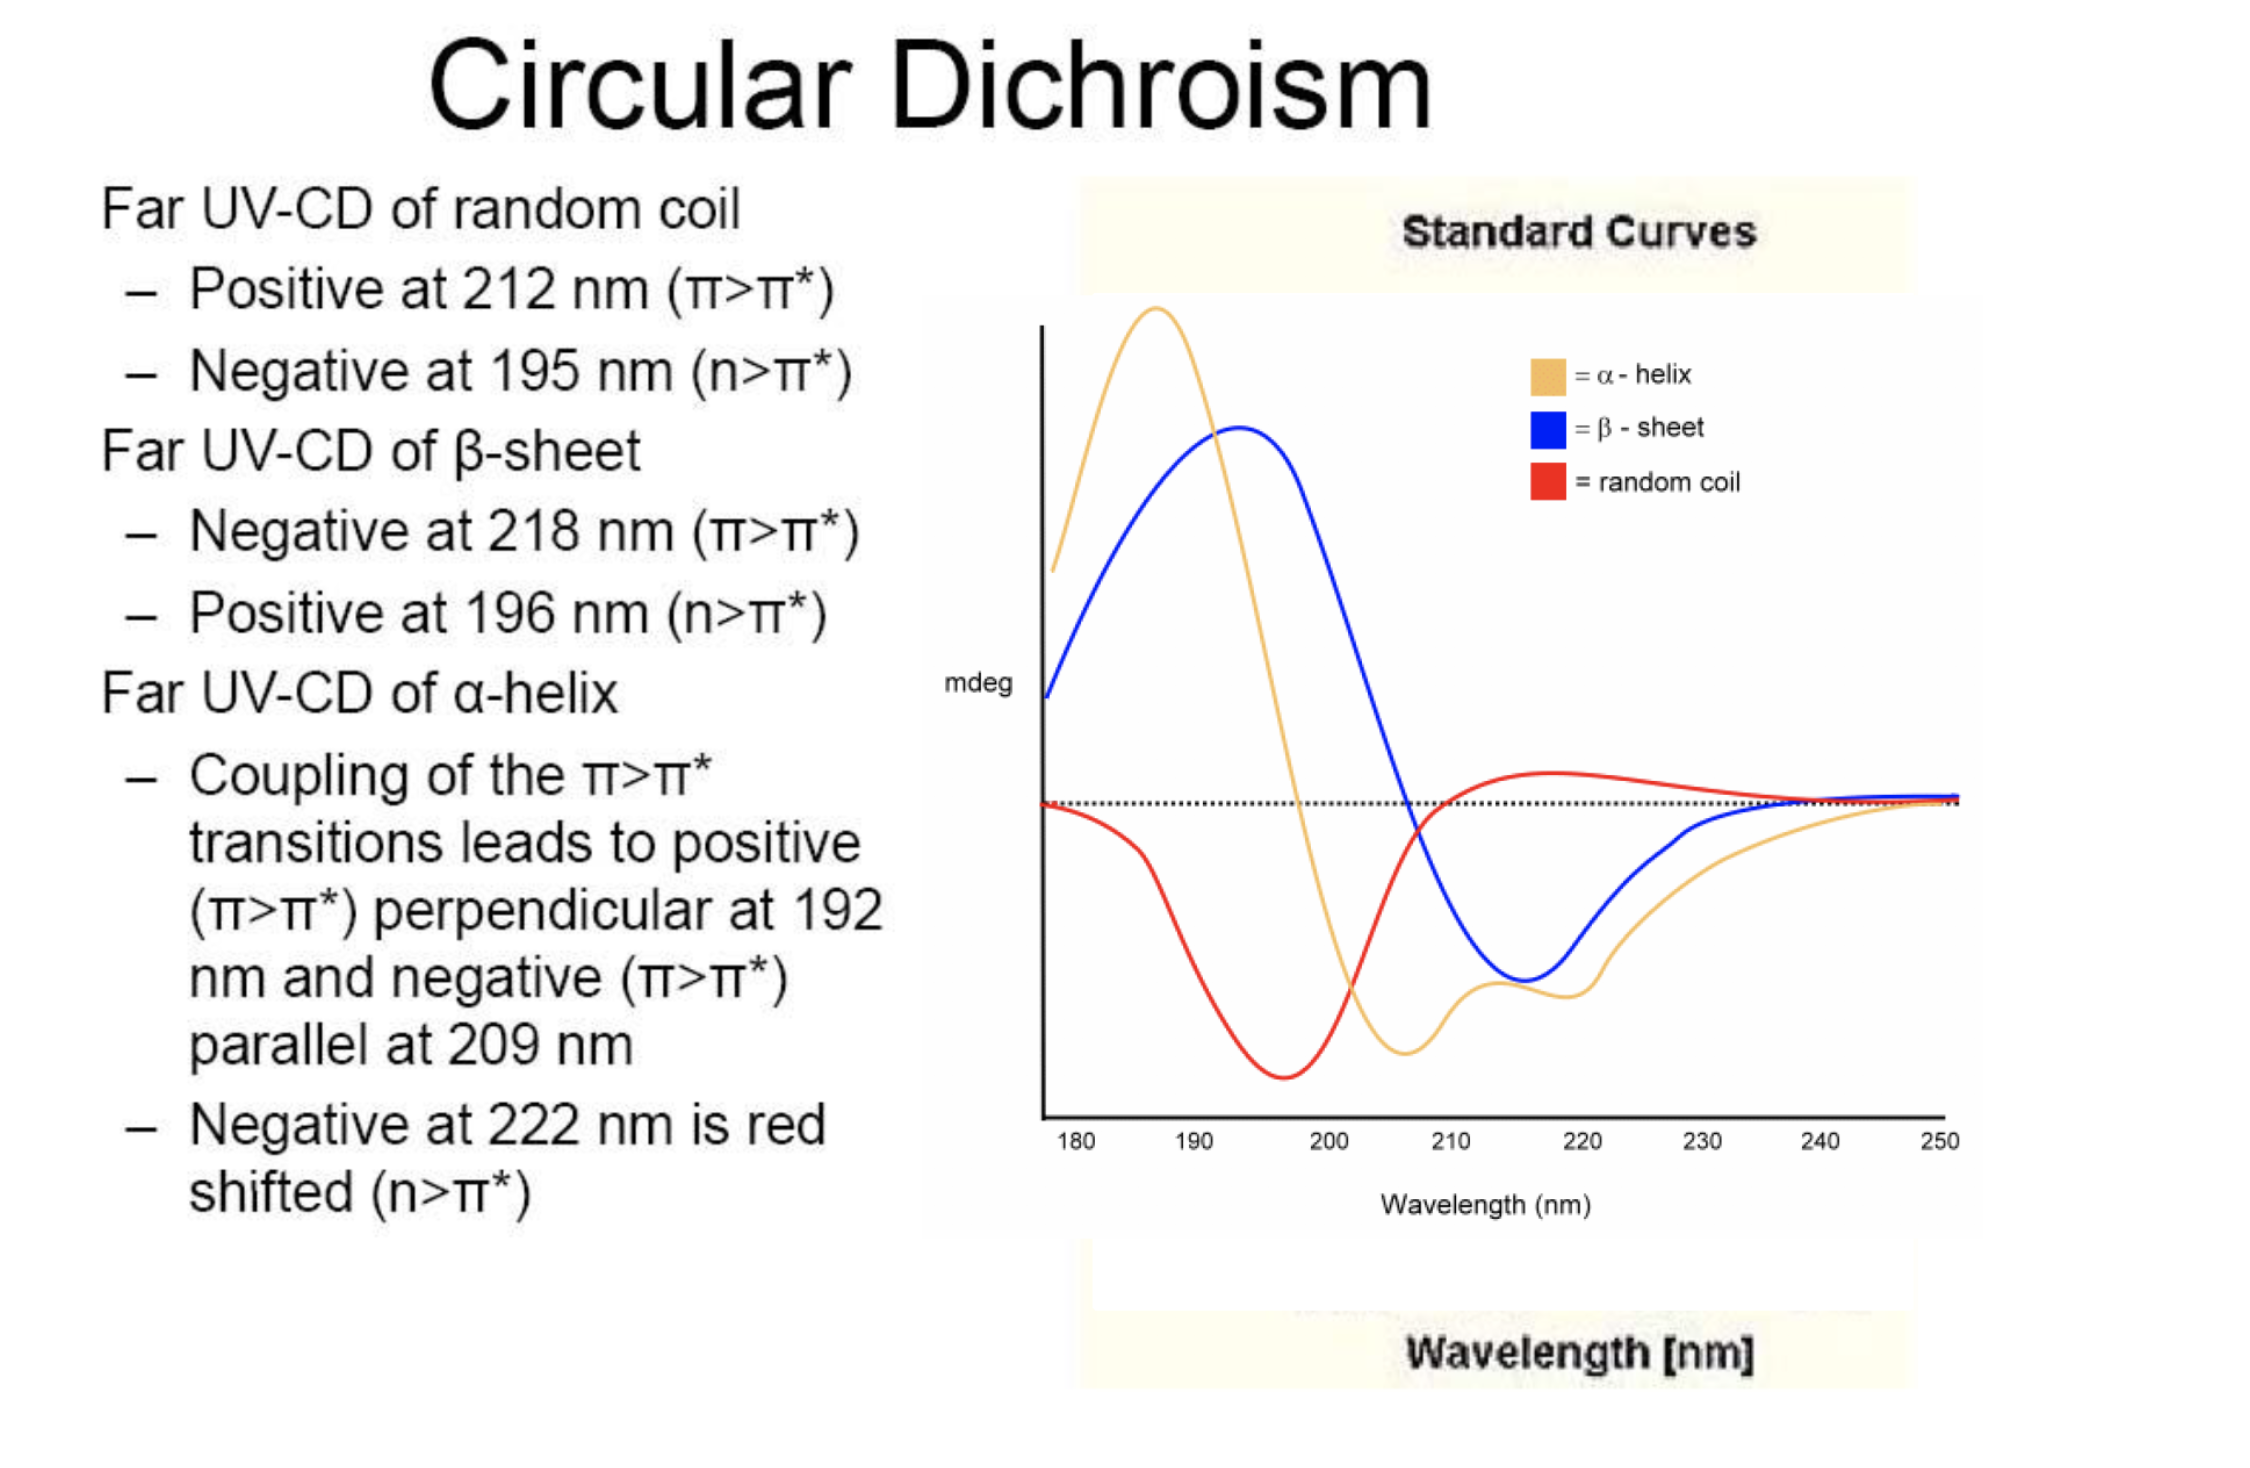
CD signal of proteins
Standard curves
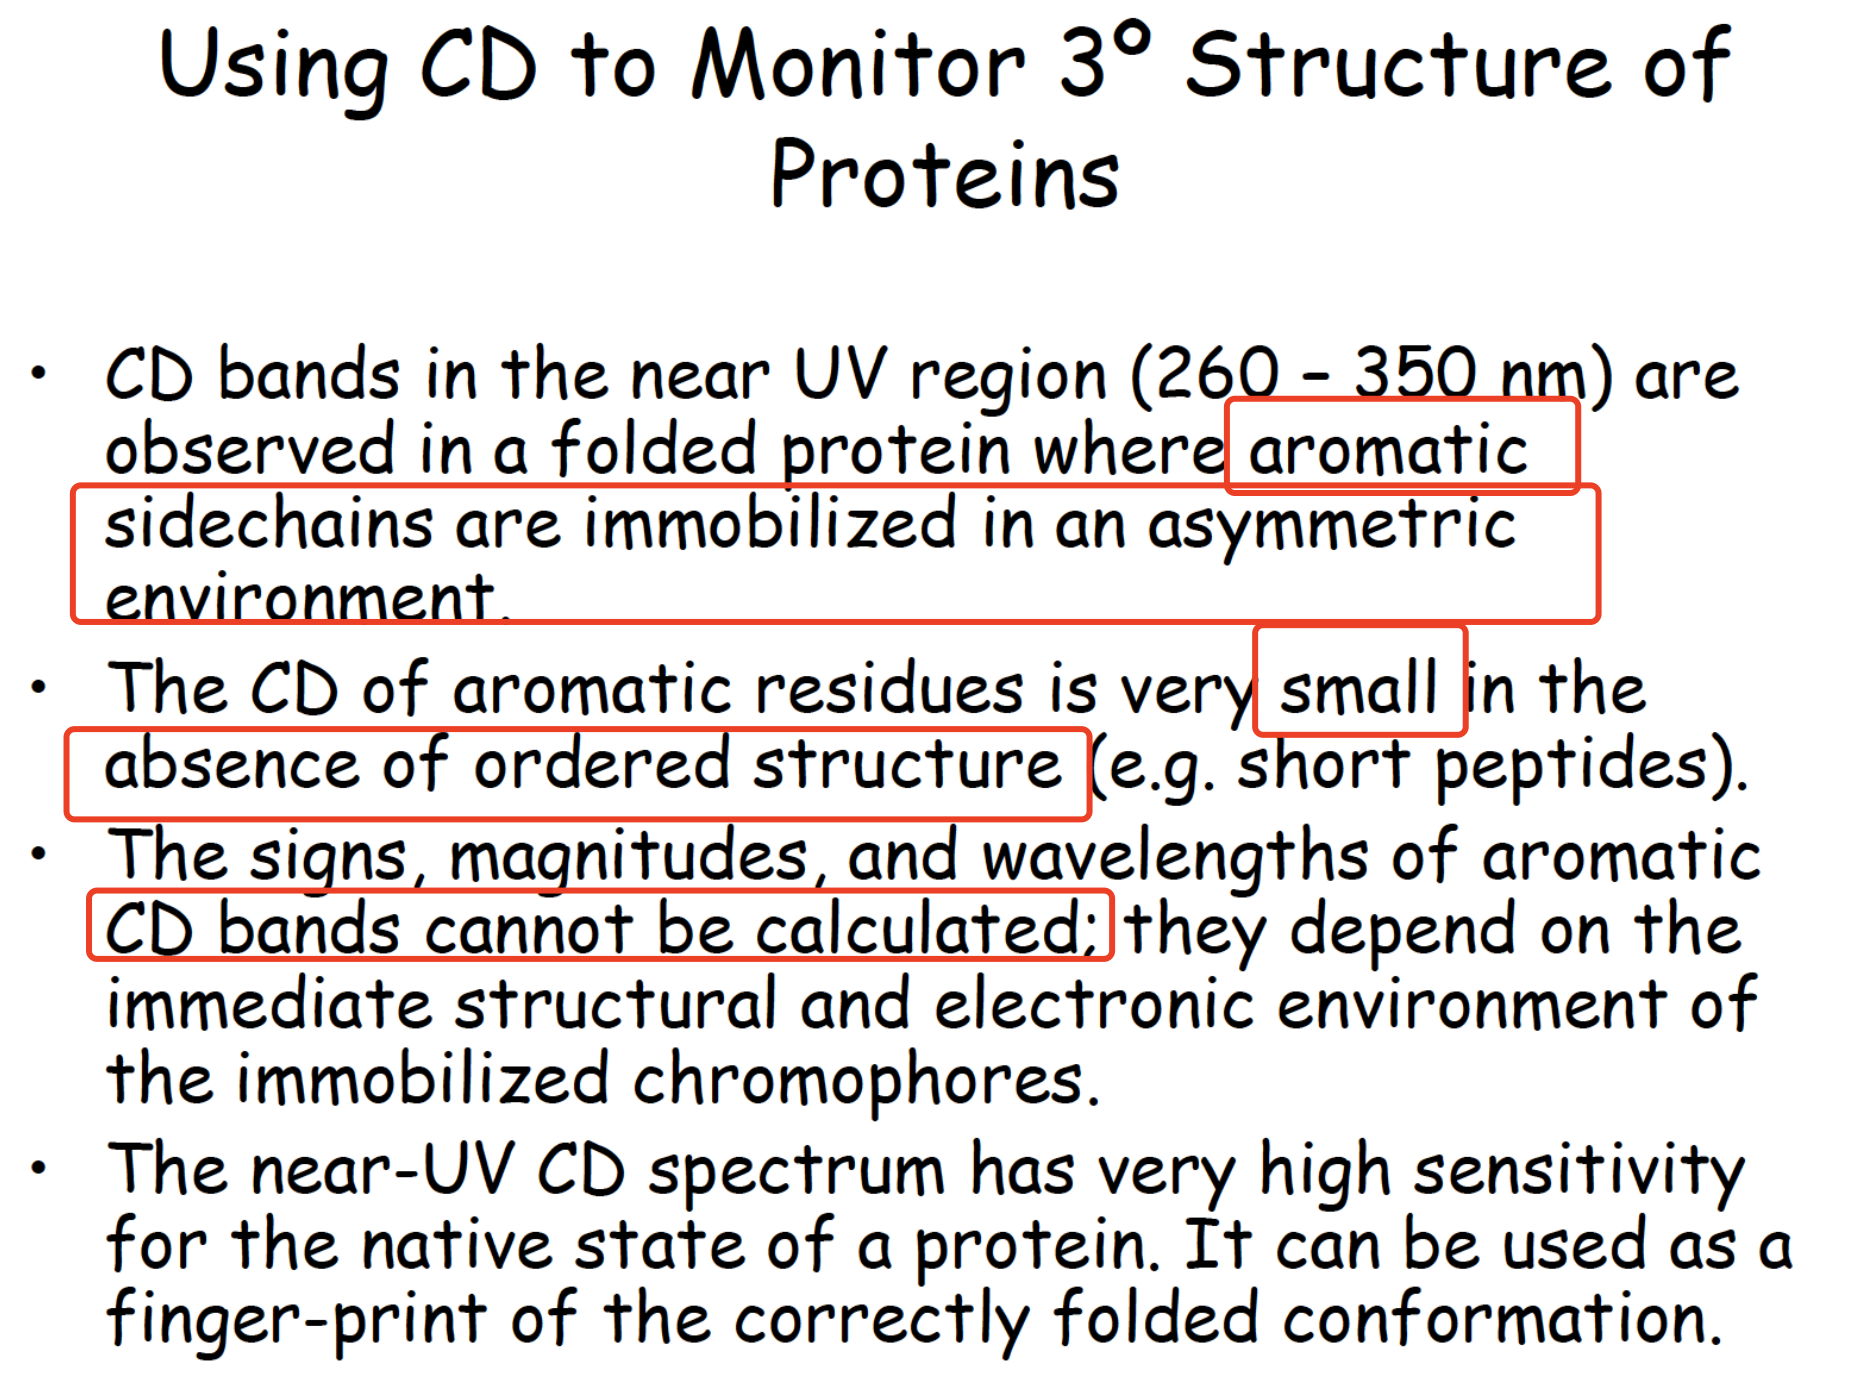
Using CD to Monitor tertiary structure
Summary of CD
Demo in the class
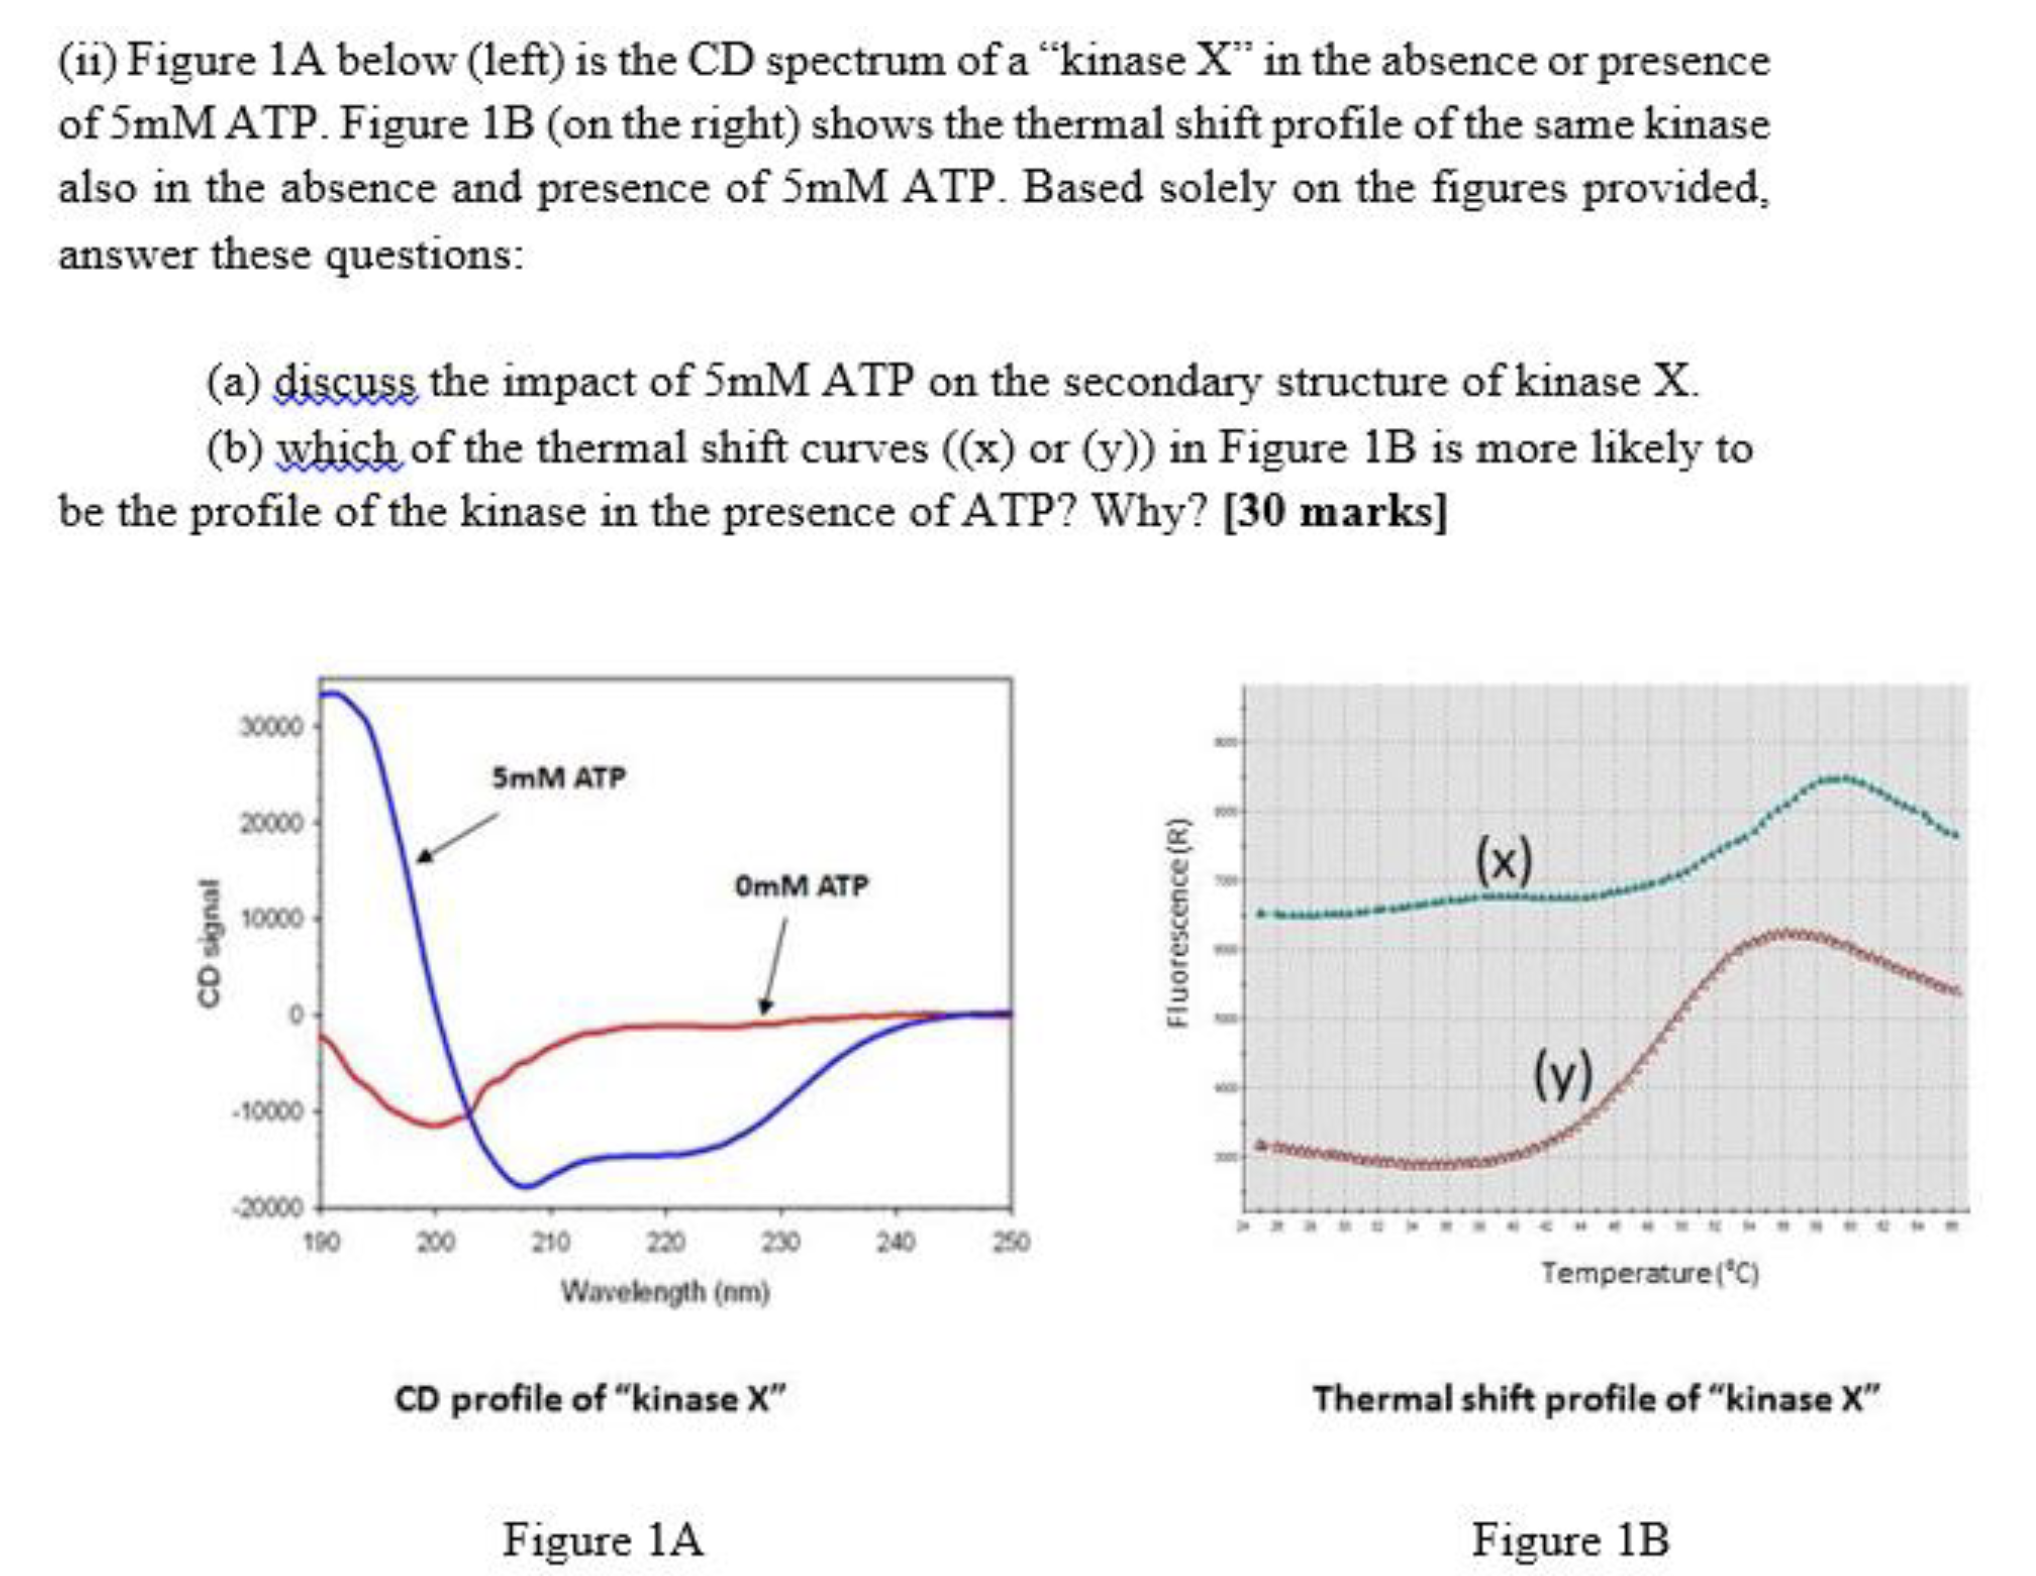
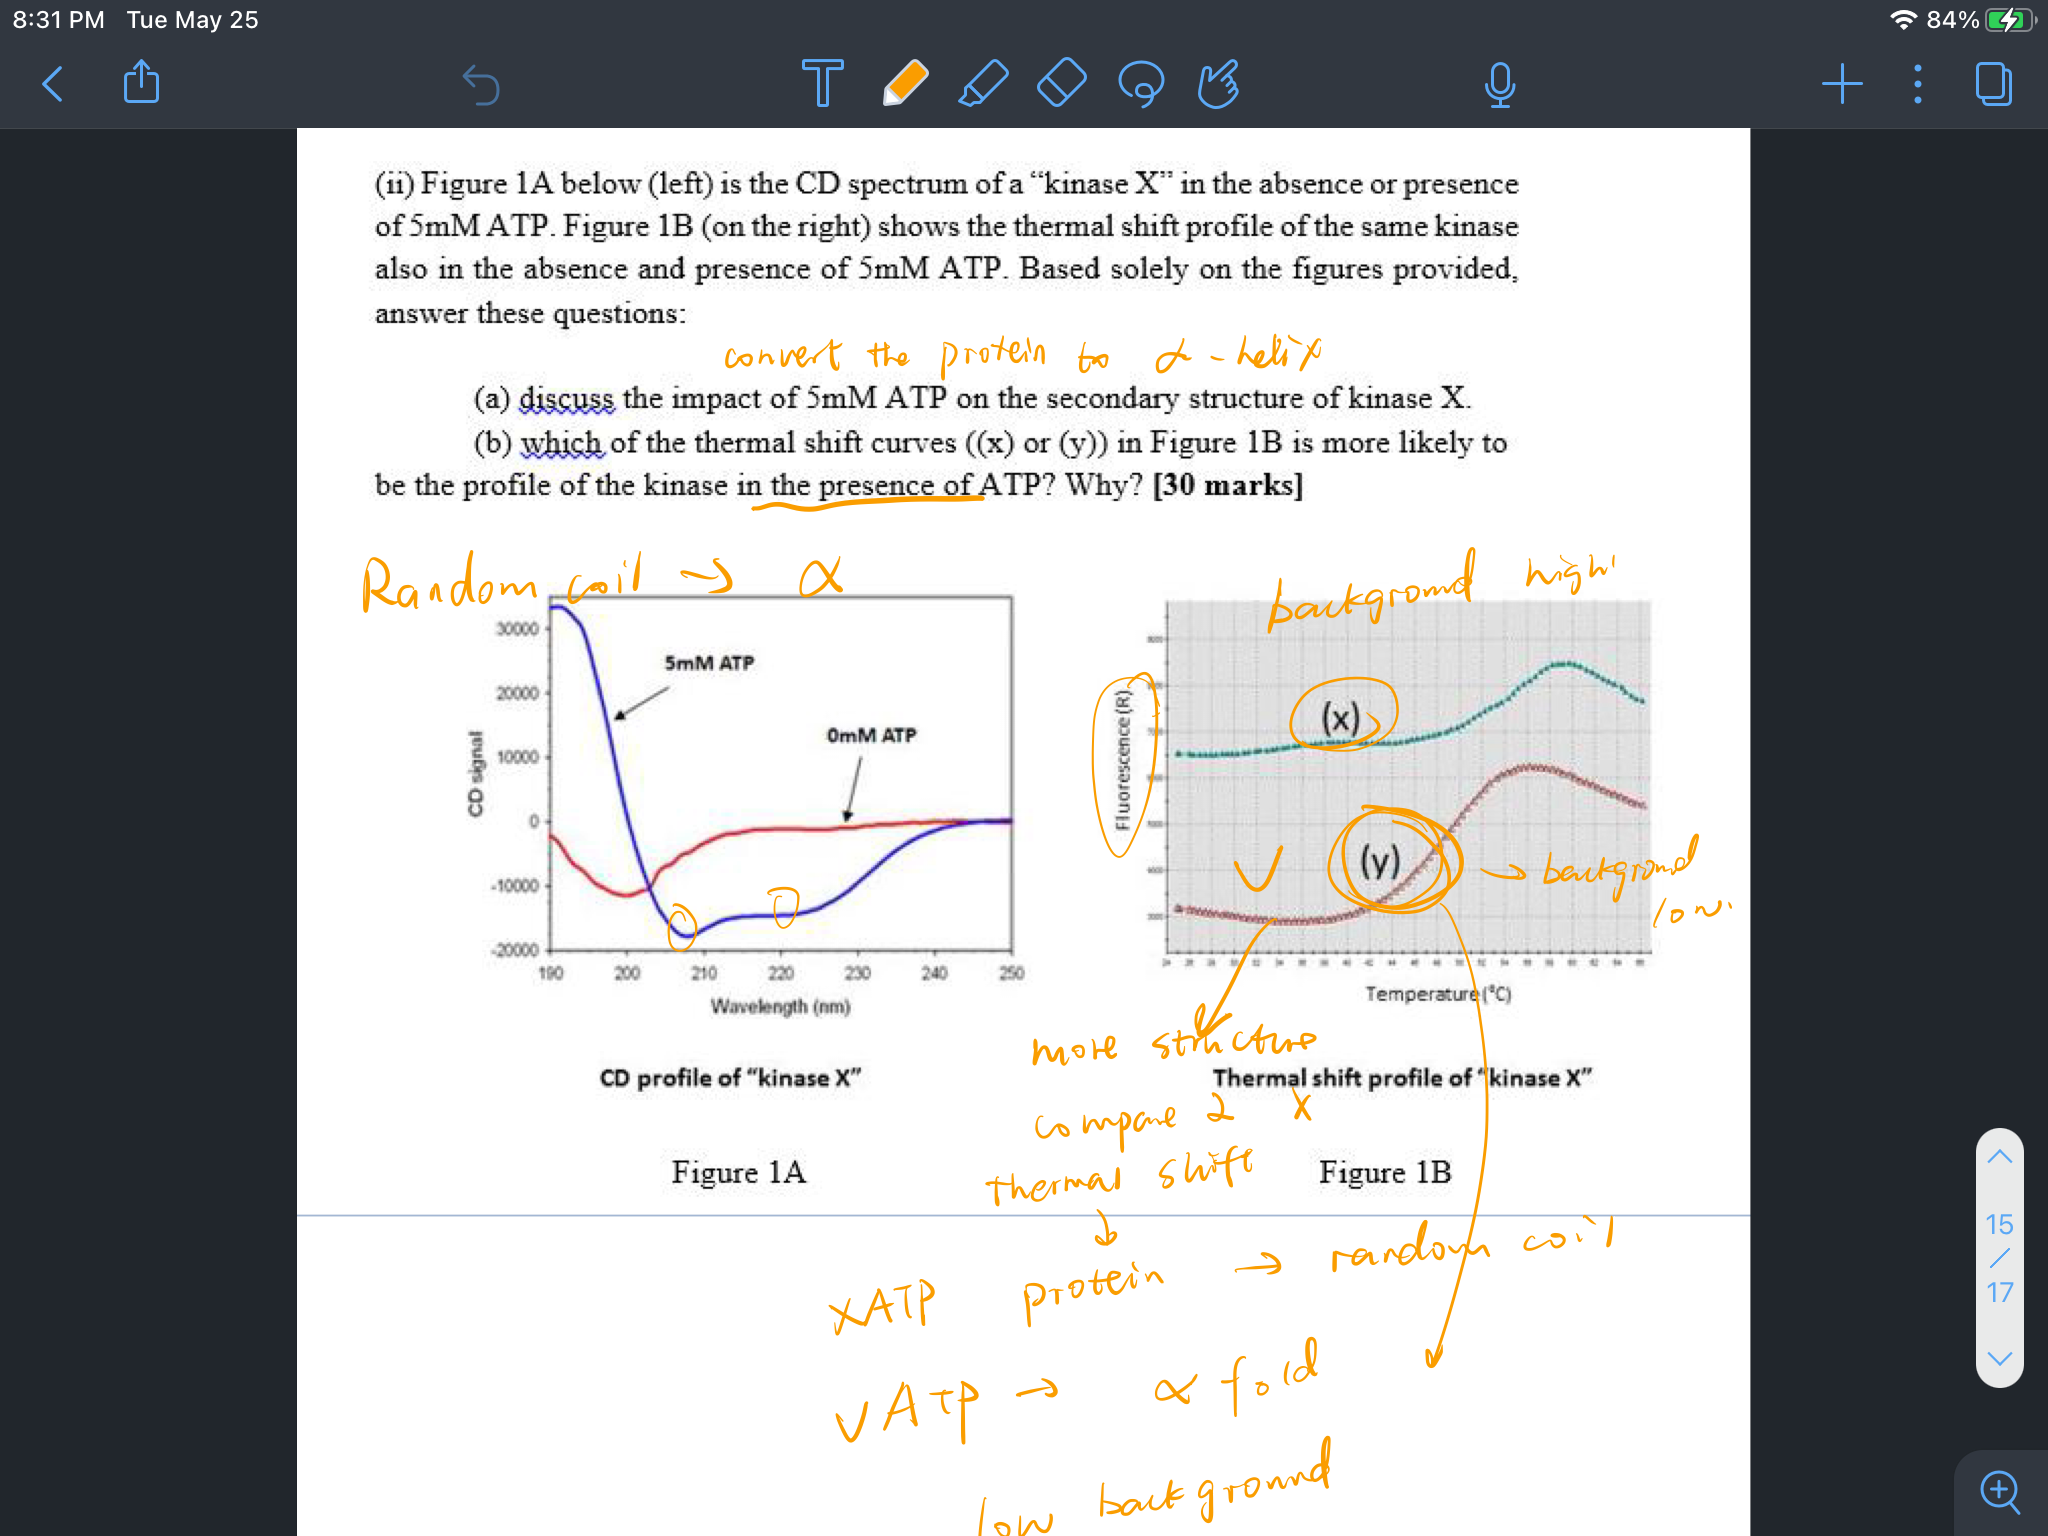
A:
B: y has more structure compared to x since absence of ATP, the kinase is a random coil and with the inclusion of ATP, protein turn to a secondary structure.
x: background high
Lecture 16 Modelling
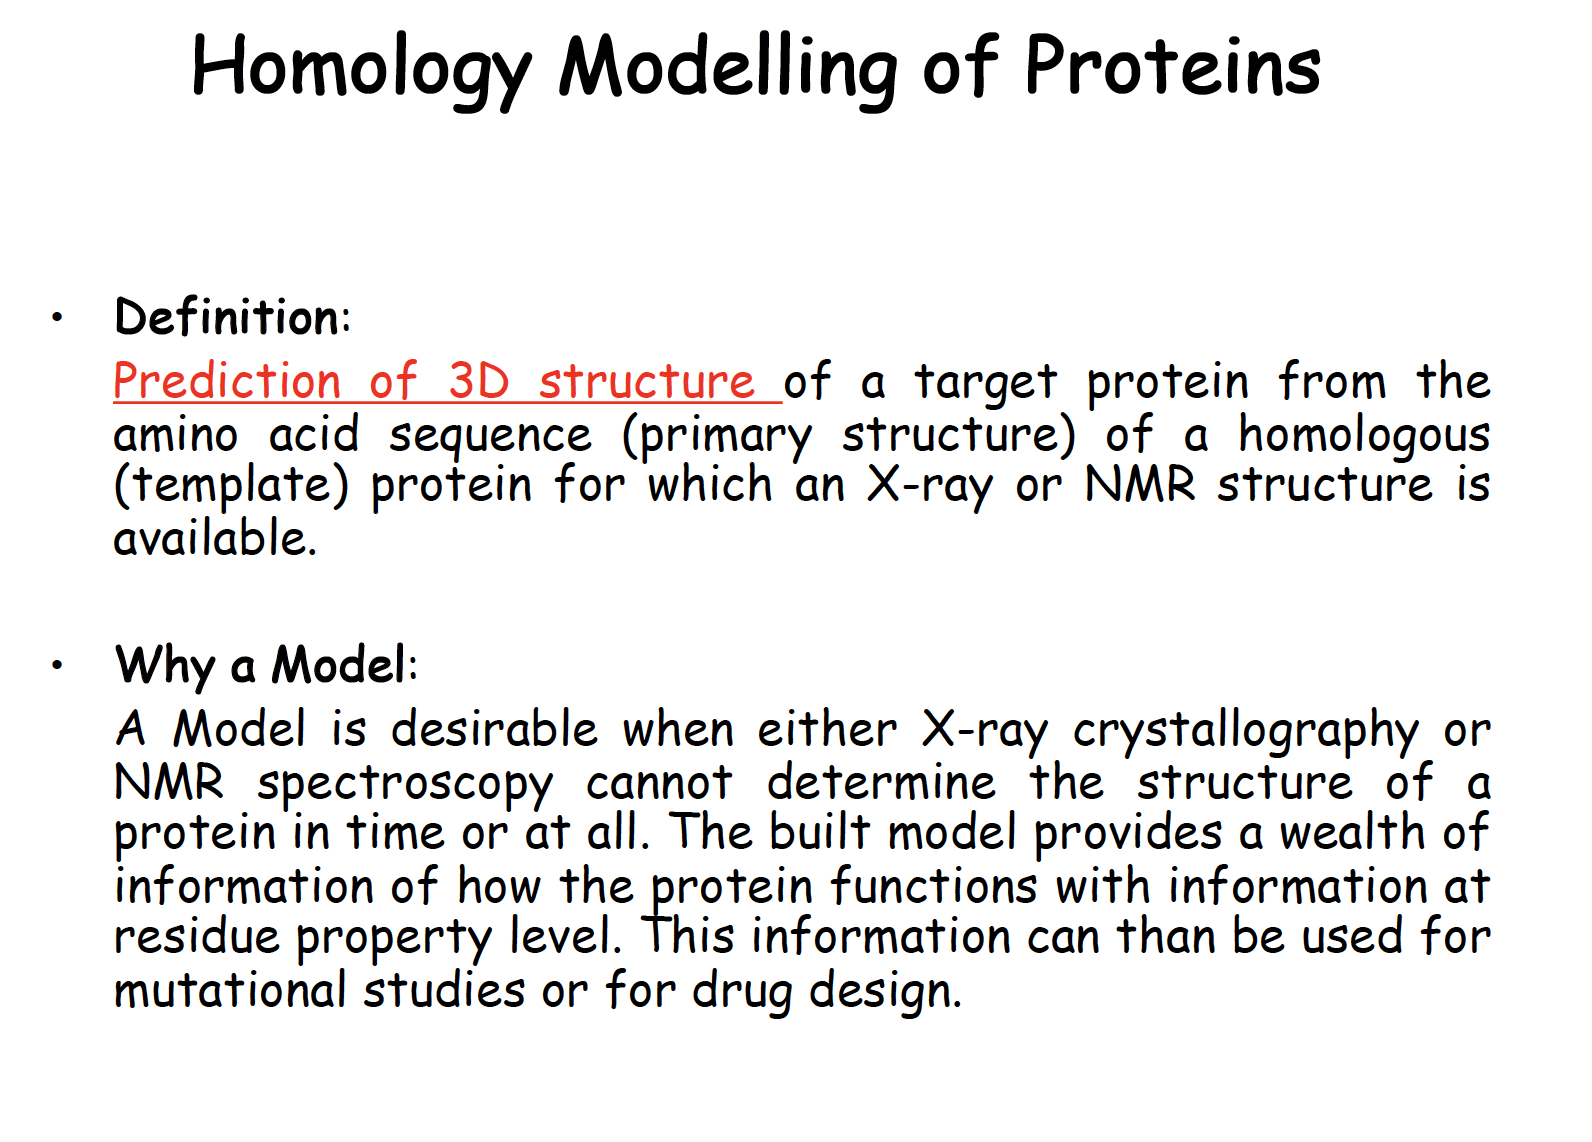
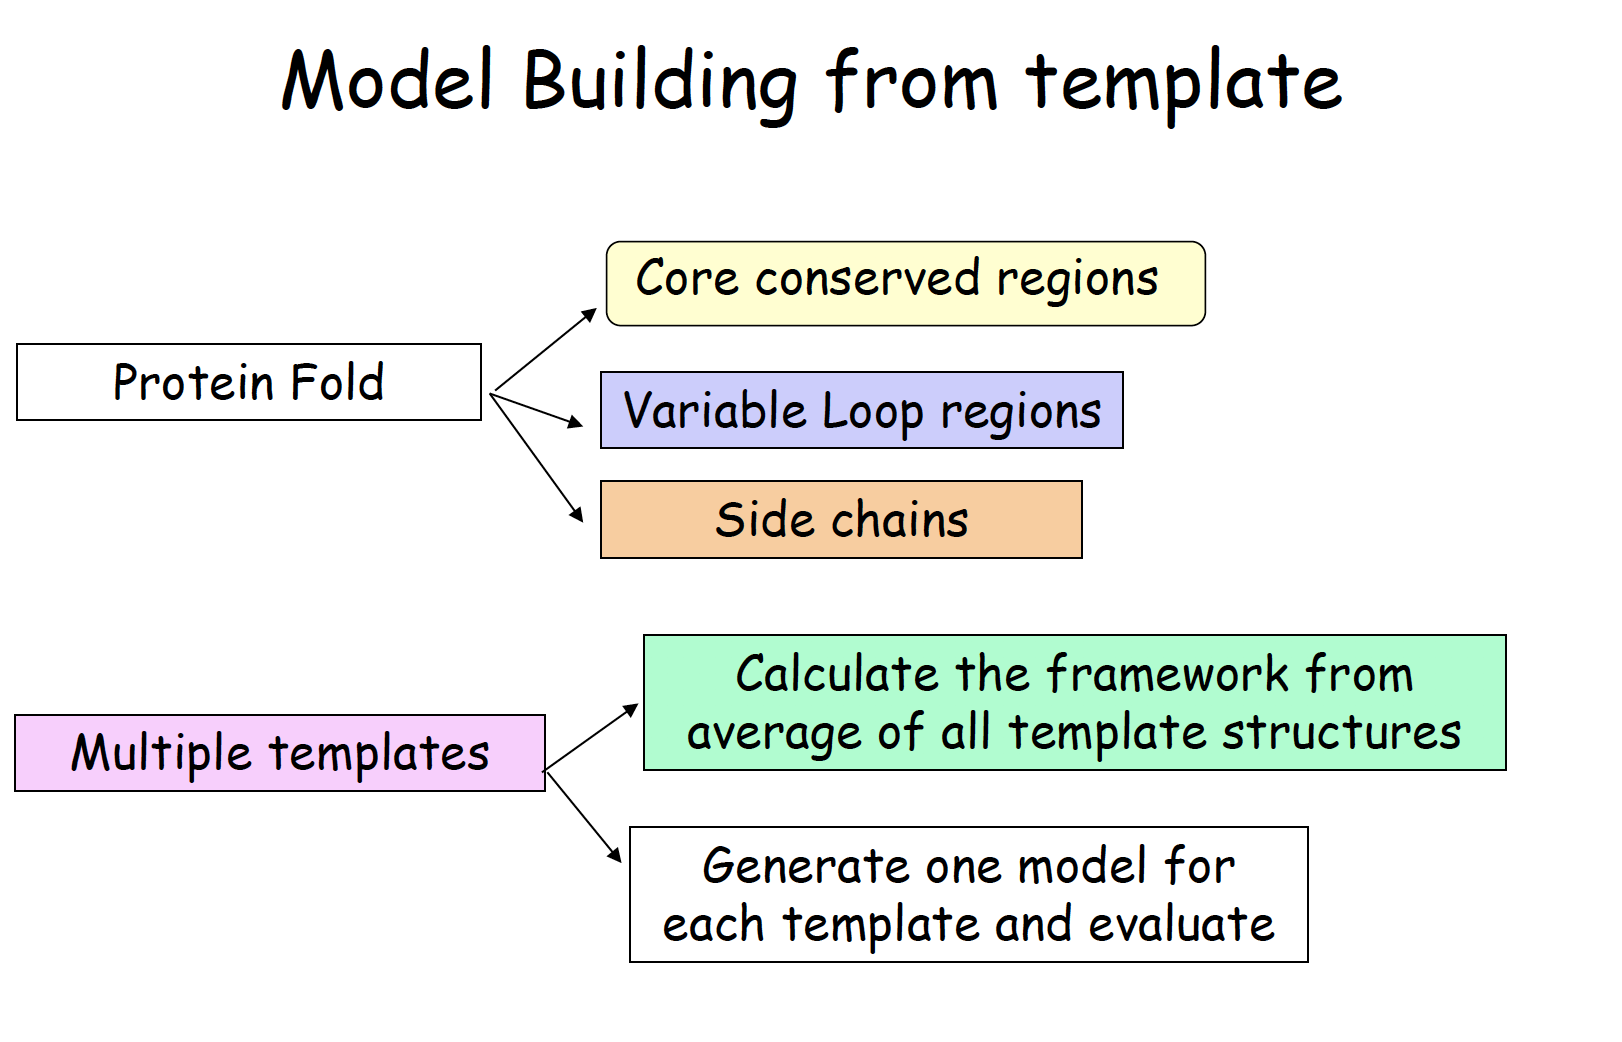
Homology Modelling of Proteins
Lecture 17 ITC
Isothermal Titration Calorimetry
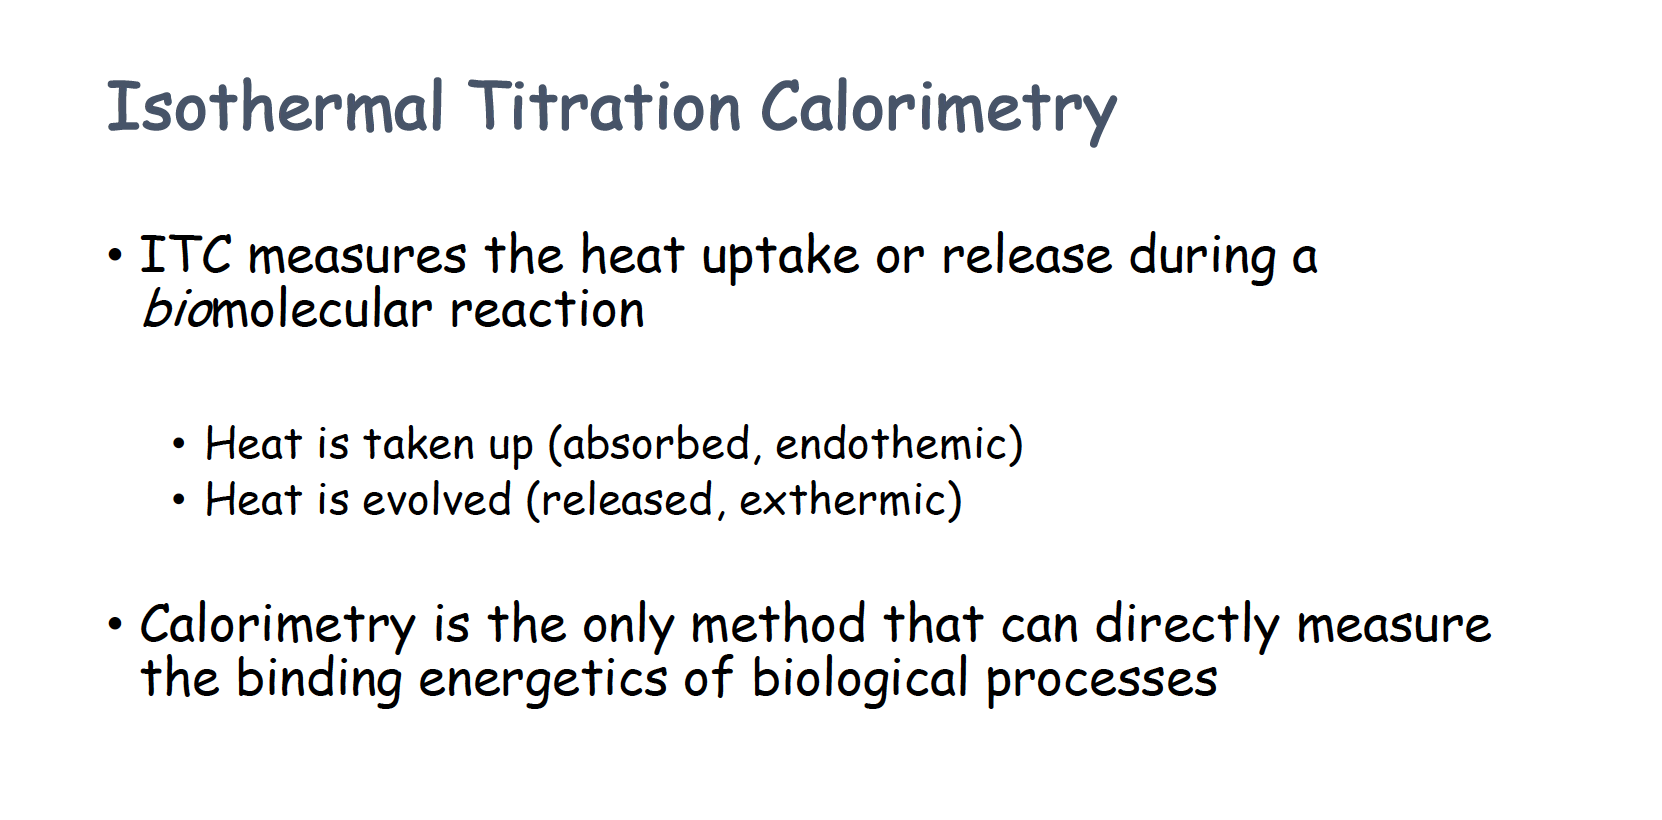
What is ITC
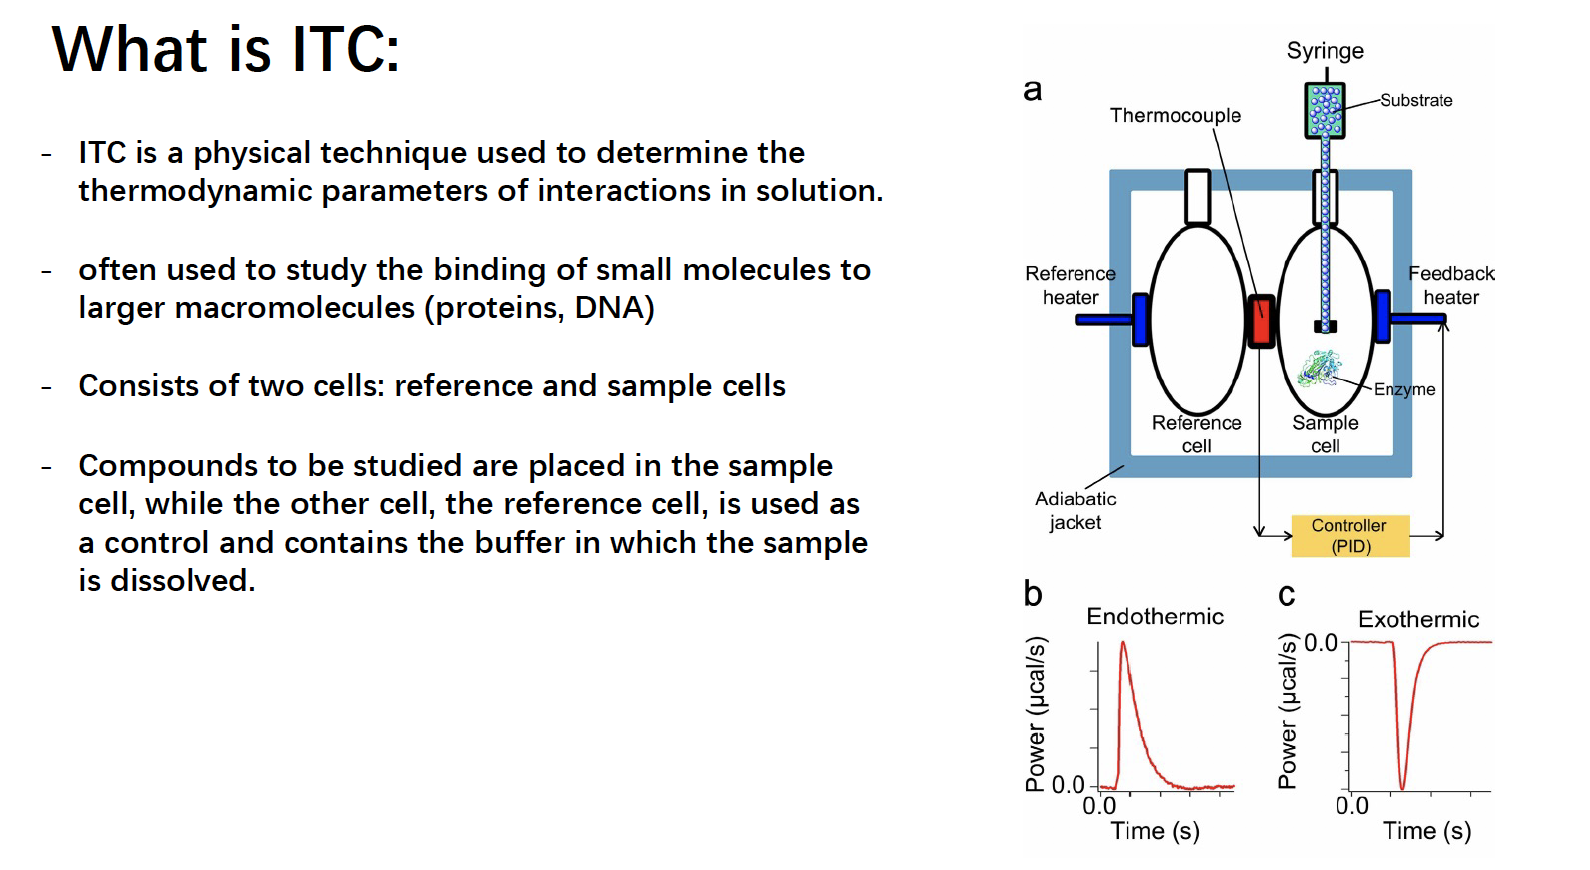
- ITC could quantify the number of protein (molarity and number)
Kb tell how tight the protein bind
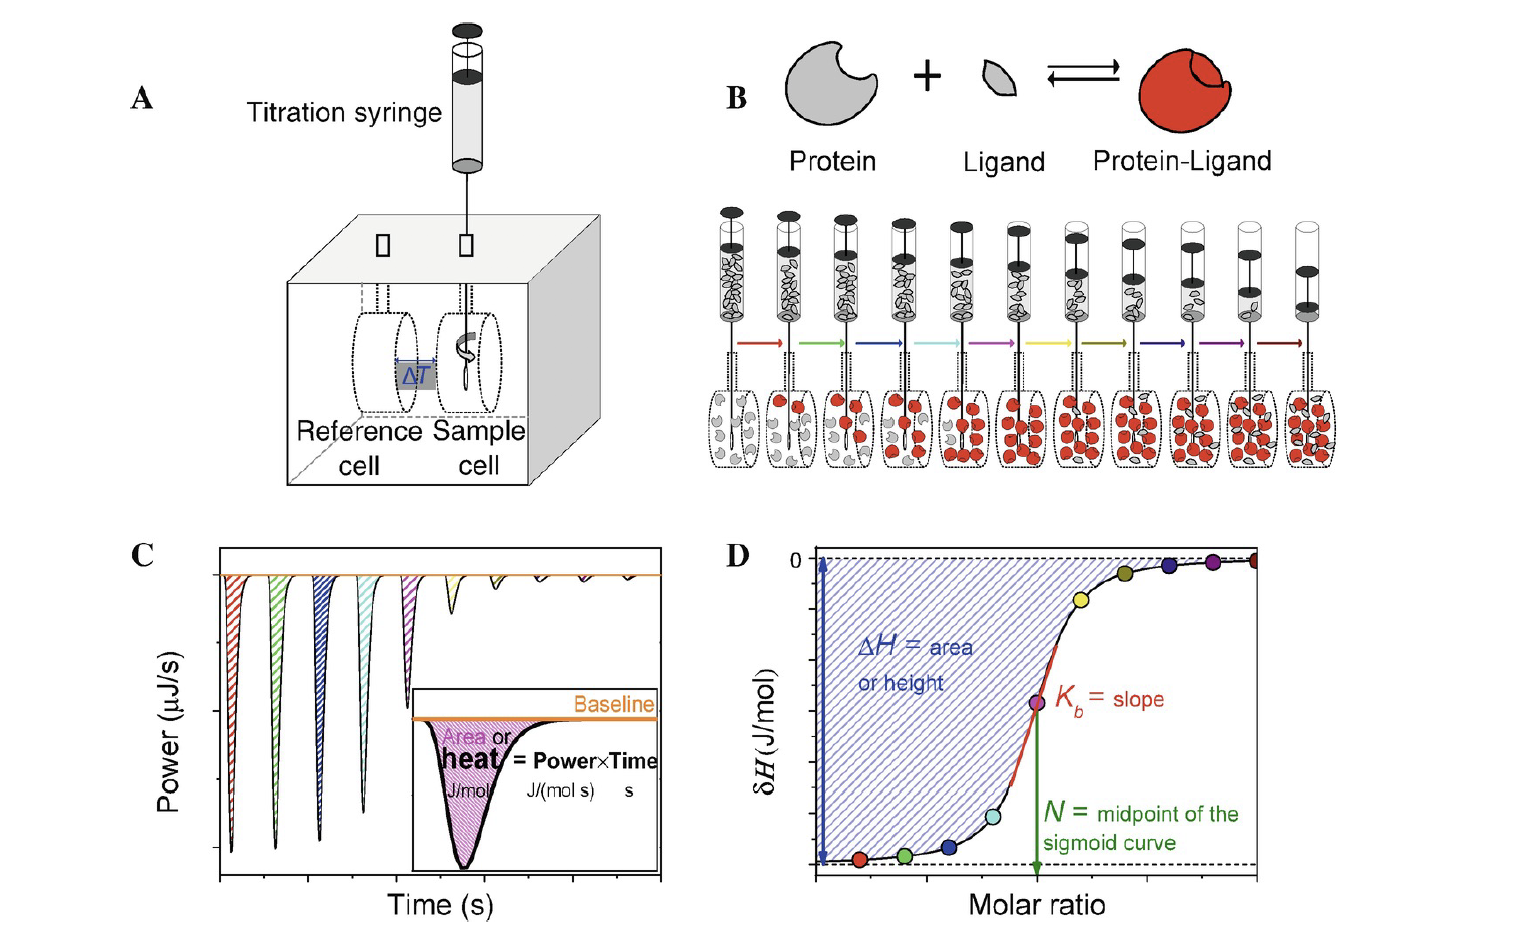
ITC “thermogram”: Thermodynamic measurements
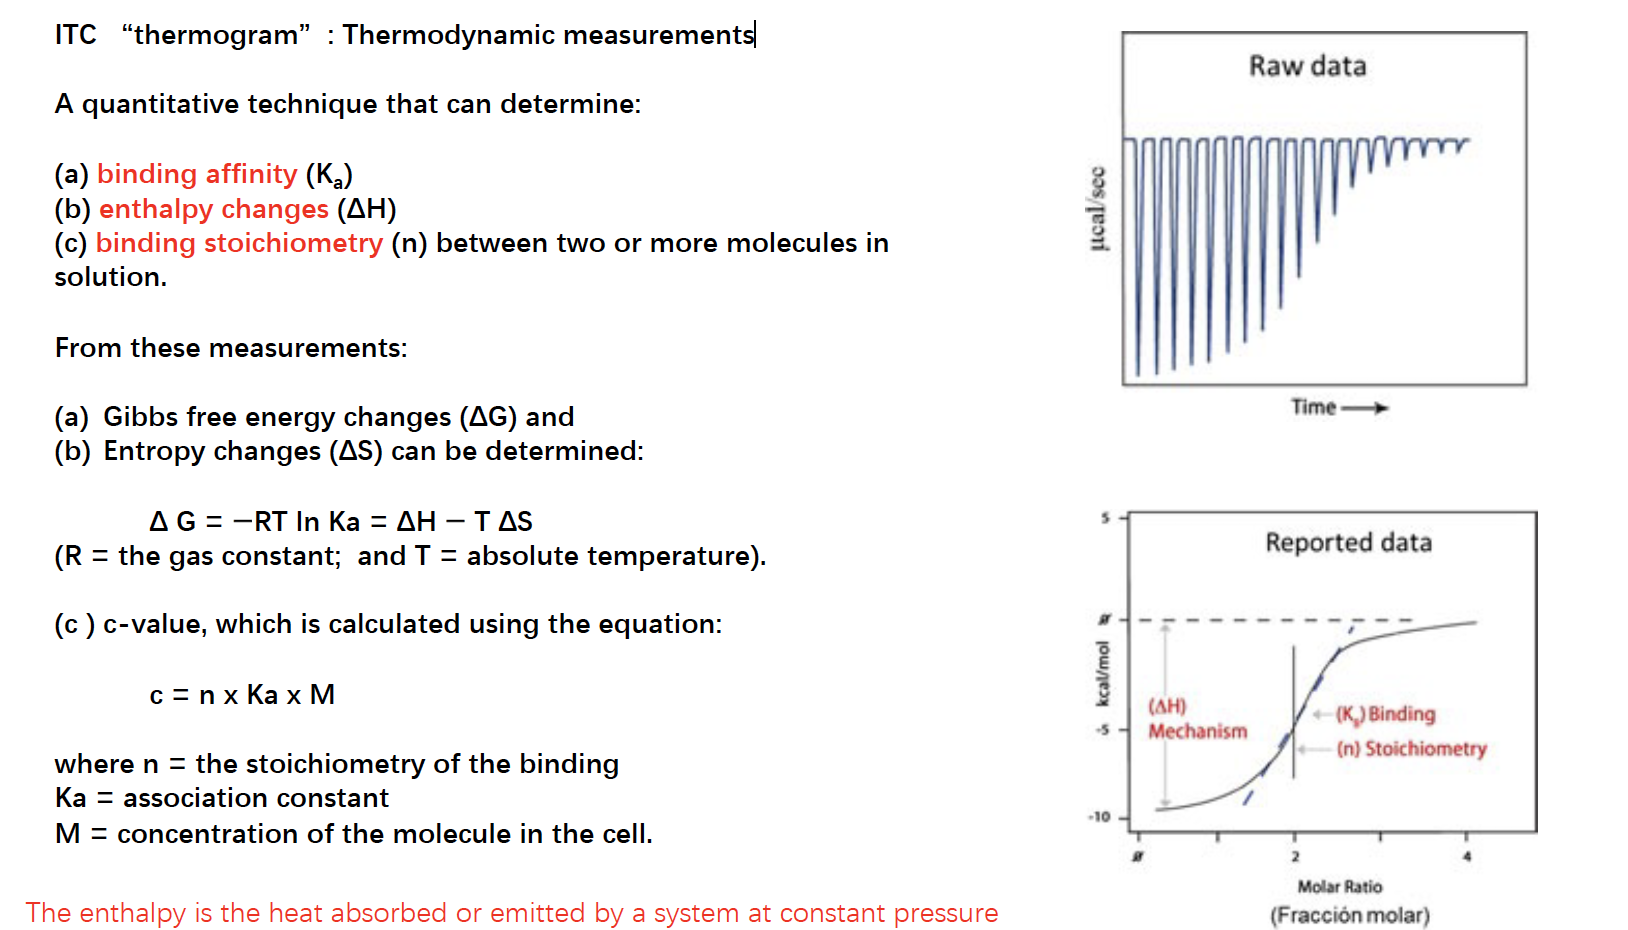
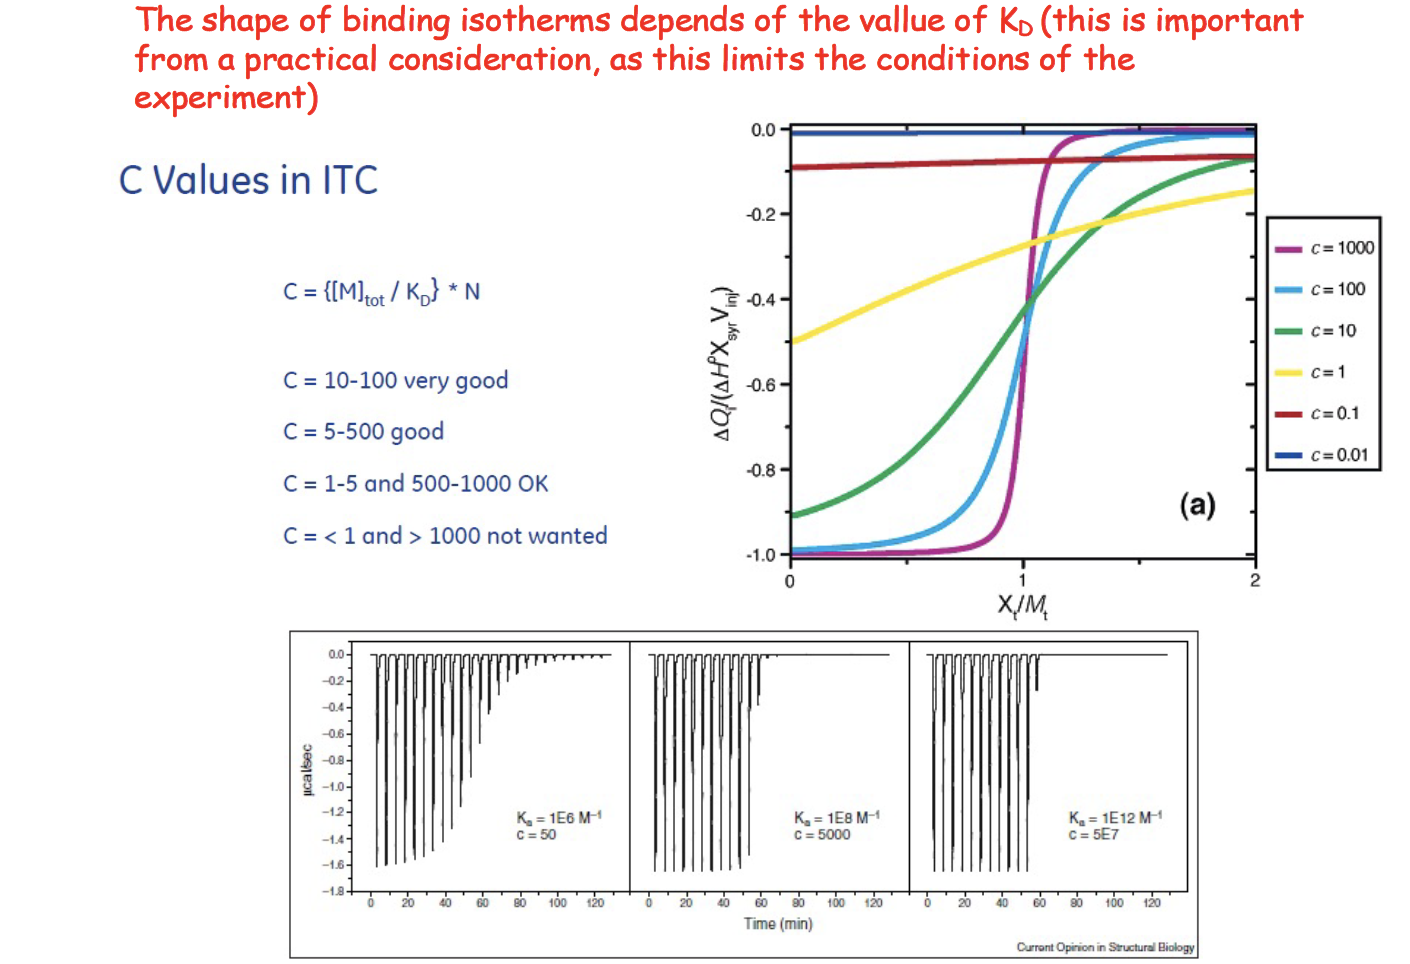
C-value
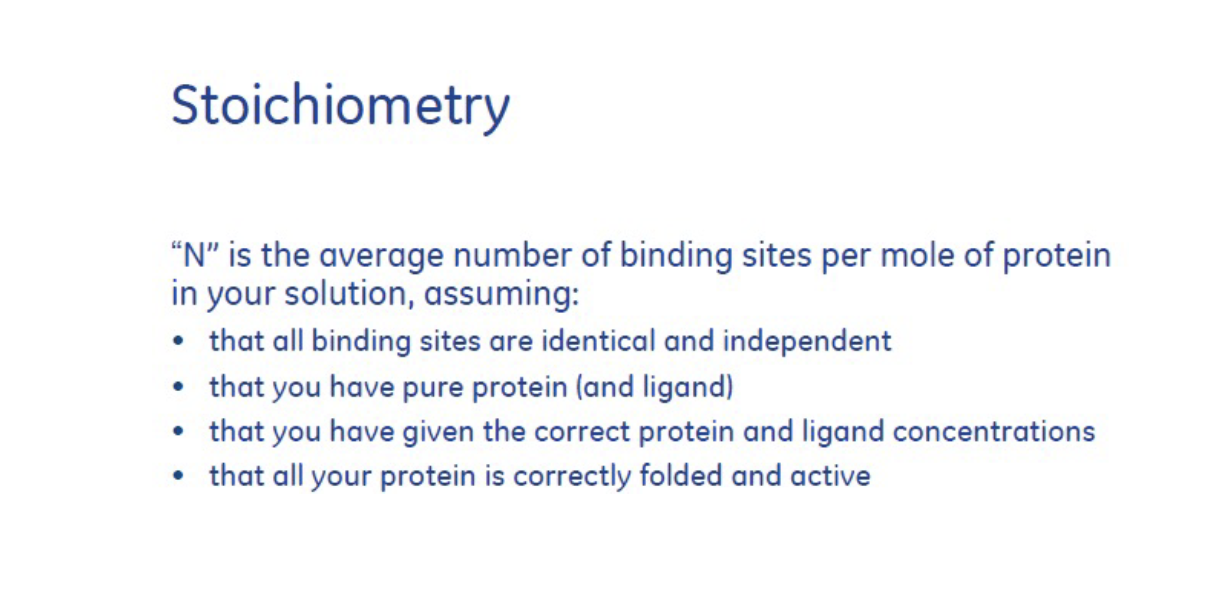
Stoichiometry
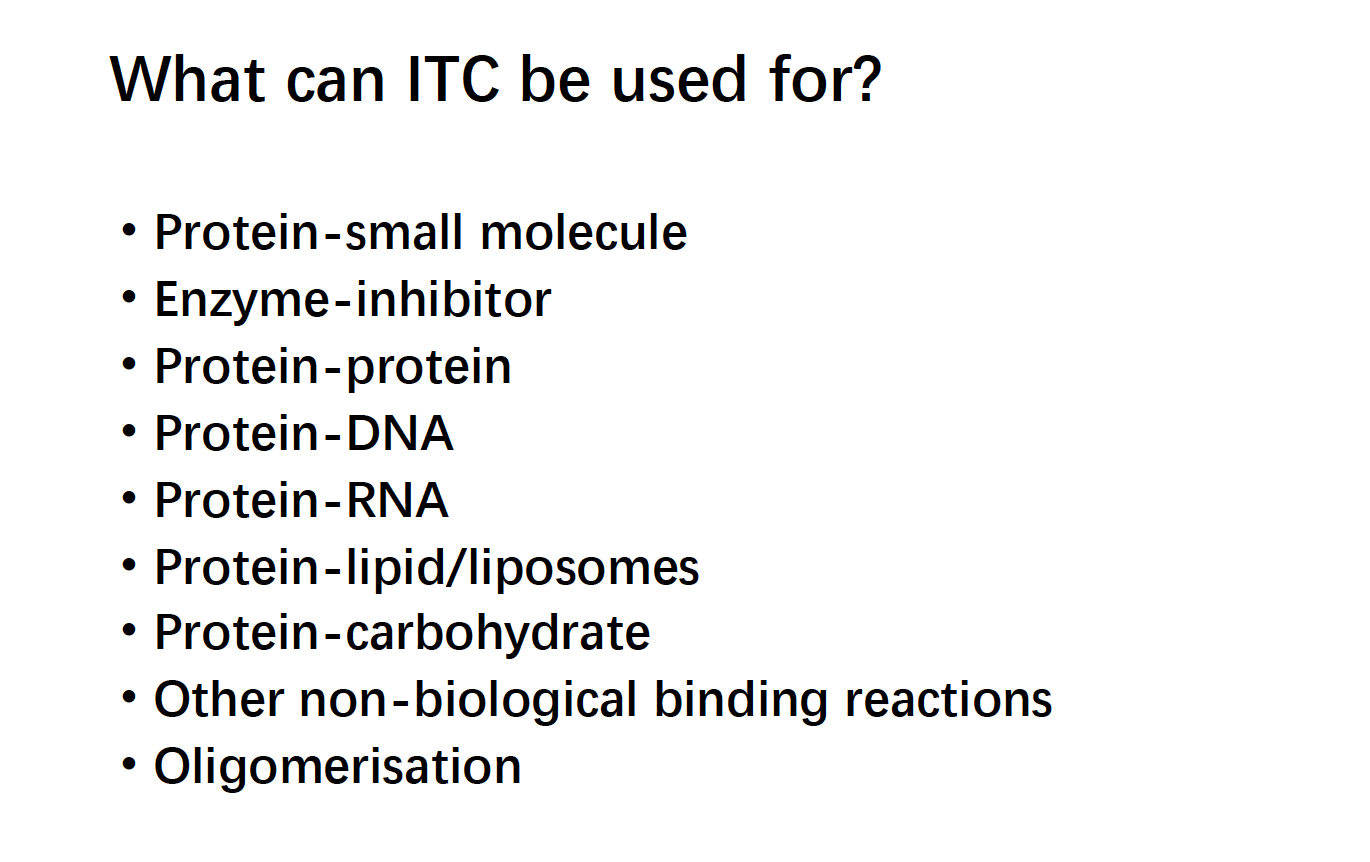
ITC be used for
ITC compared with SPR:
- bind molecular, do not consider the steric hinderance (no such problem)
- Direct information (1 to 1) while SPR is not direct
- Can be reused; recover your protein in a cheaper way
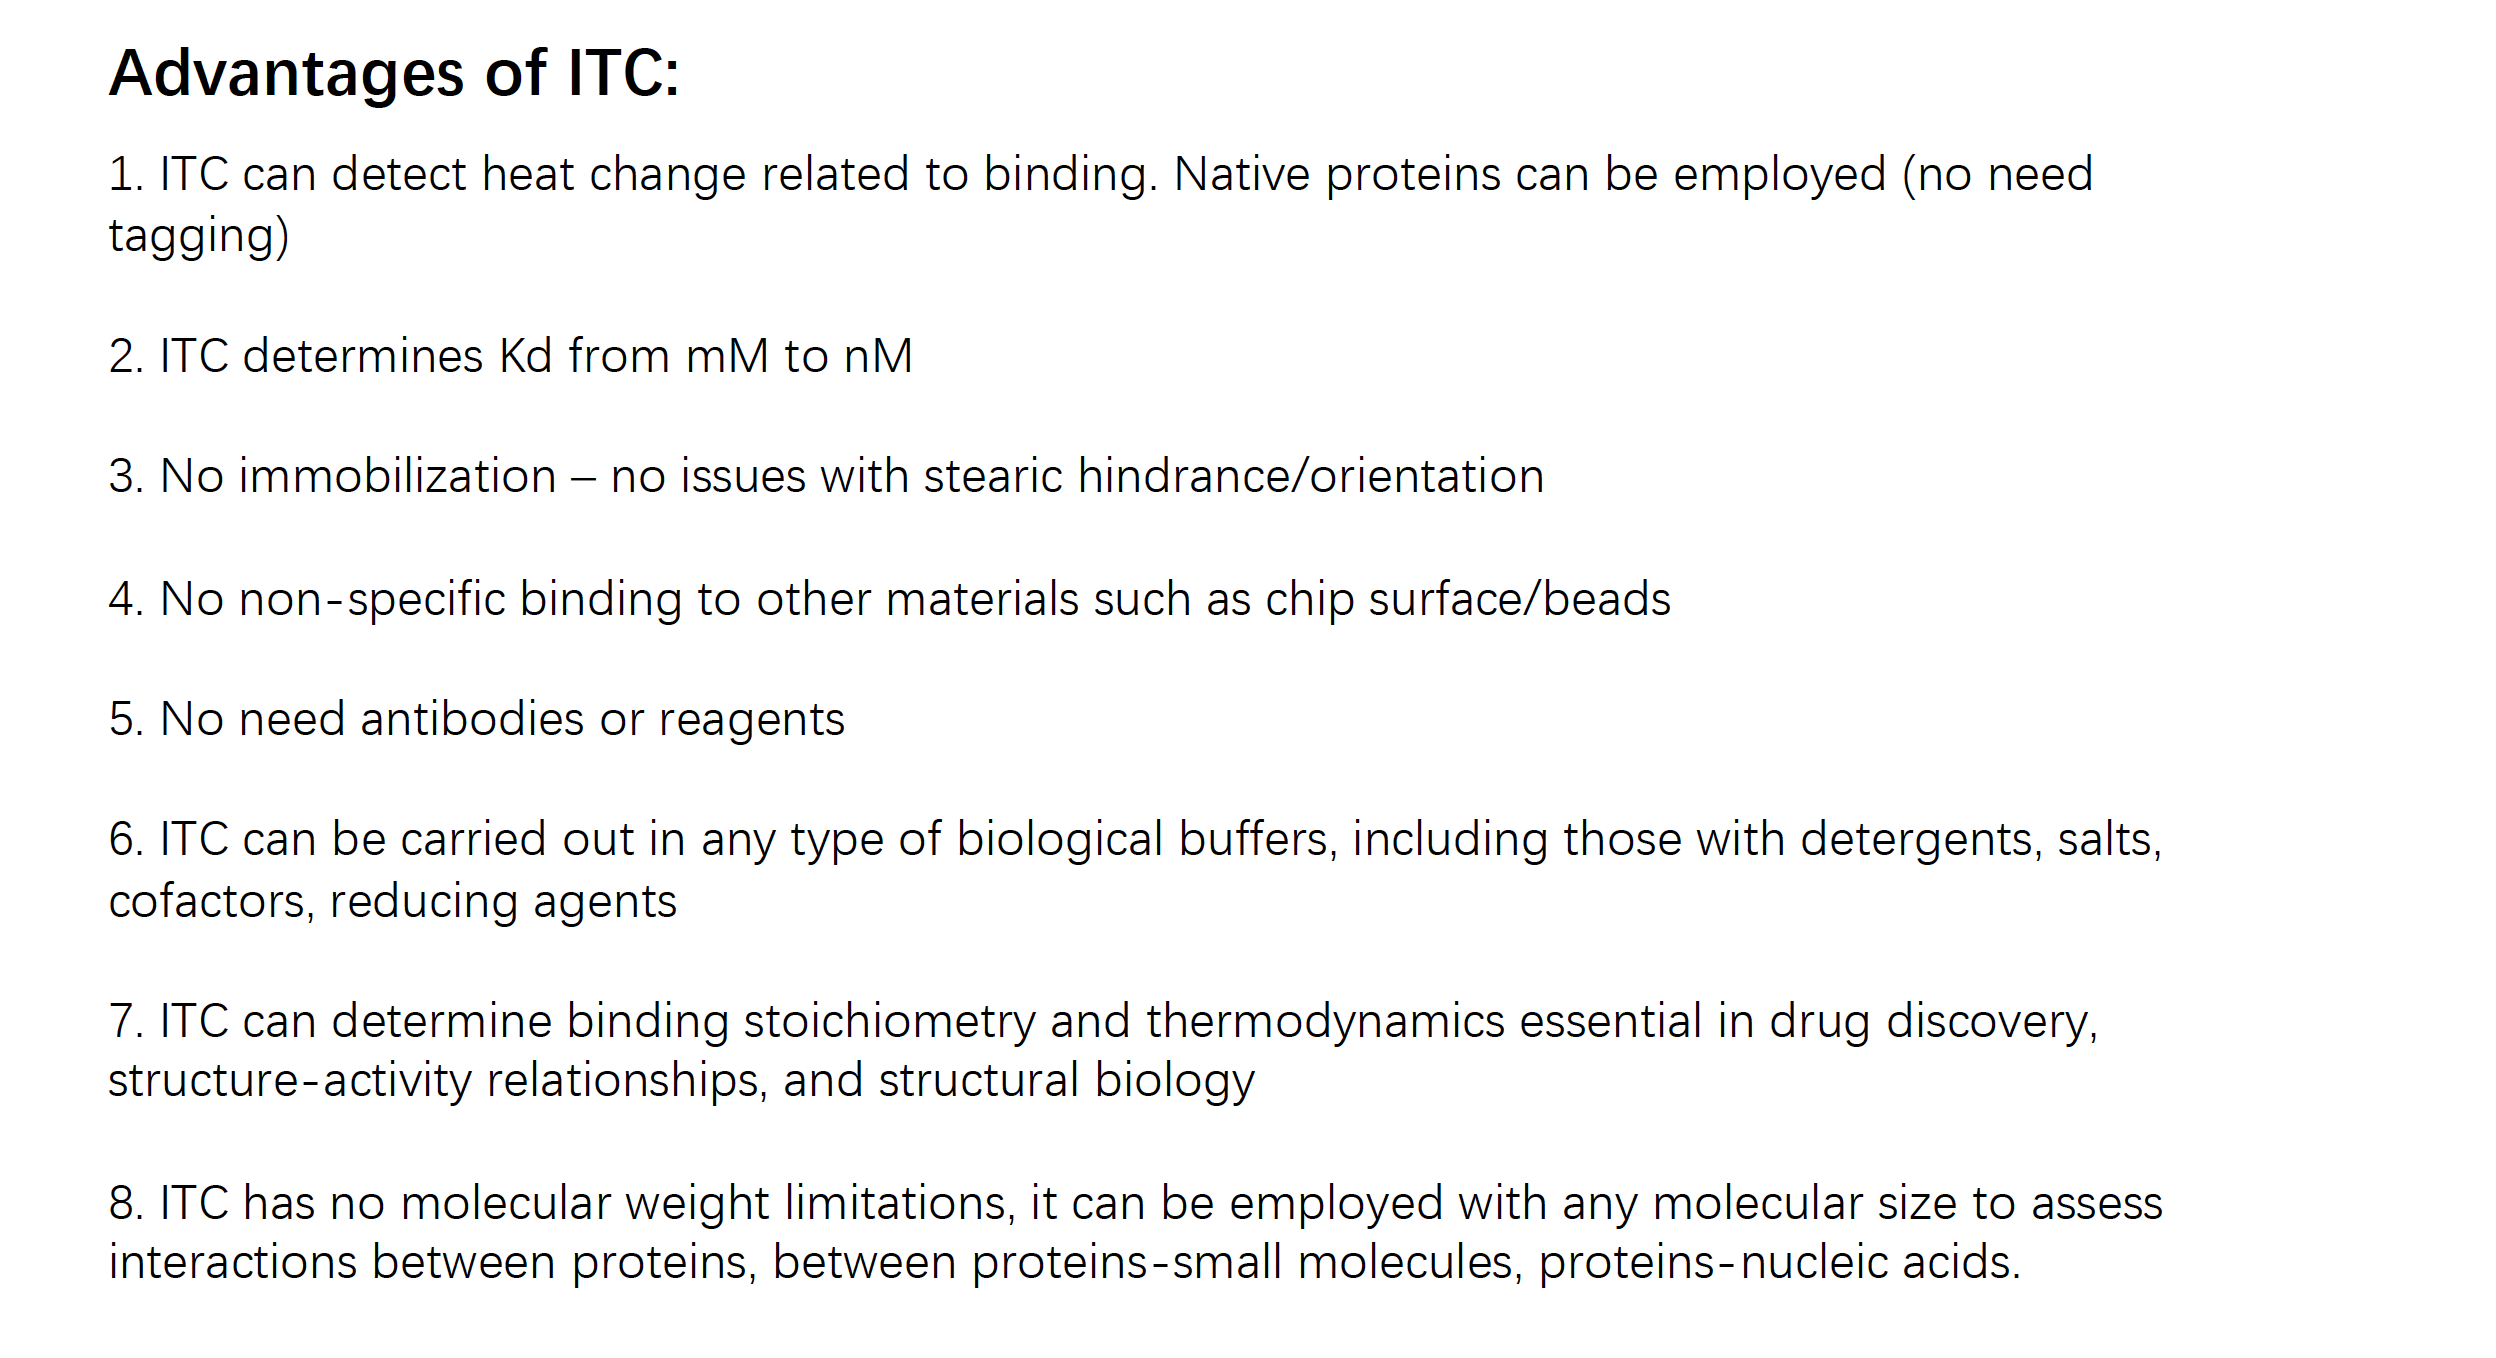
Advantage of ITC
Tutorial for final paper
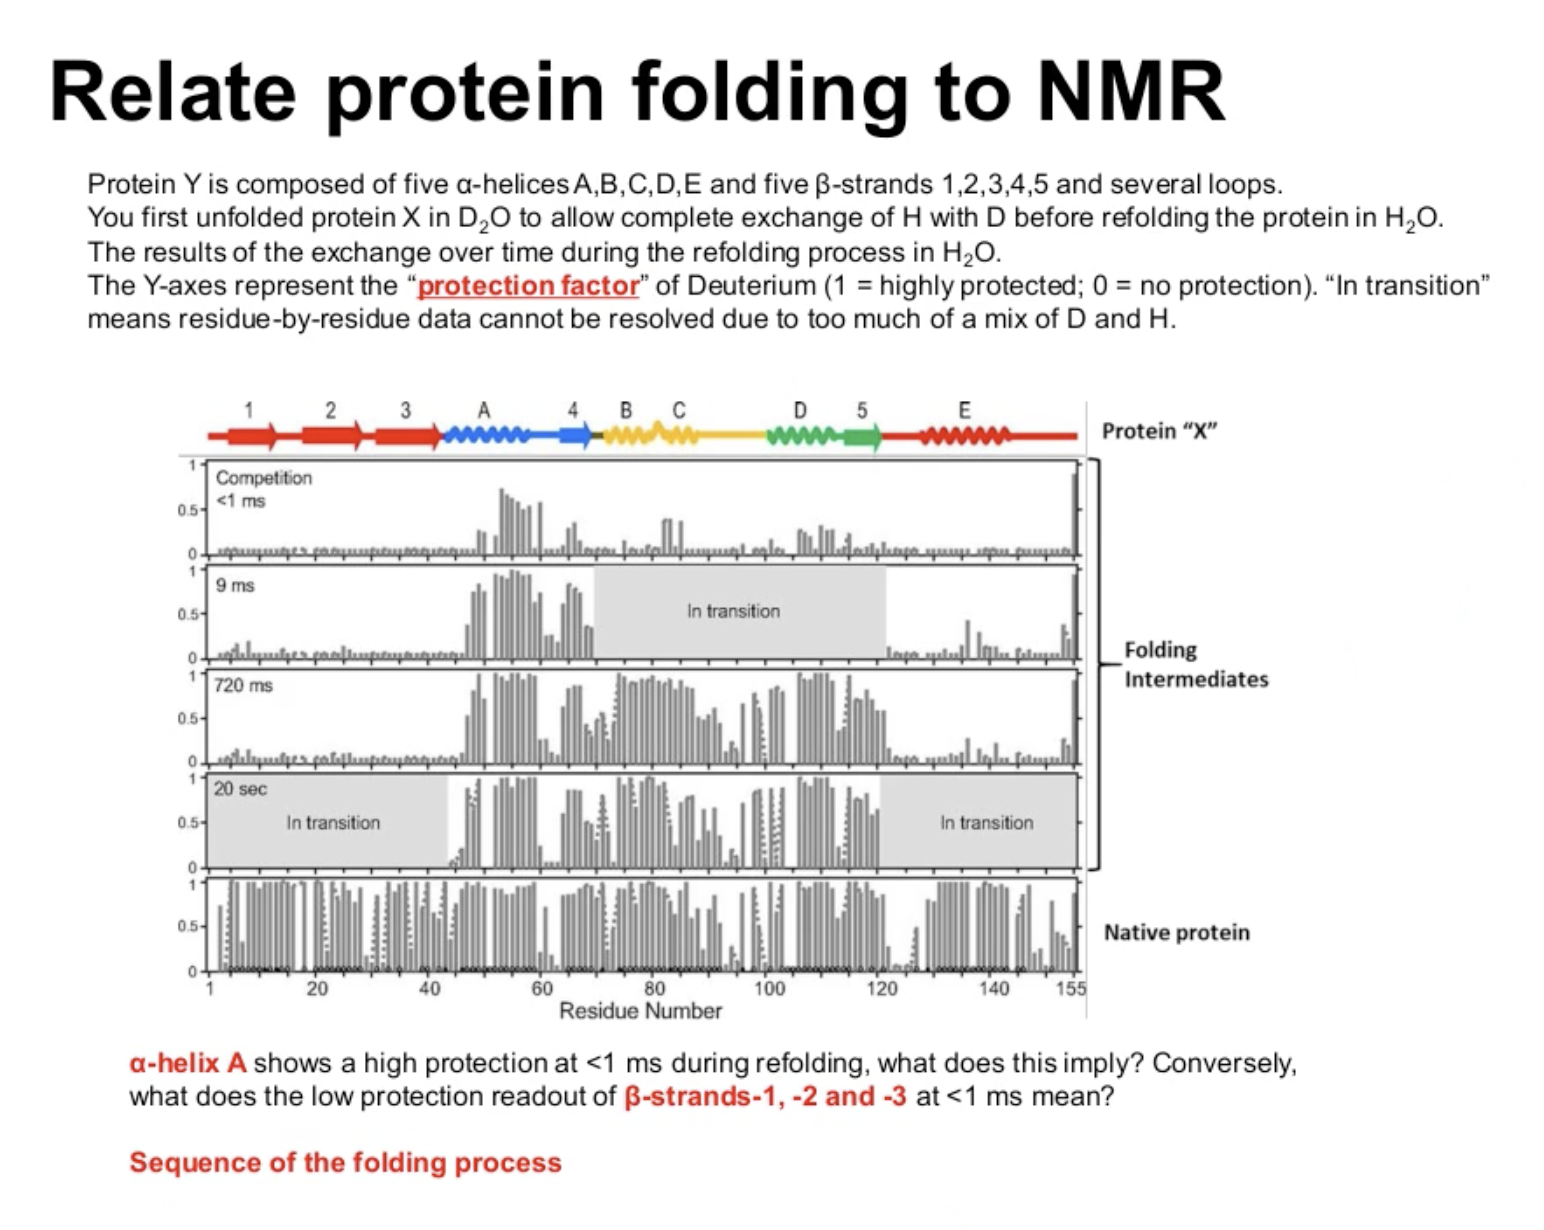
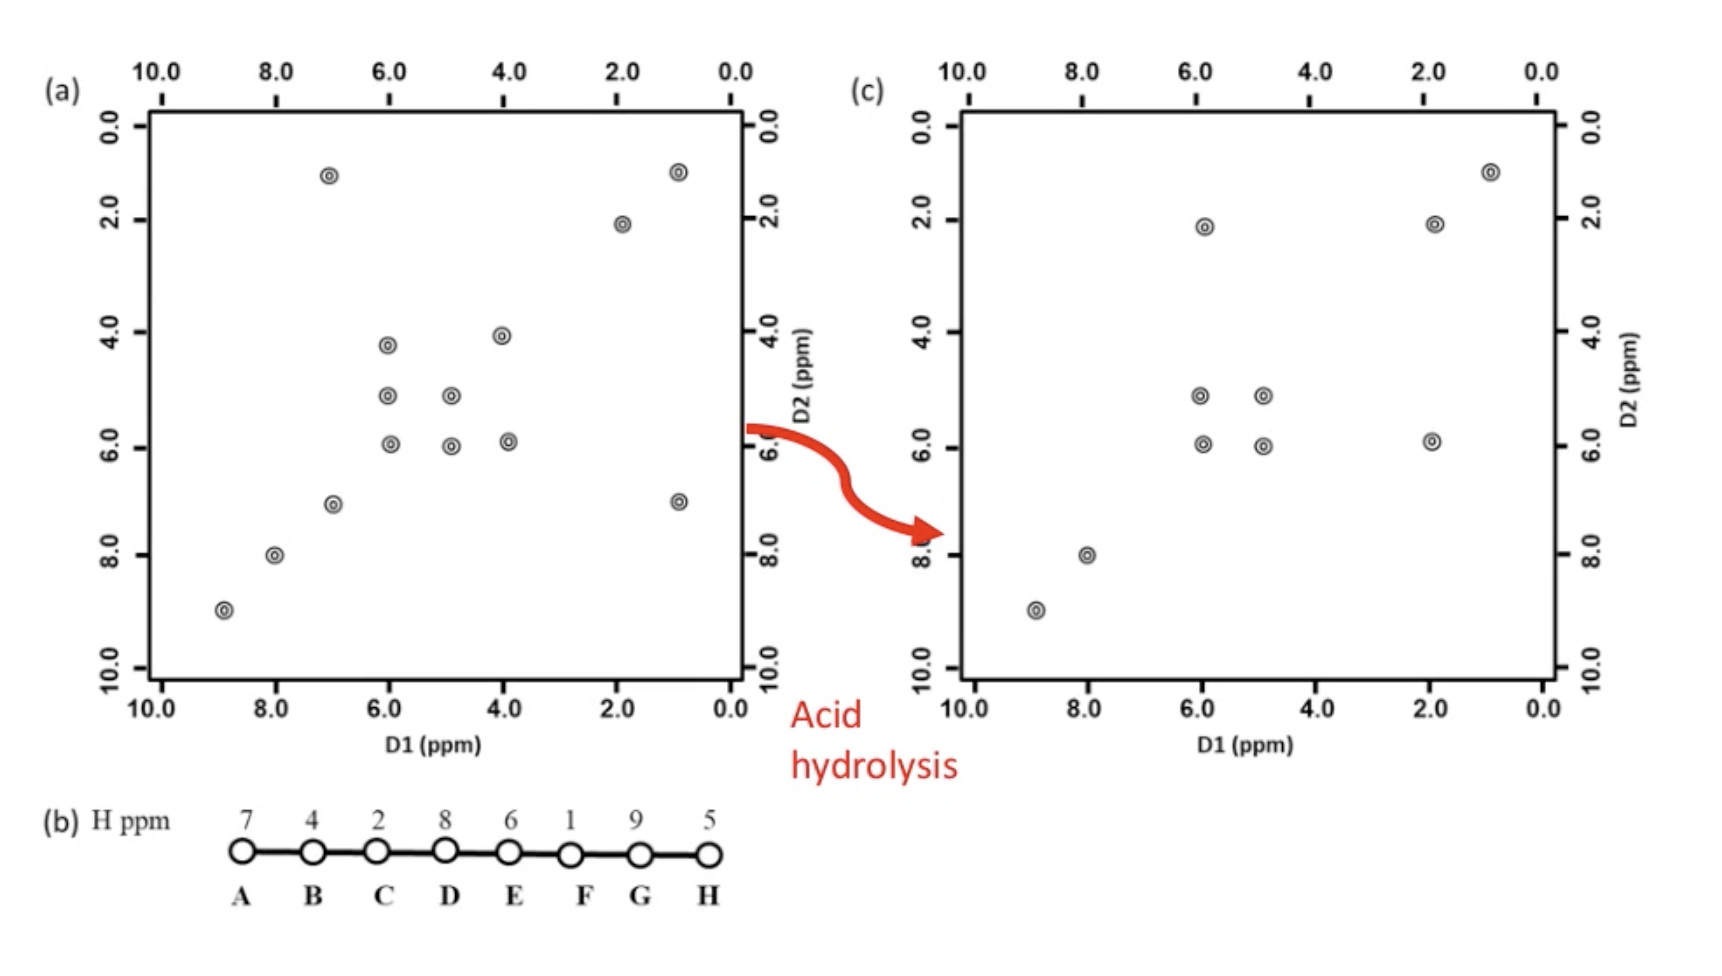
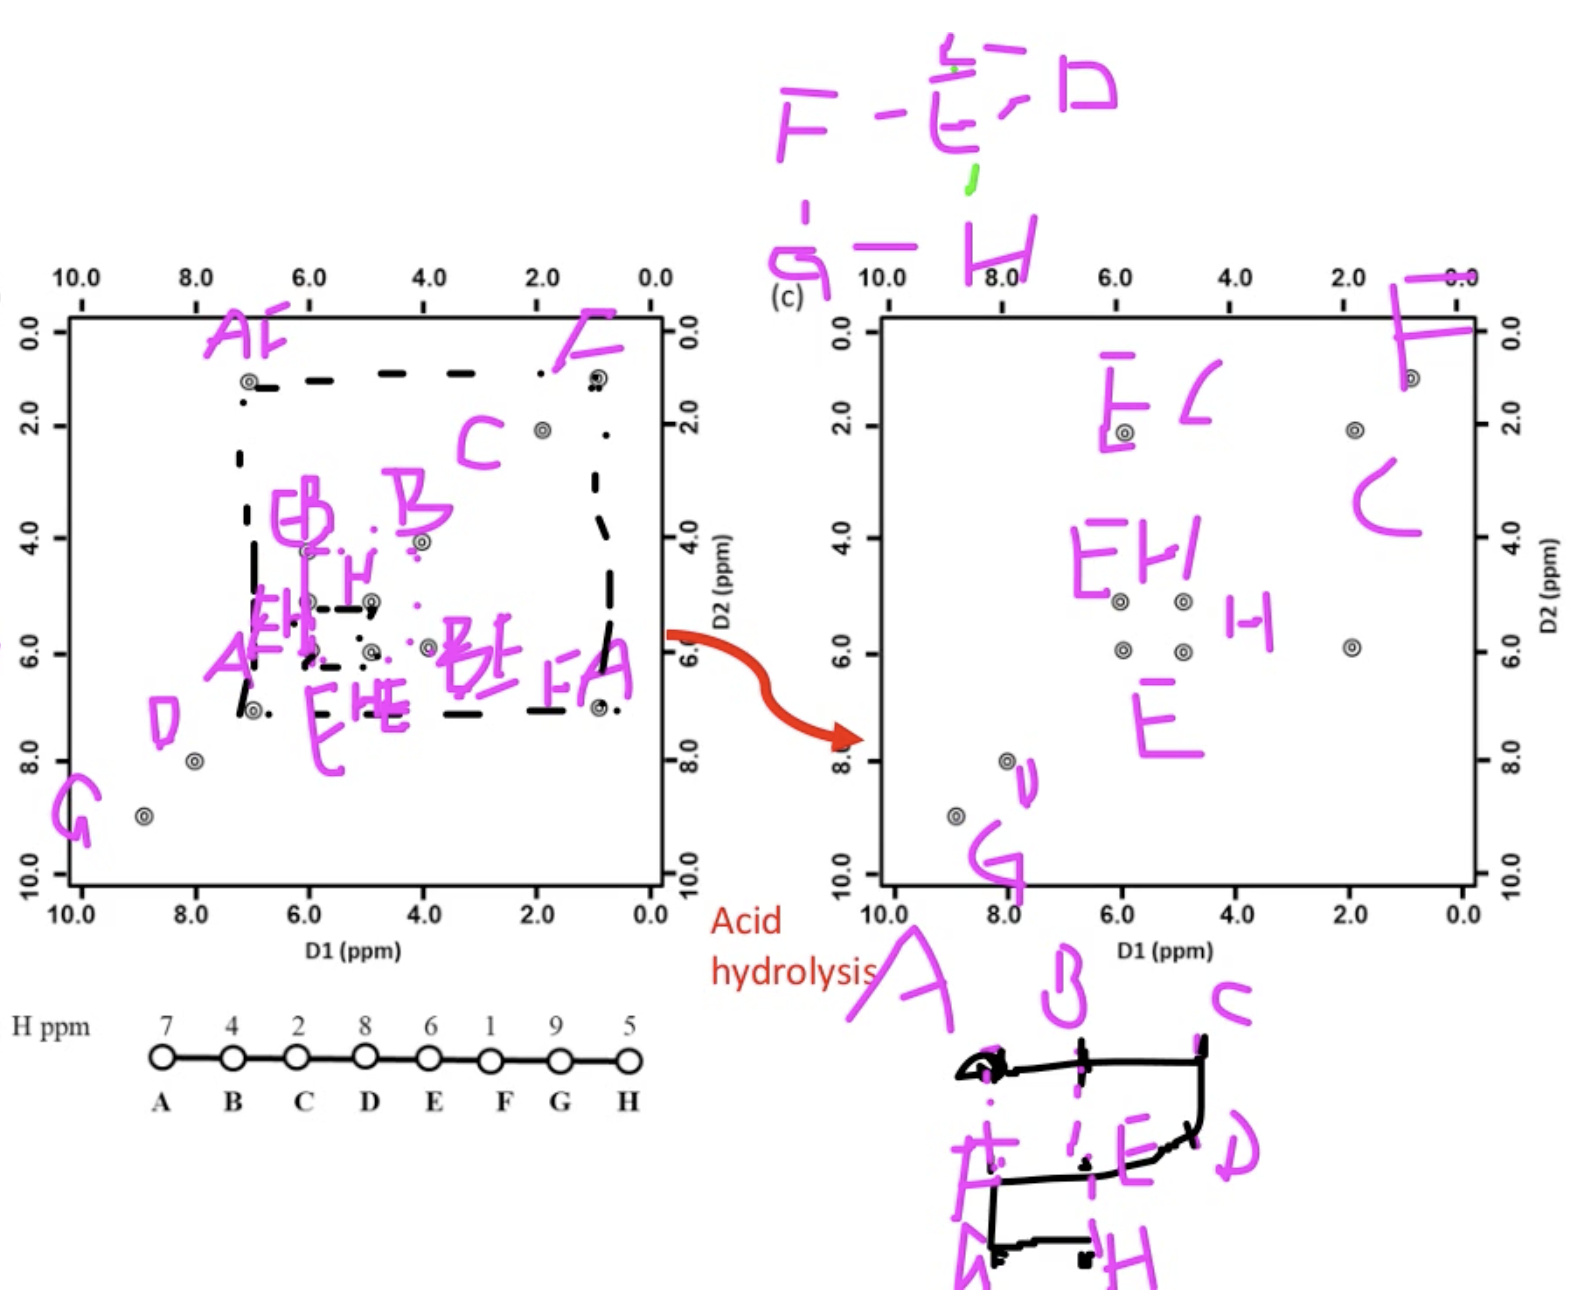
What does
That’s the part where molecular condense and collapse and shield from the water
What does the low protection readout of
They are completely exposed to the water.
Sequence of the folding process?
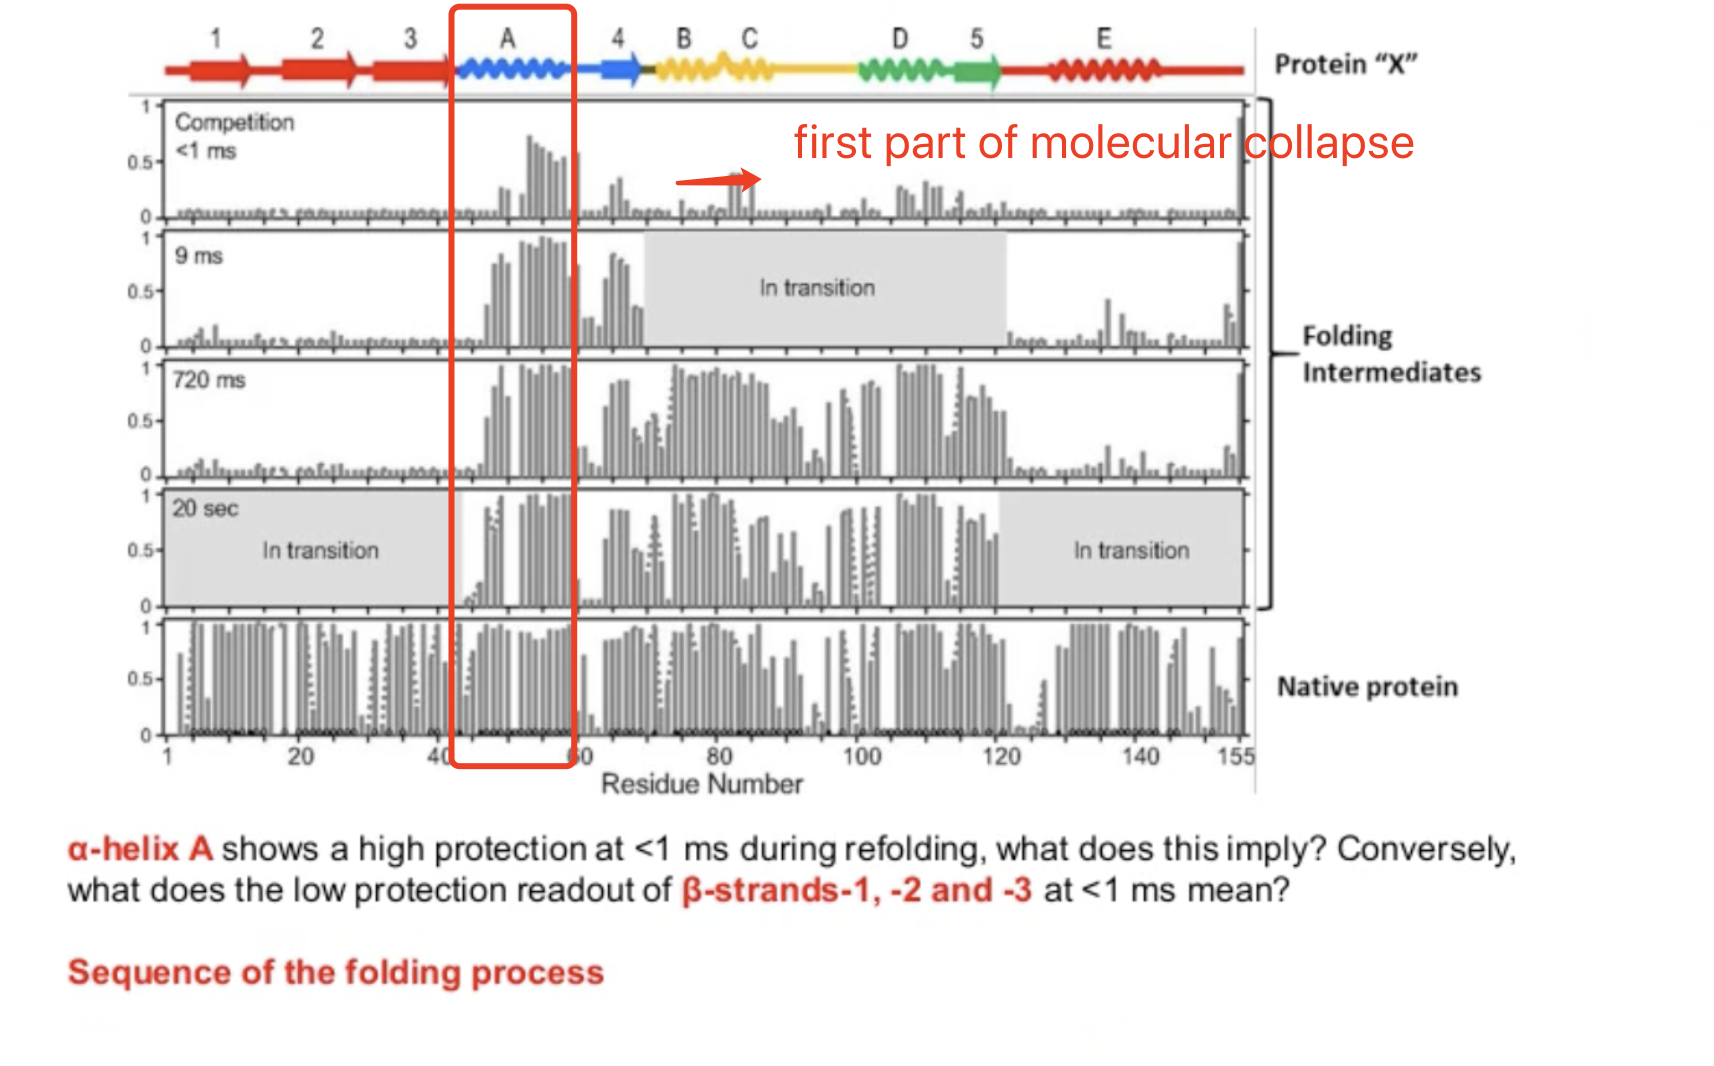
A is the first one to collapse (core of the protein), highest protection level
Second molecule: 4
Third: B
Forth: D
Fifth: C
A-4-B-D-C-5-E -1-2-3
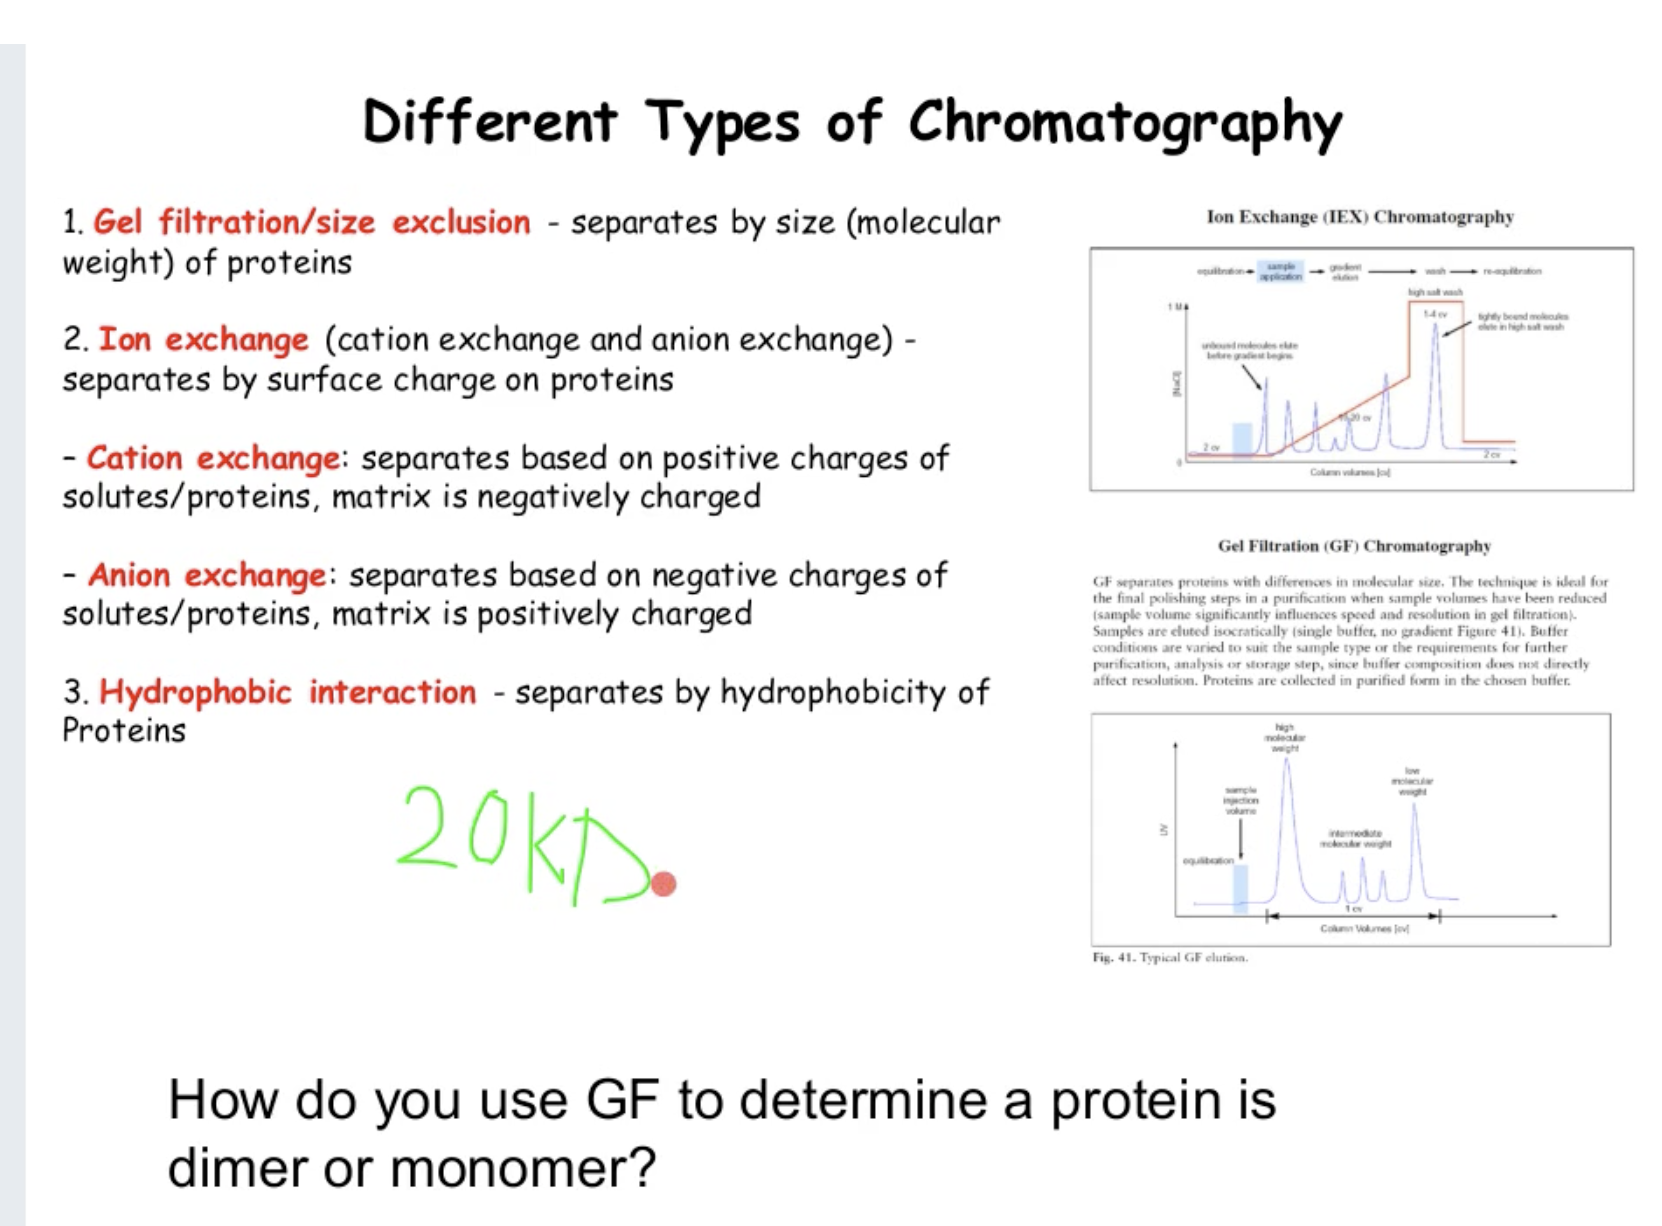
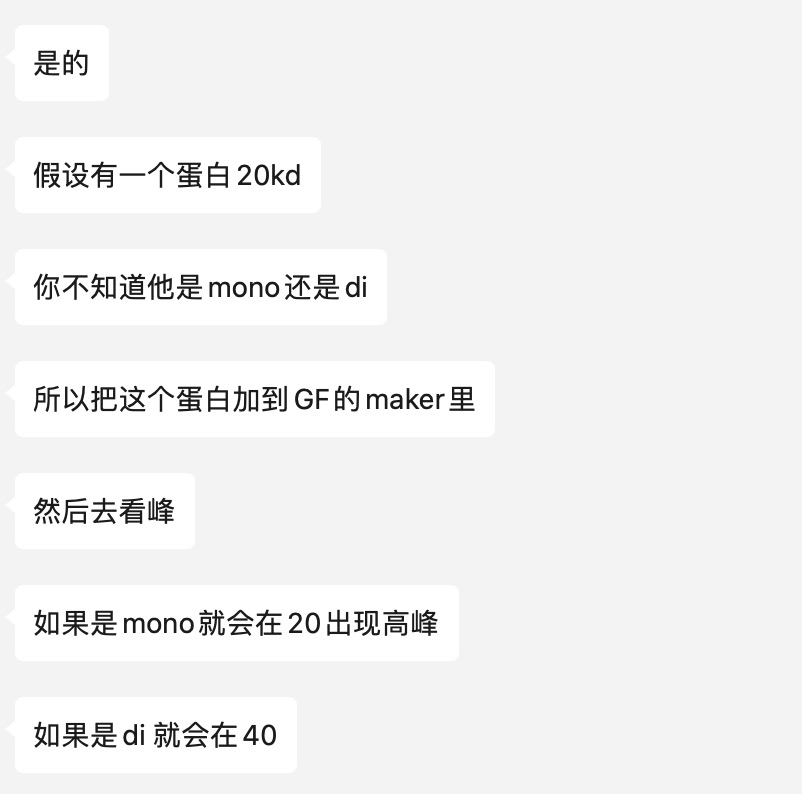
How do you use gel filtration to determine a protein is dimer or monomer? (1:20)
SDS-PAGE denature the protein, the structure would be destroyed. If this protein is a dimer, it will divid into two proteins.
Assume we have a kinase of 20KD from SDS-PAGE (monomer). 40KD(dimer).
In this case we use a set of marker run at GF column. The blue line are the marker we would use. Add protein to the marker and run run the gel again. Marker would stick to the protein. If protein came up at the same location, it will be a monomer, if out in the 40, then will be the dimer
Note: SDS-PAGE are not used in this experiment
互联网上的答案:
If other techniques are available, I generally don’t recommend the use of cross-linkers because the process is funadamentally stochastic. Unless you have a very specific cross-linker (for example, attaching to cysteines near the dimerization site) you will get a mixture of dimers and higher order oligomers. This results in false positives at high concentration and false negatives at lower concentrations.
Ion mobility mass spectrometry (IM-MS) requires the dimer complex to be stable in the gas phase. Although it is quick and does give you additional information beyond some of the simple techniques, it would not be my first choice just to see if it is a dimer or not.
The simple techniques are actually the best here. As pointed out by other posters, a native gel or size exclusion column will likely give you the correct answer. Keep in mind, though, that native gels are generally not run in strictly physiological conditions. The pH is adjusted away from neutral to give the protein enough charge to migrate in the gel .Blue native gels may also mask charges important for complex formation. In contrast, size exclusion columns will give the correct answer in most situations.
For weaker complexes that may fall apart with separation based techniques, DLS ,diffusion NMR, or ITC may help and give you additional information as well (energetics with ITC and residue specific information if you have an assigned spectrum with NMR).
Edit: As Michal Jakob and Scott Kalbach suggest, analytical ultracentrifugation is one of the most accurate methods for measuring monomer/oligomer equilibrium. Unlike all the other techniques except cross-linking, it can also (with difficulty) be used for membrane proteins by adjusting the density of the solvent with D2O or sucrose.
Concepts of thermal shift + CD
x has low structure because the background is high of fluorescence
Y has more structure 所以对应的是左图中的蓝线,是alpha helix
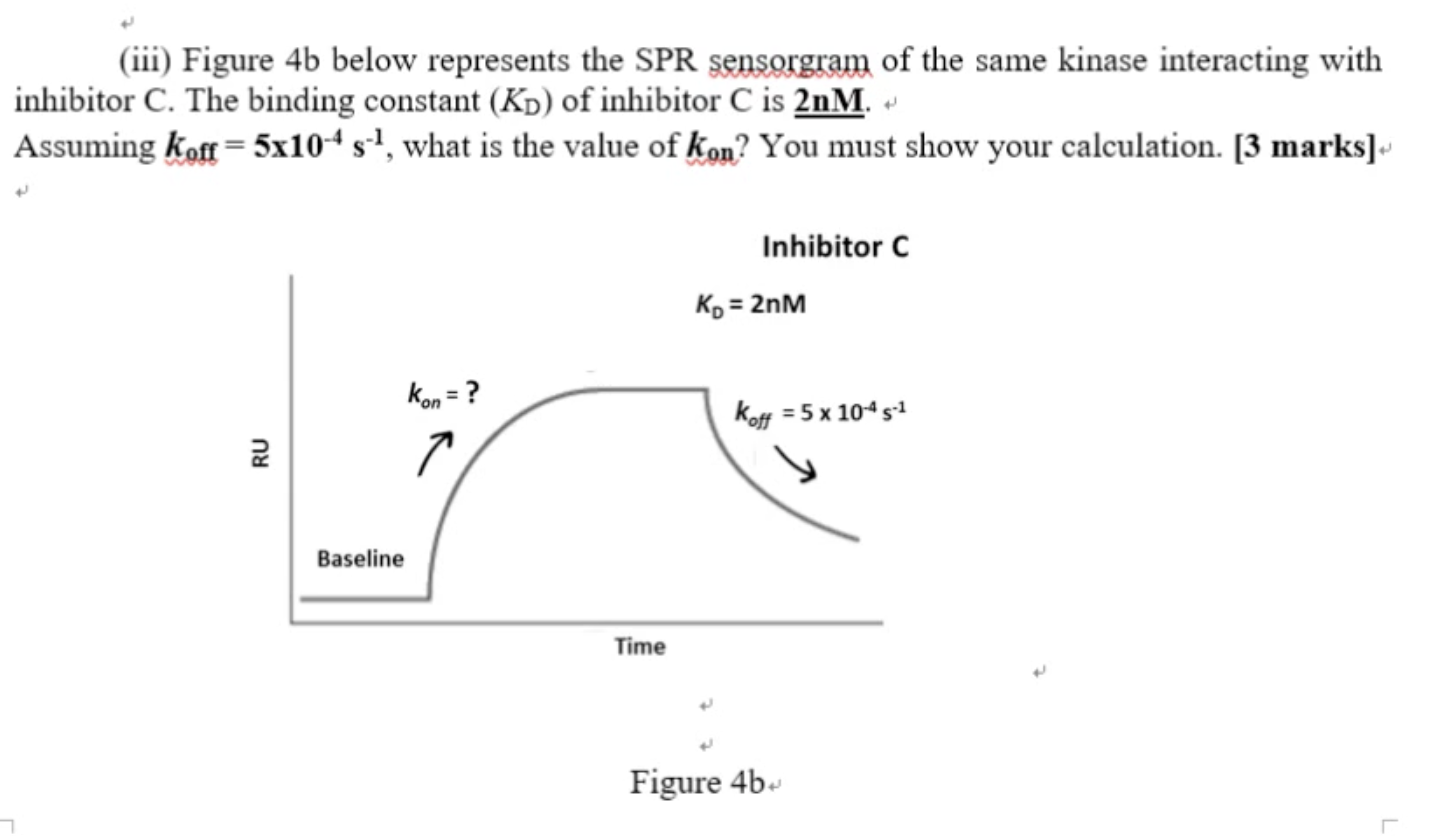
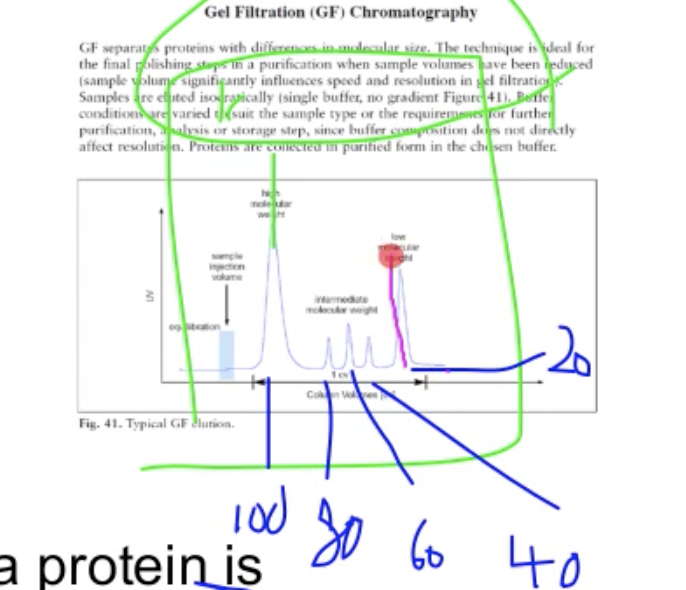
concepts of SPR: kon; kof; kd
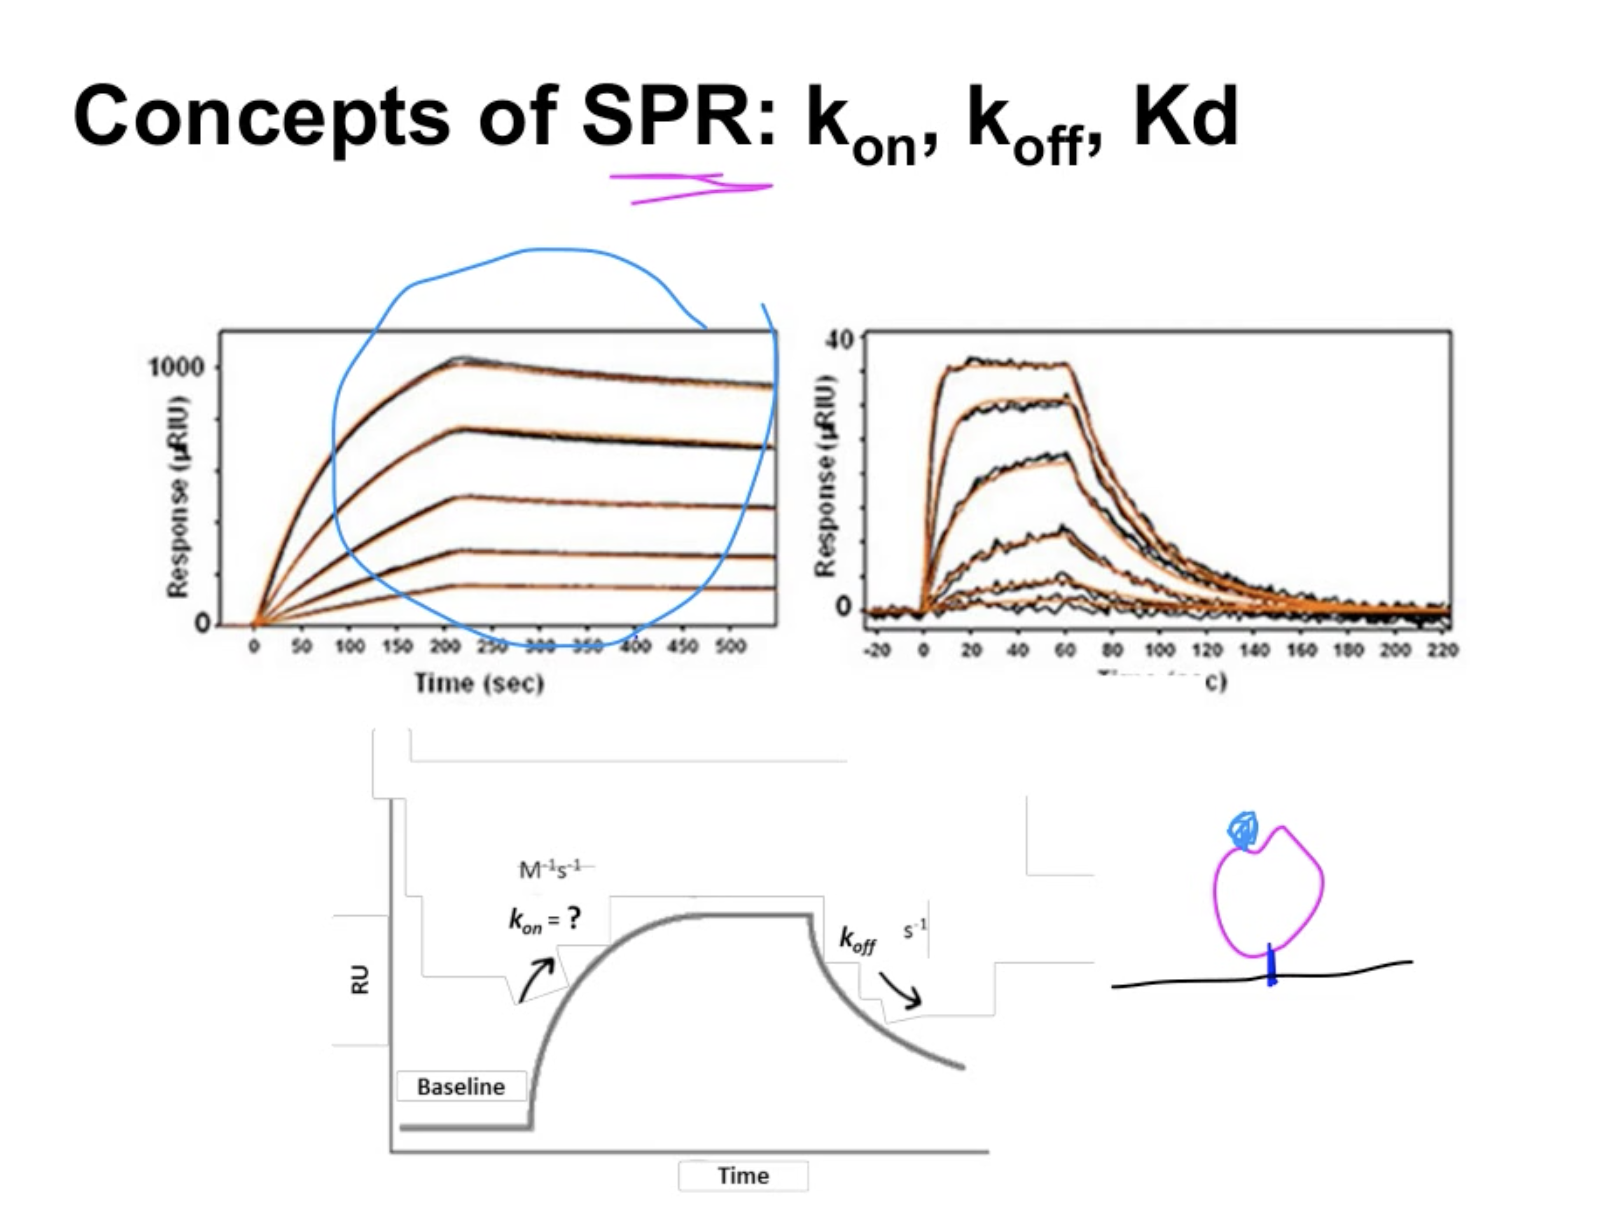
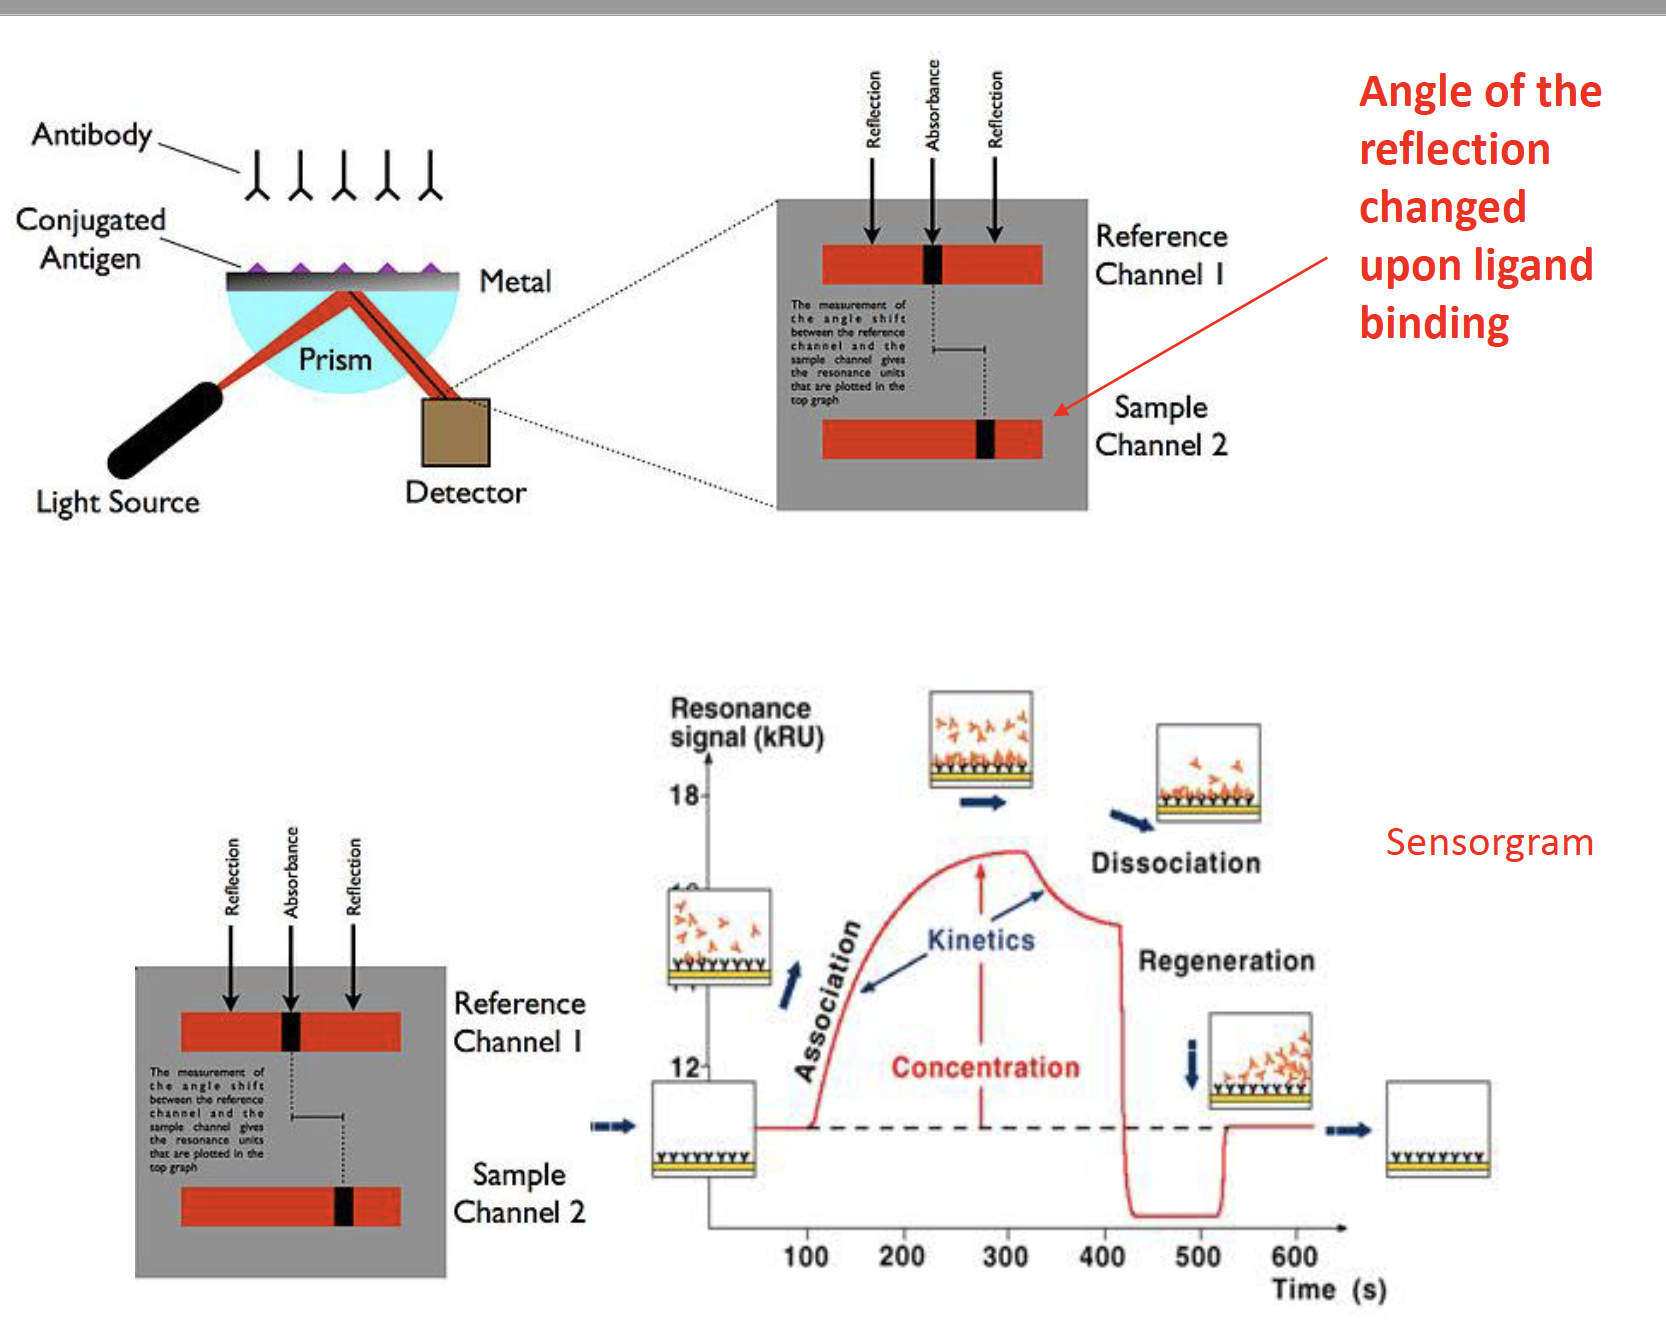
sensorgram
The difference in the binding and the affinity between these two ligands. Kon, Koff, How to define Kd
左图1: slow binder with high affinity
右图:quick binder (通过陡然的上升)but with very lousy background, low affinity (通过右图的右半部分的悬崖式的断层)
kD depends on the calculation
IC50、EC50、Ki、Kd、Ka、Km、Kon、Koff傻傻分不清?可能是目前为止最详尽讨论文章
https://zhuanlan.zhihu.com/p/29900912
Relate SPR to ITC
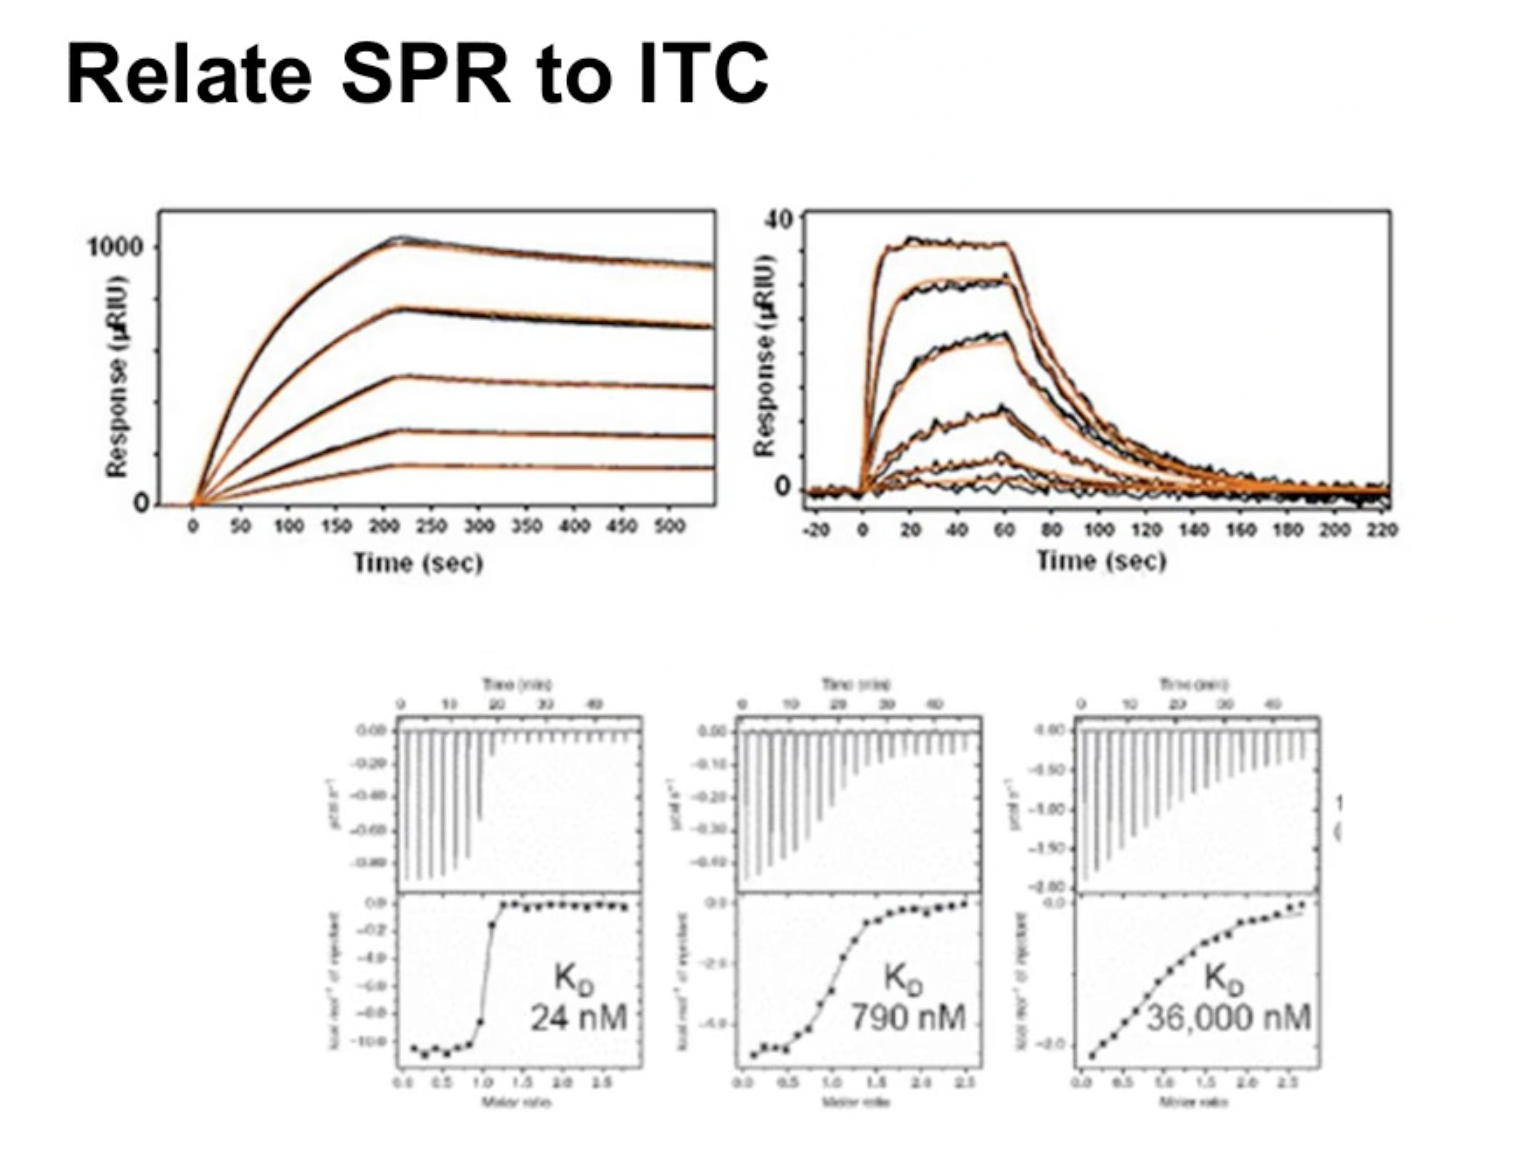
ANSWER:
The lower the value, the higher the affinity; so the left figure could be A The right figure which has low affinity binder could be figure B or C
Comparison between ITC and SPR
Biophysical techniques such as Isothermal Calorimetry (ITC), and Surface Plasmon Resonance are used to thermodynamically and kinetically characterize the binding mechanism of the protein-ligand or protein-protein interactions,
ITC measures the heat released or absorbed during the protein-ligand interactions, whereas, SPR measures the change in reflective angle of the incident light caused by surface waves called ‘Plasmon Polaritons. Since plasmon polaritons, are sensitive to binding events occurring on a surface, it proportionally affects the angle of the reflected light
Concepts of thermal shift vs binding affinities
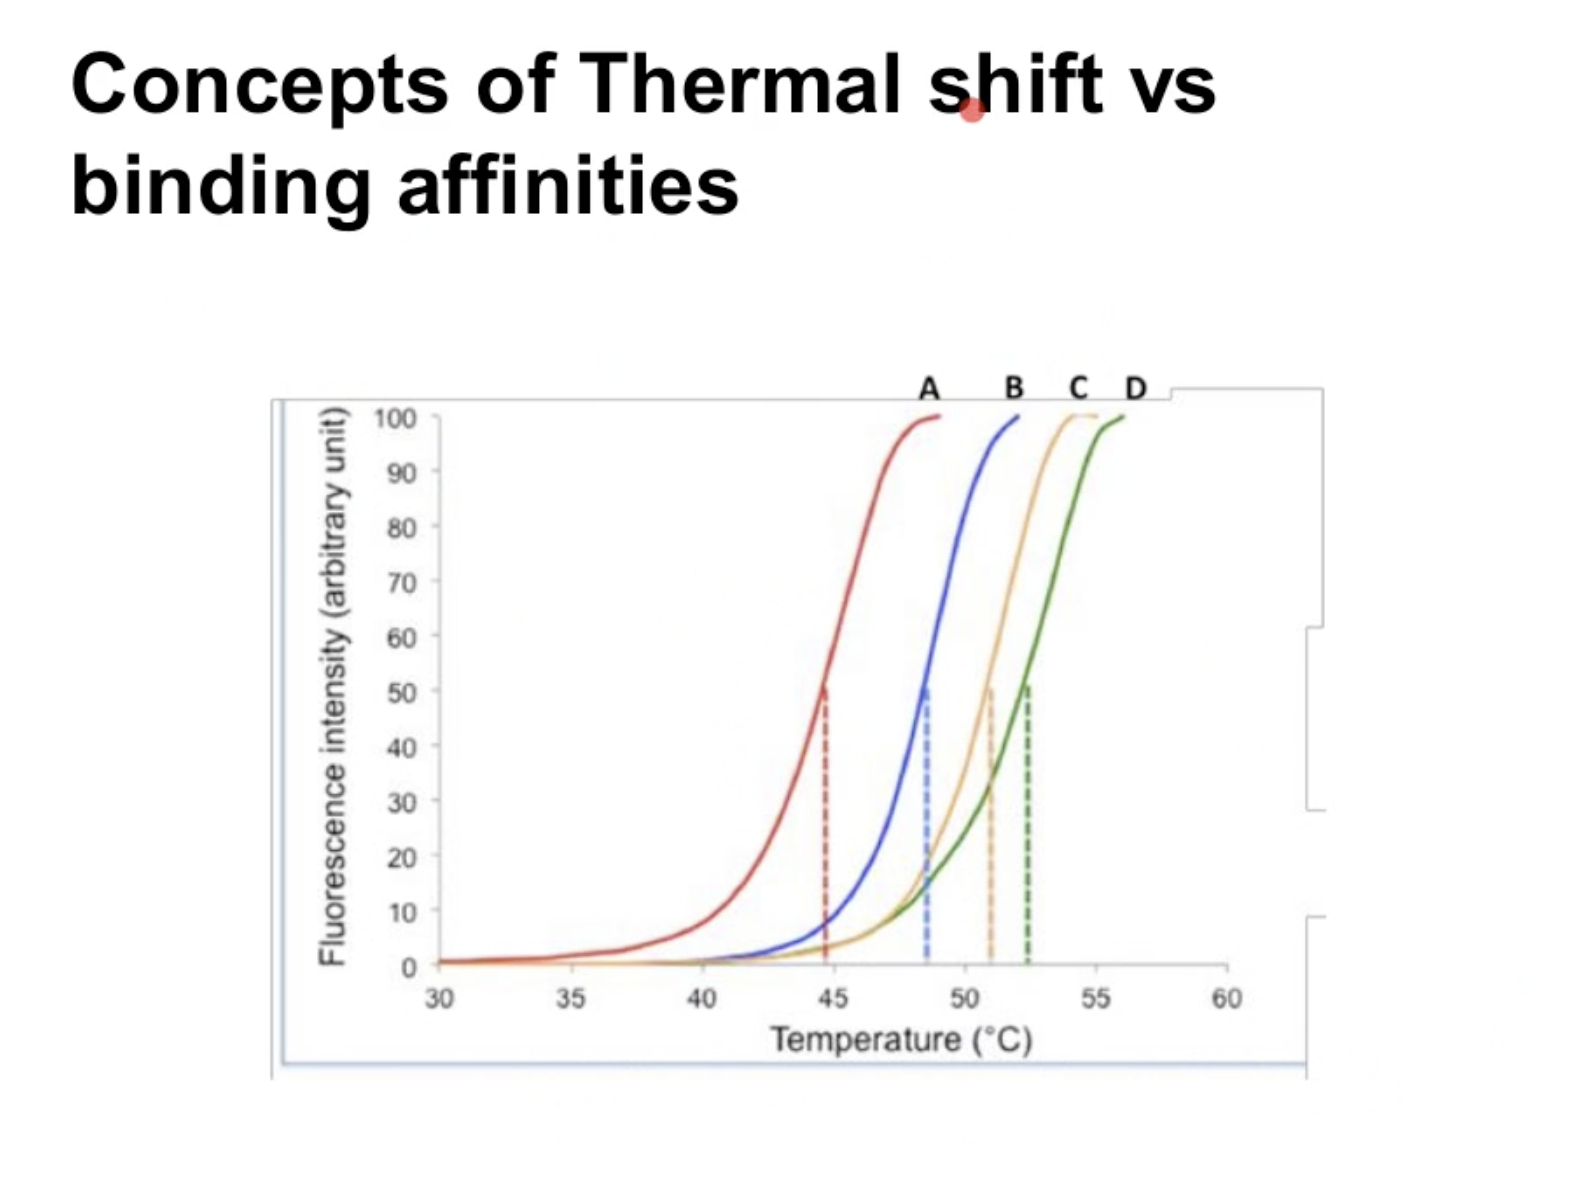
有三种选择ki (a)1nm (b)100nm (c) 1pm,找出哪个curve和(c)对应
Answer
- 1nm =1000pm
- 1pm is the lowest value of ki, which means it has the highest affinity, suggesting the structure is stable
- Require more energy to conduct the thermal shift
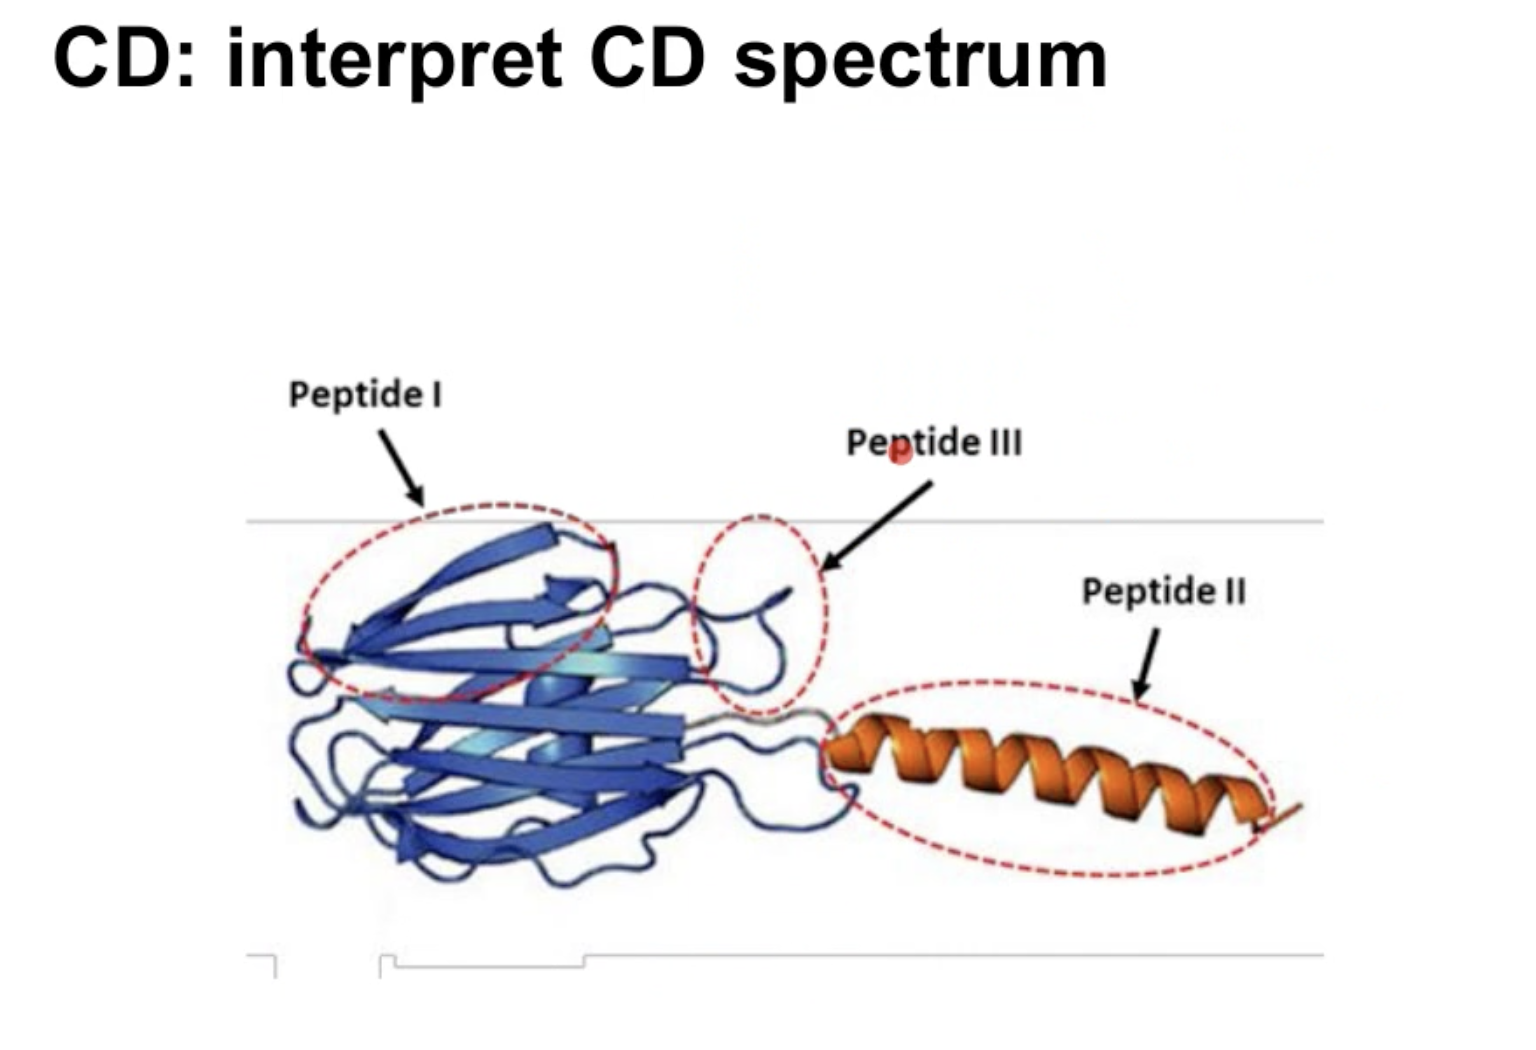
上图是对应三种结构,记得那张在CD中的图
Alpha-helix : 对应的是peptideII
Beta-sheet:对应的是peptide I
Coil 对应的是peptides III
有一张图可以对应其关系
CW1
Requirements
Courseworks requirements
Protocol
columns
Expected output
Which columns
Justification for choosing that column
Expected output? Diagrams
How would you design a purification regime, step-by-step, to isolate the mutant enzyme X from the liver of mouse “Y”? Explain the rationale of your purification scheme. [60 marks]
Answer:
step1: Since the provided raw sample is from the liver of mouse “Y”, which means the liver need to be smashed into the liquid format
step2: The smashed liver liquid are then processed in a high speed blender, breaking out the cell membranes and releasing the inside cell components.
step3:Owing to the fact that our target is to isolate the mutant enzyme, we need to utilize some filter papers to roughly filter out those target contents.
step4: Ammonium Sulfate precipitation method can be used to partially purify the mixture. According to the protocols, we need to slowly add saturated ammonium sulfate to bring the final concentration to 50% saturation, which means the total amount of ammonium sulfate should equal with the sample amount. Therefore, the ammonium sulfate should add into the samples gradually, in this case, the ideal percentage should be 10%, 20%…50%. But owing to the different condition, some bias may exist, therefore, 5 columens should be prepared to hold the precipitates under different ammonium sulfate percentage, each columns should be clearly labeled for convenience. Adding the ammonium sulfate very slowly ensures that local concentration around the site of addition does not exceed the desired salt concentration. The insoluble aggregates would be our products.
Rational of step4: The whole mechanisms behind this approach is the electrolyte-nonelectrolyte interaction. In solution, proteins form hydrogen bonds with water molecules through their exposed polar and ionic groups. When high concentrations of small, highly charged ions such as ammonium sulfate are added, these groups compete with the proteins to bind to the water molecules. This removes the water molecules from the protein and decreases its solubility, resulting in precipitation. Critical factors that affect the concentration at which a particular protein will precipitate include: the number and position of polar groups, molecular weight of the protein, pH of the solution, and temperature at which the precipitation is performed.
step5: the isolated 5 samples are resuspended in the buffer to be active and soluble again. As suggested in the problems that the presence of enzyme X can be detected with radioassay by the capture of the released 14CO2. In this case, five samples are feed into substrates respectively and the sample whose generated CO2 can be detected by radioassay could be considered as the sample enzyme x. We denoted this sample as sample A.
step6:SDS-PAGE should be incorporated to test the sample A’s purity
Rational of step6:SDS-PAGE is an analytical technique to separate proteins based on their molecular weight. In SDS-PAGE, the use of sodium dodecyl sulfate (SDS, also known as sodium lauryl sulfate) and polyacrylamide gel largely eliminates the influence of the structure and charge, and proteins are separated solely based on polypeptide chain length. Therefore, it could be used to figure out the samples’ purity.
step7: Dialysis technique should be included to perform purification for samples containing macromolecules, in this case, enzymes. Some unnecessary salts in the previous steps could be removed.
Rational of step7 Dialysis is a separation technique that facilitates the removal of small, unwanted compounds from macromolecules in solution by selective and passive diffusion through a semi-permeable membrane.
step8: ion exchange chromatography should be utilized on sample A in the following step. Owing to the fact we have no idea about the pI (isoelectric point) of the protein, we need to include both anion and cation exchanger. In other words, the samples need to conduct the experiments twice.
We should note that the tightly bound ones would be washed away by the high concentrated sodium chloride, the eluted samples should be collected by different tubes
SDS-PAGE should be conducted to figure out the inside components.
Rational of step8:
The net surface charge of proteins varies according to the surrounding pH. The pH at which a protein has no net charge is called isoelectric point (pI). Above its isoelectric point (pI), a protein will bind to a positively charged anion exchanger. Below its pI, a protein will bind to a negatively charged cation exchanger.
Proteins bind as they are loaded onto a column at low ionic strength. The conditions are then altered so that bound substances are desorbed differentially. Elution is usually performed by increasing salt concentration or changing pH in a gradient. Sodium chloride is usually considered as a suitable candidate to elute the bond ones gradually. By adjusting different concentration sodium chloride solution, we could obtain different protein samples.
Step9 Repeat the step in step5 and denoted the target sample as sample B.
step10: Hydrophobic Interaction Chromatography (HIC) would be utilized on sample B to purify the enzyme X.
Rational of step10: it could separate the protein based on the hydrophobicity. In this type of chromatography, hydrophobic groups such as phenyl, octyl, or butyl, are attached to the stationary column. Proteins that pass through the column that have hydrophobic amino acid side chains on their surfaces are able to interact with and bind to the hydrophobic groups on the column. Finally, buffer need to be used to elute the rest proteins.
step11: Similarly, repeat the step in step5 & step6, and denoted the target sample as sample C
step12: Gel filtration chromatography should also be included on sample C to filter out the proteins based on their molecules weight. The technique is ideal for the final polishing steps in a purification when sample volumes have been reduced.
Rational of step12 : The gel filtration chromatography is based on the molecular size and the hydrodynamic volume of the components. The molecules are separated by the differential exclusion or inclusion of solutes as they pass through the stationary phase containing heteroporous cross-linked polymeric gel or beads. Different permeation rates of the solute molecules cause them to sift in the interior of the gel particles. A column of the porous matrix is in equilibrium with the mobile phase for separation of the molecules. Large molecules are entirely excluded from the pores and come first in the effluent. Smaller molecules get distributed between the mobile phase and the outside of the sieve. Then, they pass through the column at a slower rate and appear later in the effluent.
step13 : Similarly, repeat the step in step5 & step6, and denoted the target sample as sample D
Based on the previous 13 steps, we could successfully isolate the mutant enzyme X from the liver of mouse “Y”. For the protein identification, you could turn to 2D gel electrophoresis and mass spectrometry for more details.
step14:2D Gel Electrophoresis can be used to characterize the proteins in the remaining samples.
Rational behind step14: two dimensional gel electrophoresis could separate proteins based on pI in 1st dimension and operate proteins based on molecular weight in 2nd dimensions
step15: Search the online databases, hoping to find the similar results.
Your partially purified sample exhibits very strong enzyme X activity in 14C assay but your SDS-PAGE looks like the example shown in the figure below:
What strategies would you use to identify enzyme X from the mixture? Explain how you would carry out the experiment and the reasons of your strategies. [40 marks]
Answer:
As learnt from the lecture, there are two widely used methods in protein identification, Edman Degradation and Mass spectrometry.
Edman degradation is the process of purifying protein by sequentially removing one residue at a time from the amino end of a peptide. Phenyl isothiocyanate is added to create a phenylthiocarbamoyl derivative with the N-terminal to remove only one residue at a time. The N-terminal is then cleaved under less harsh acidic conditions, creating a cyclic compound of phenylthiohydantoin PTH-amino acid. This does not damage the protein and leaves two constituents of the peptide.
At the first step, the proteins need to be broken down to peptide fragments by the strong acid which could ensure their terminal would be blocked and cannot be sequenced. High pressure liquid chromatography (HPLC) would be employed to separate the peptides. The amino acid sequencing are then followed to conduct sequence alignment to match the known sequences in the database to identify the protein.
The second choice would be the mass spectrometry. Mass spectrometry measures the mass-to-charge ratio of charged particles, mass spectrometry is used for determining masses of particles and the elemental composition of a sample of molecule as well as for elucidating the chemical structure of molecules such as peptides.
As can be seen from the figure that, four bands, suggesting four proteins, have been got. With either Edman degradation or mass spectrometry, we could utilize the approaches like BLAST to align the sequence stored in database. Since enzyme X in this case still could not be determined, we could use the “process of elimination” to identify the other three proteins.
- Post title:BIO312 Lee's part
- Post author:Yuxuan Wu
- Create time:2021-03-02 06:44:01
- Post link:yuxuanwu17.github.io2021/03/02/2021-03-02-BIO312-lees-part/
- Copyright Notice:All articles in this blog are licensed under BY-NC-SA unless stating additionally.