Revision protein structure and methods of analysis
Techniques for protein analysis
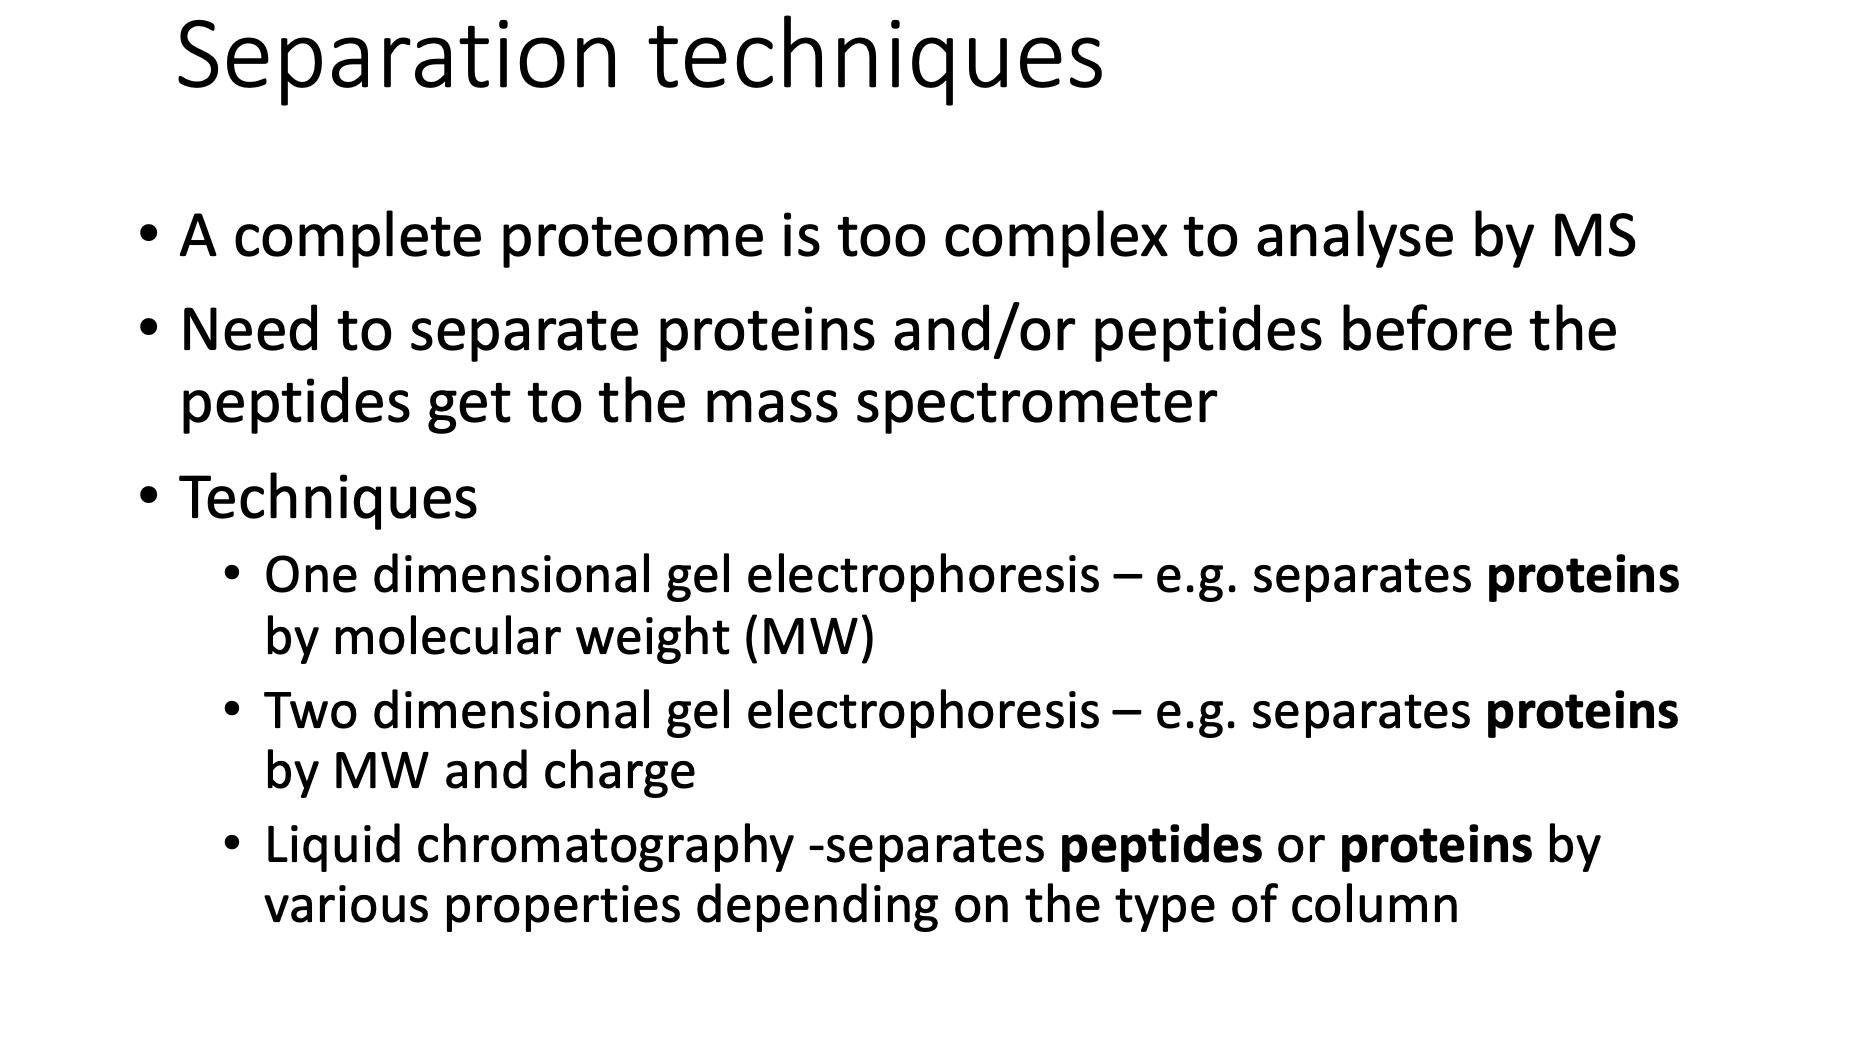
Protein seperation
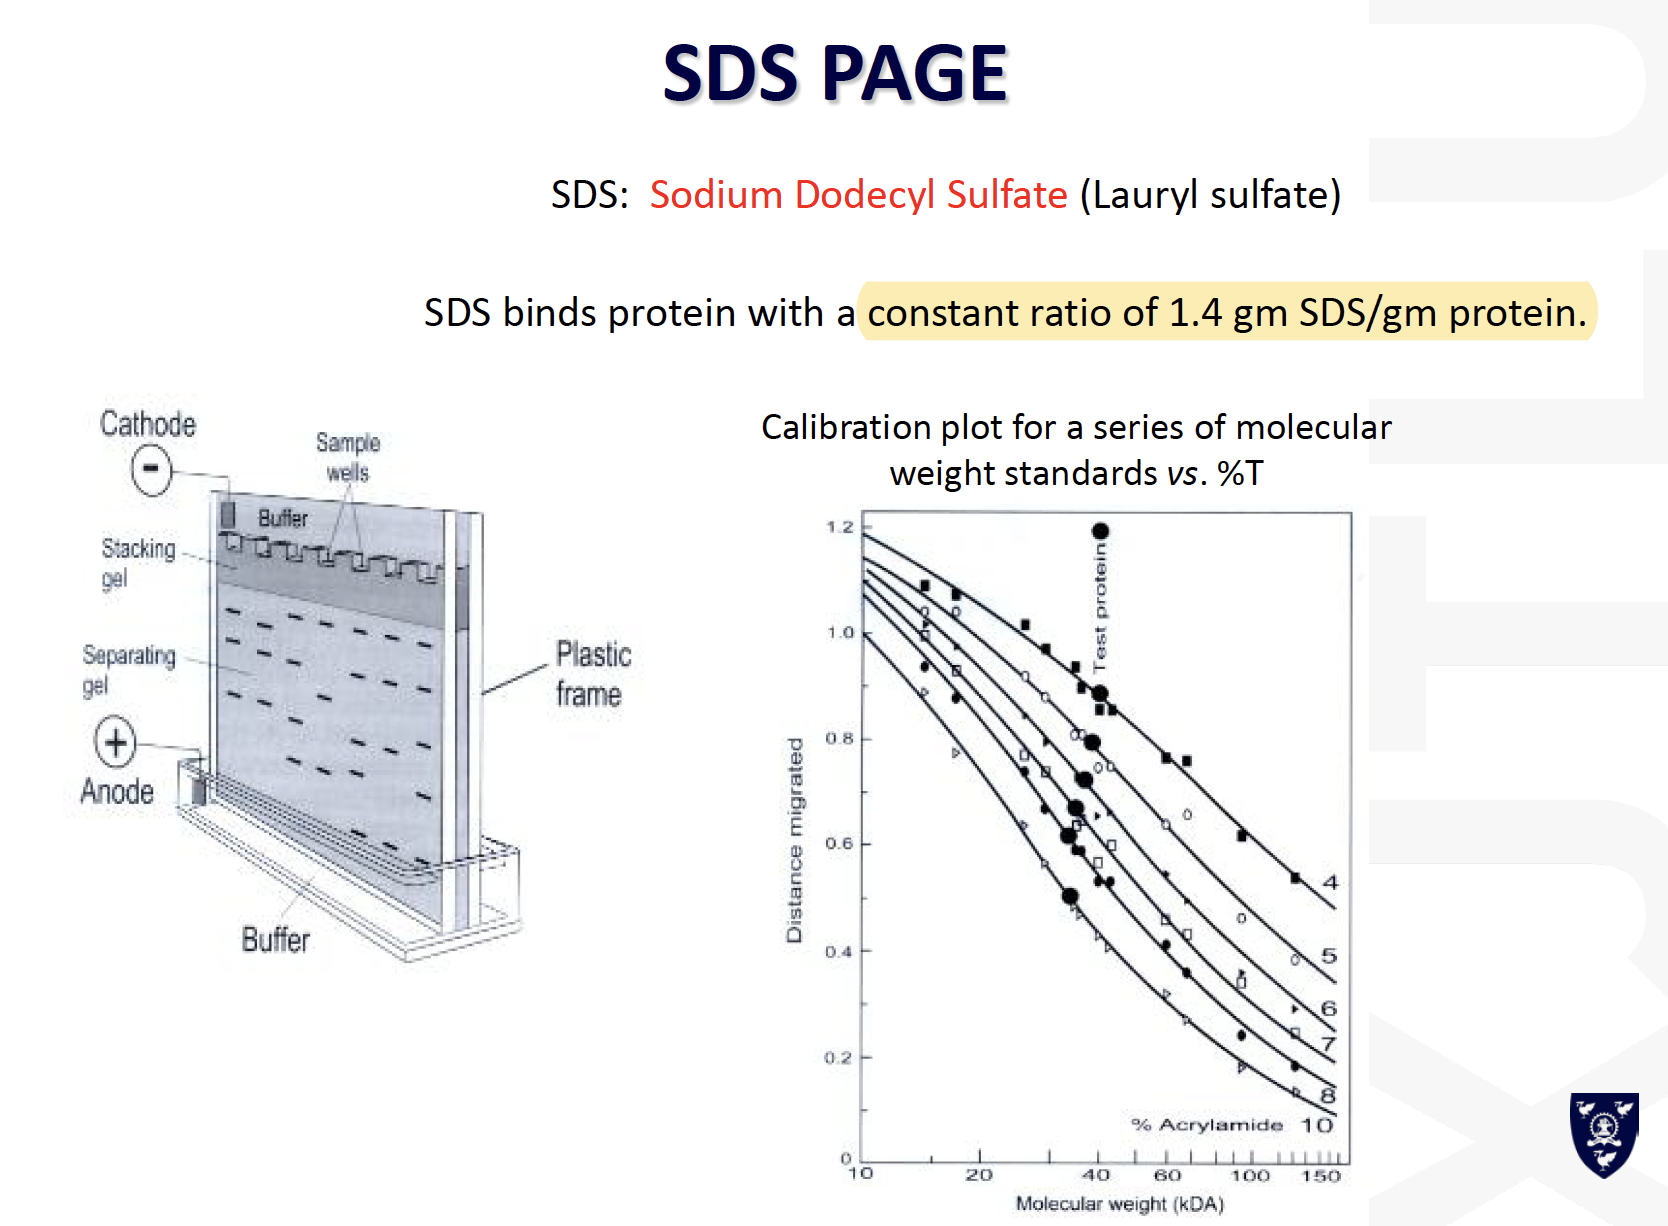
- SDS-PAGE: basis-molecular weight
- Isoelectric focusing: electric charge difference
- Chromatic methods-useful adjuncts to gel-based approaches
- HPLC - high performance liquid chromatography
- Thin-layer chromatography
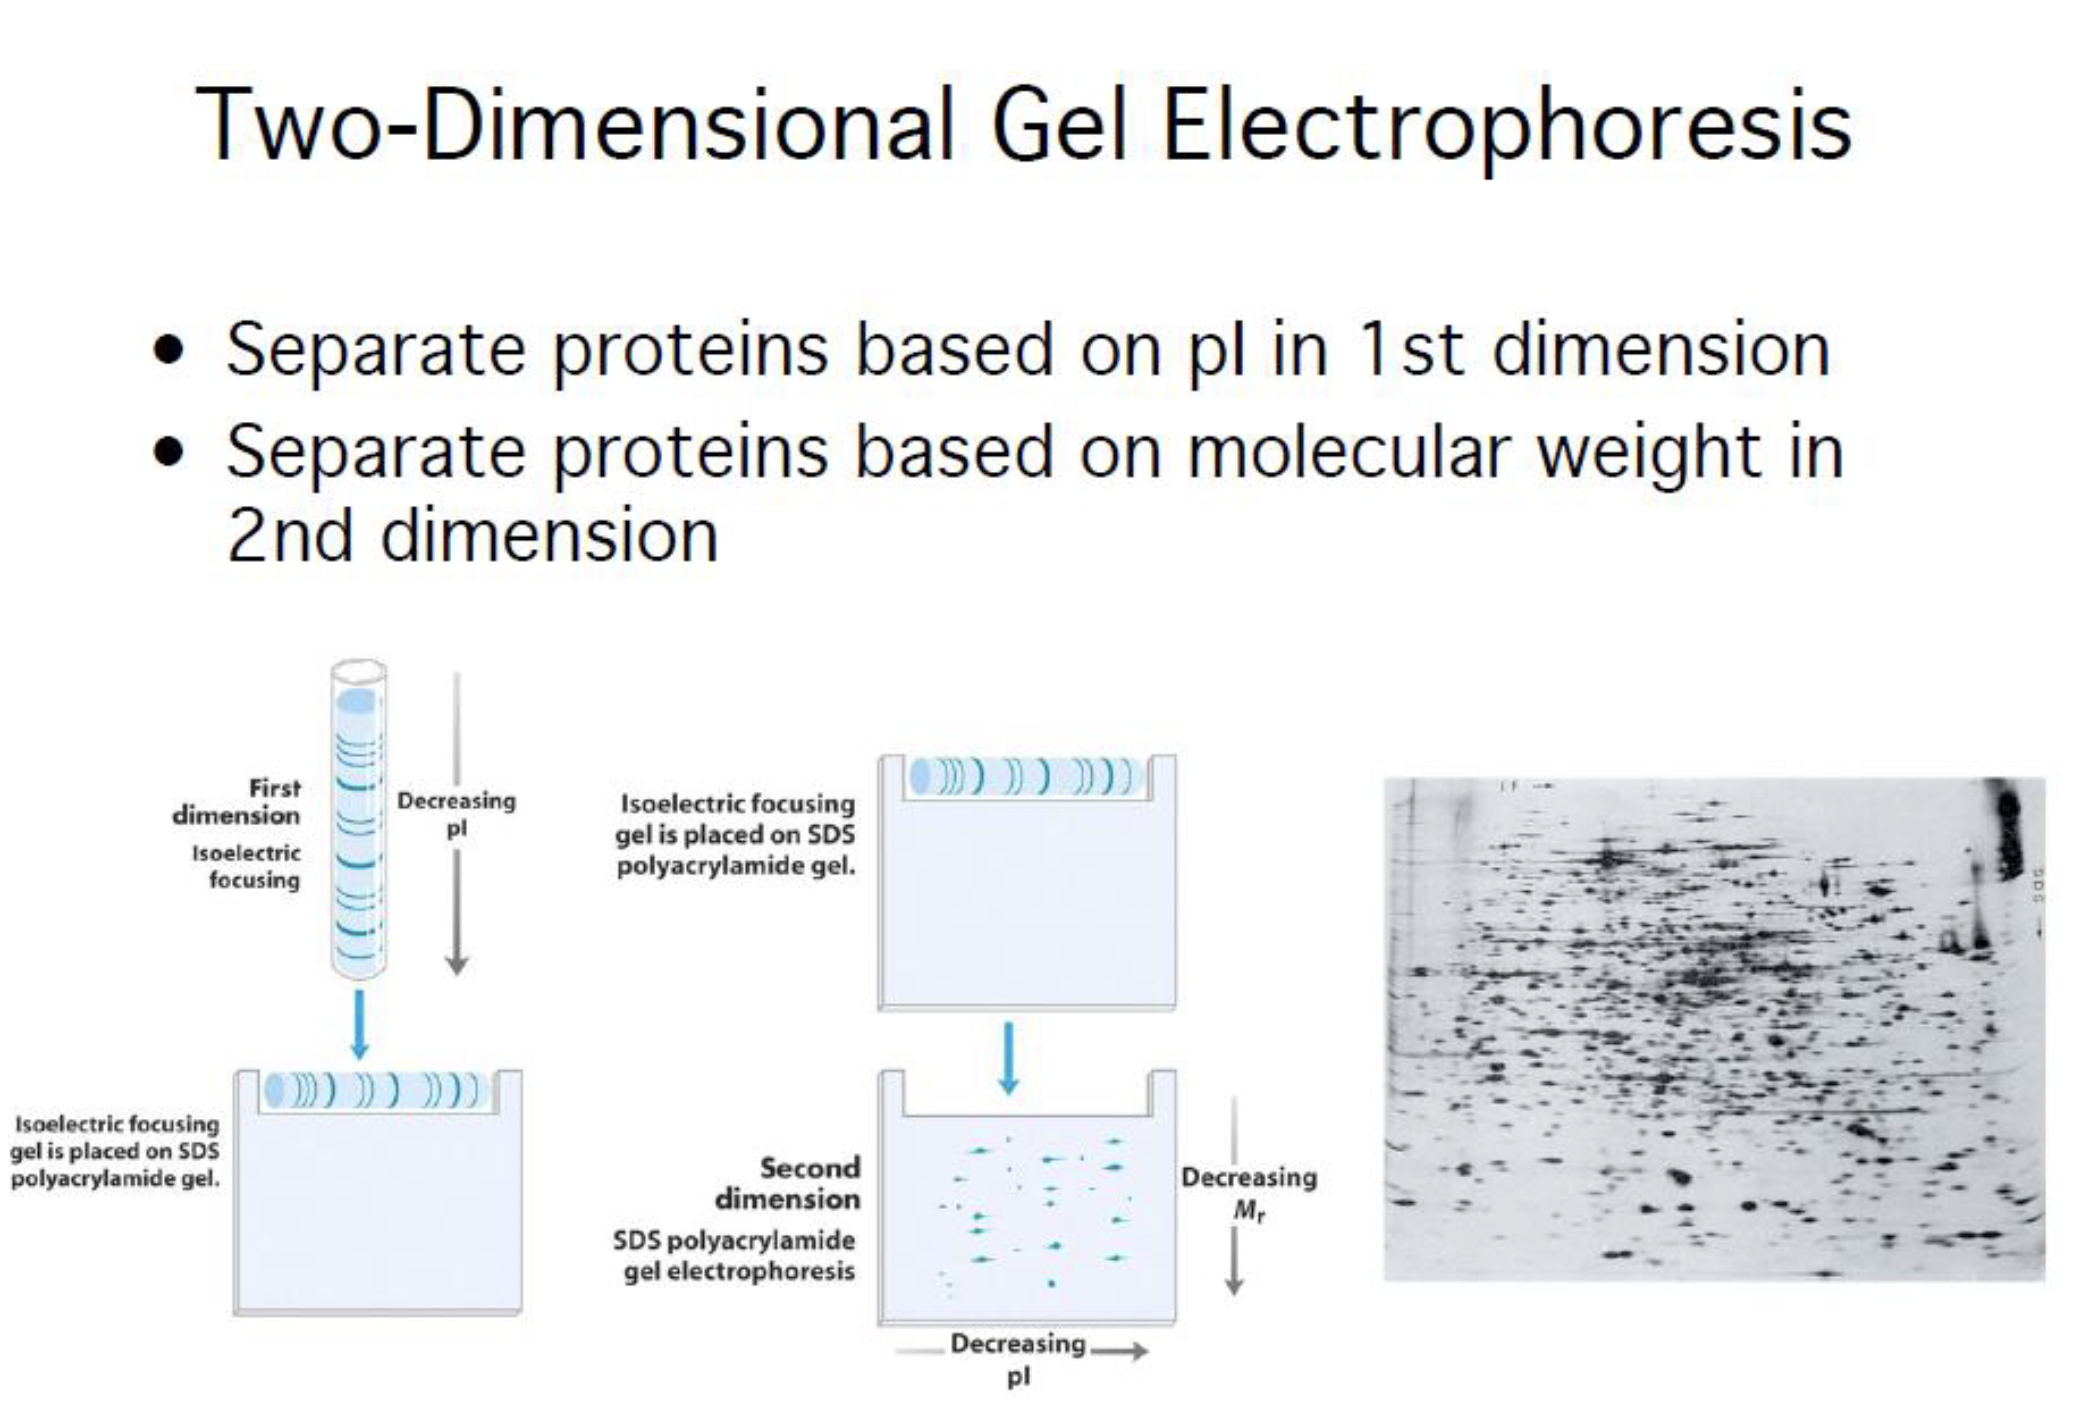
- 2D gel electrophoresis
- Powerful gel-based method commonly used to analyze complex samples
- To characterize full range of proteins in the sample, not just a few specific proteins
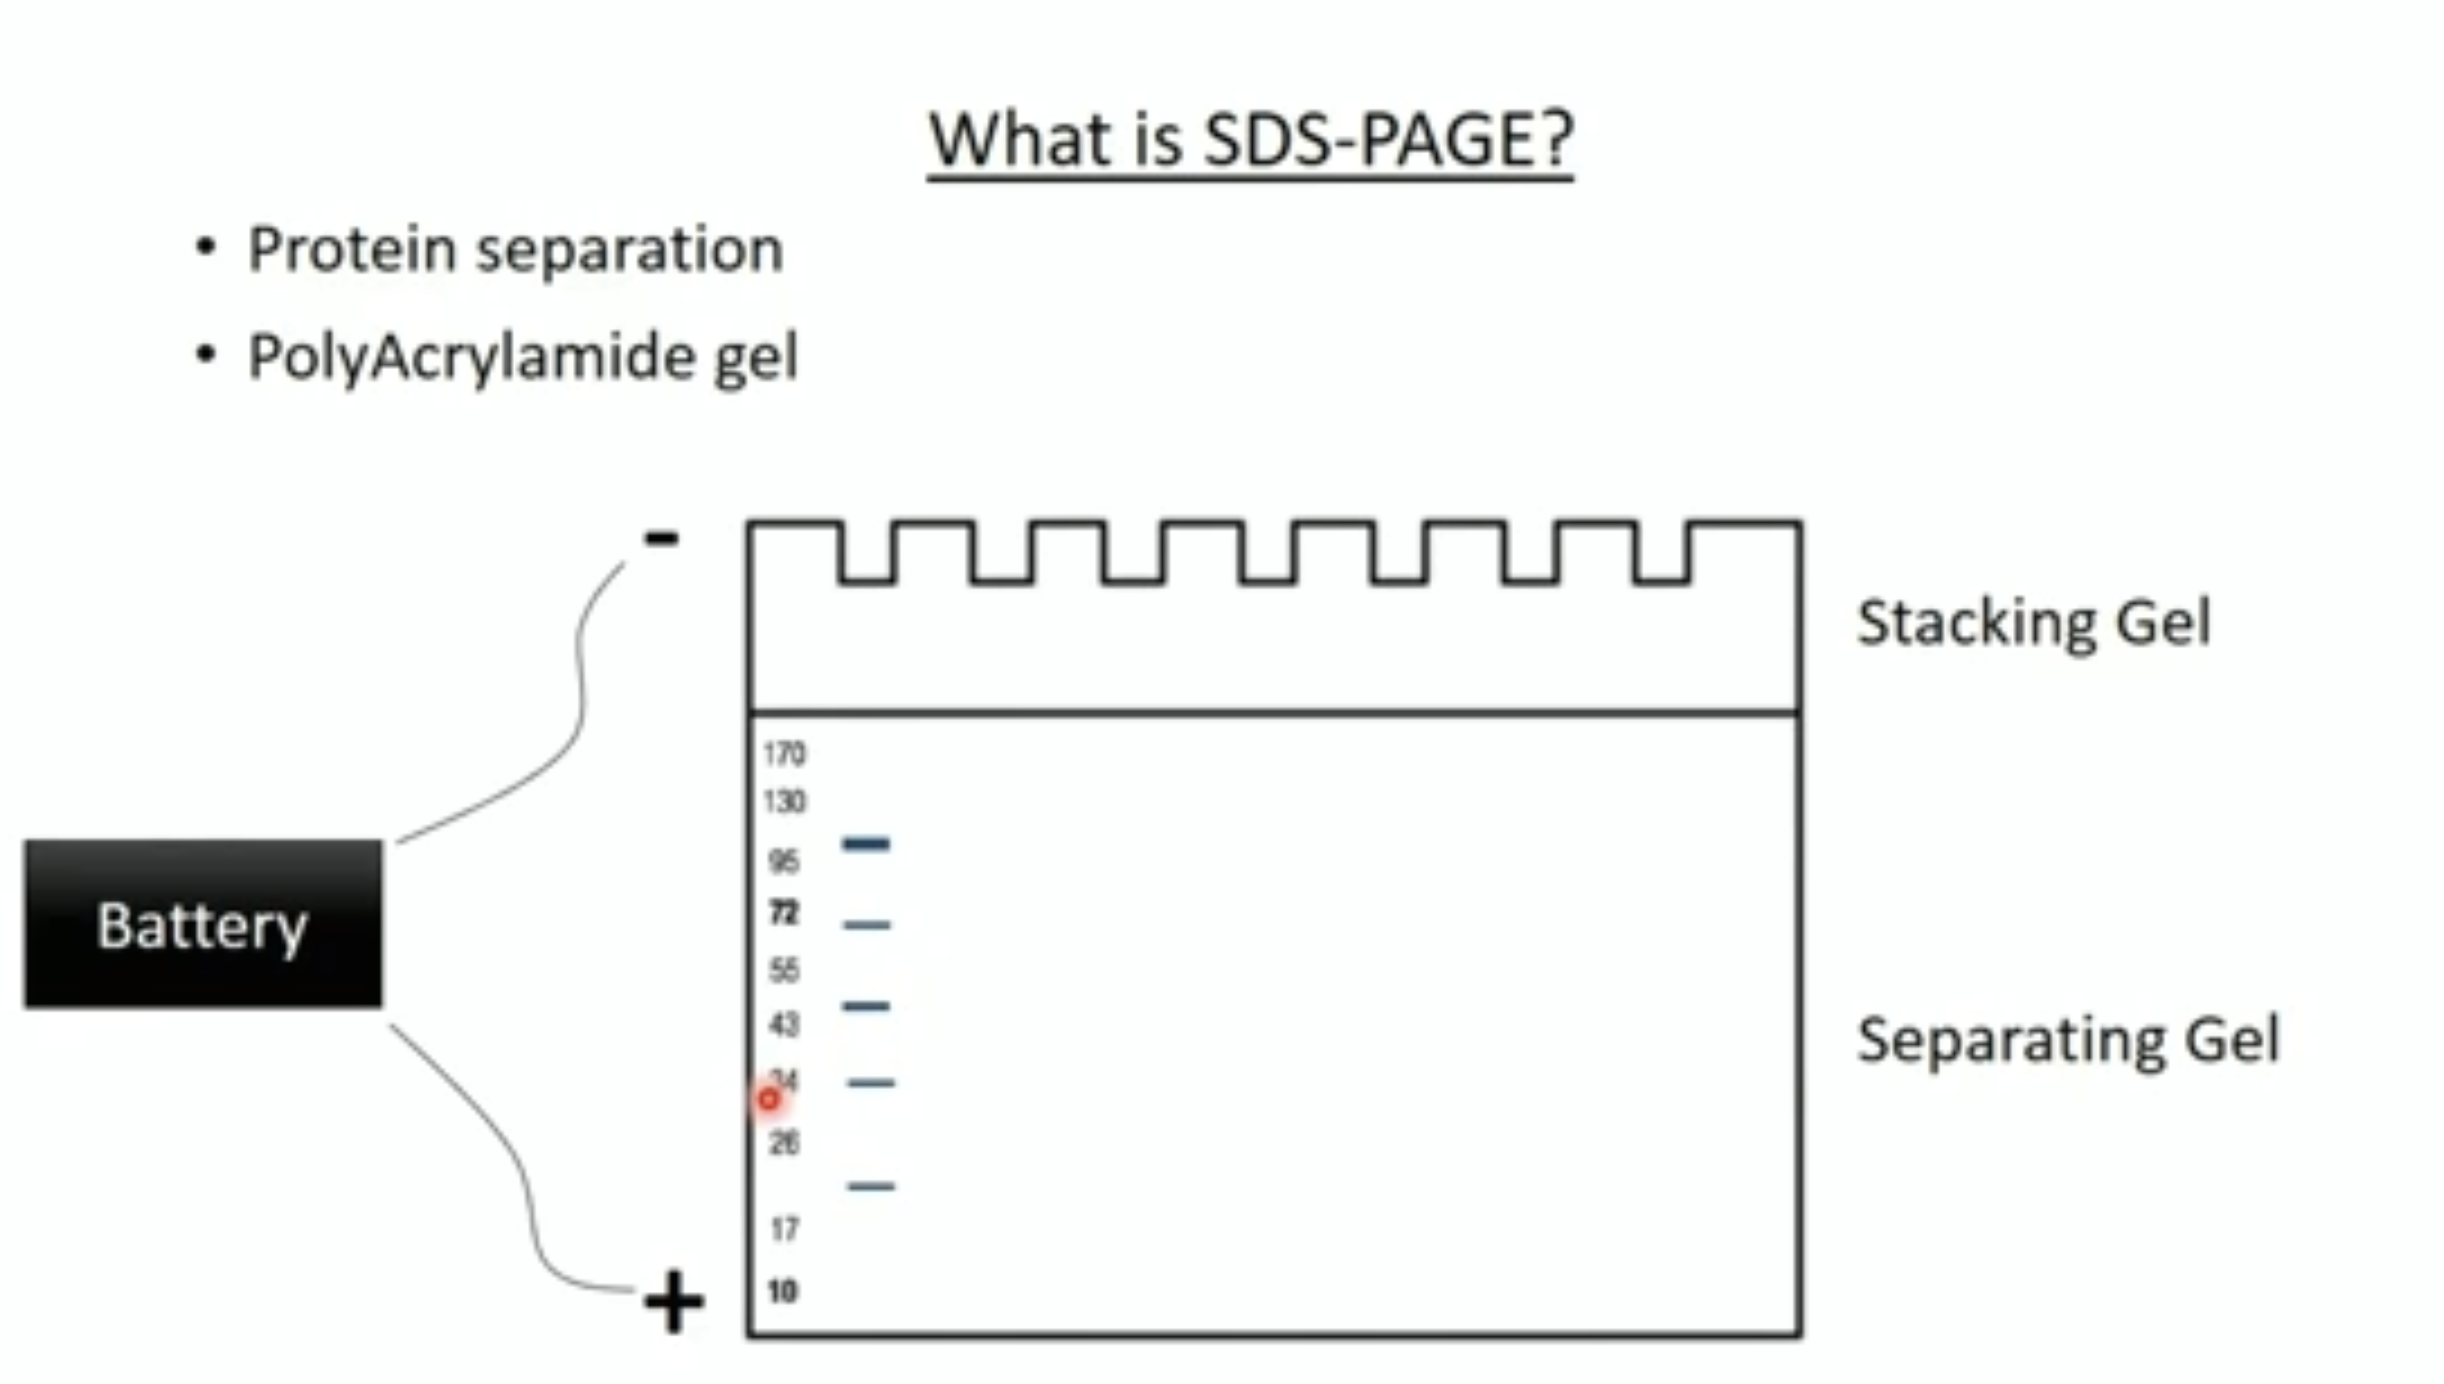
SDS-PAGE:
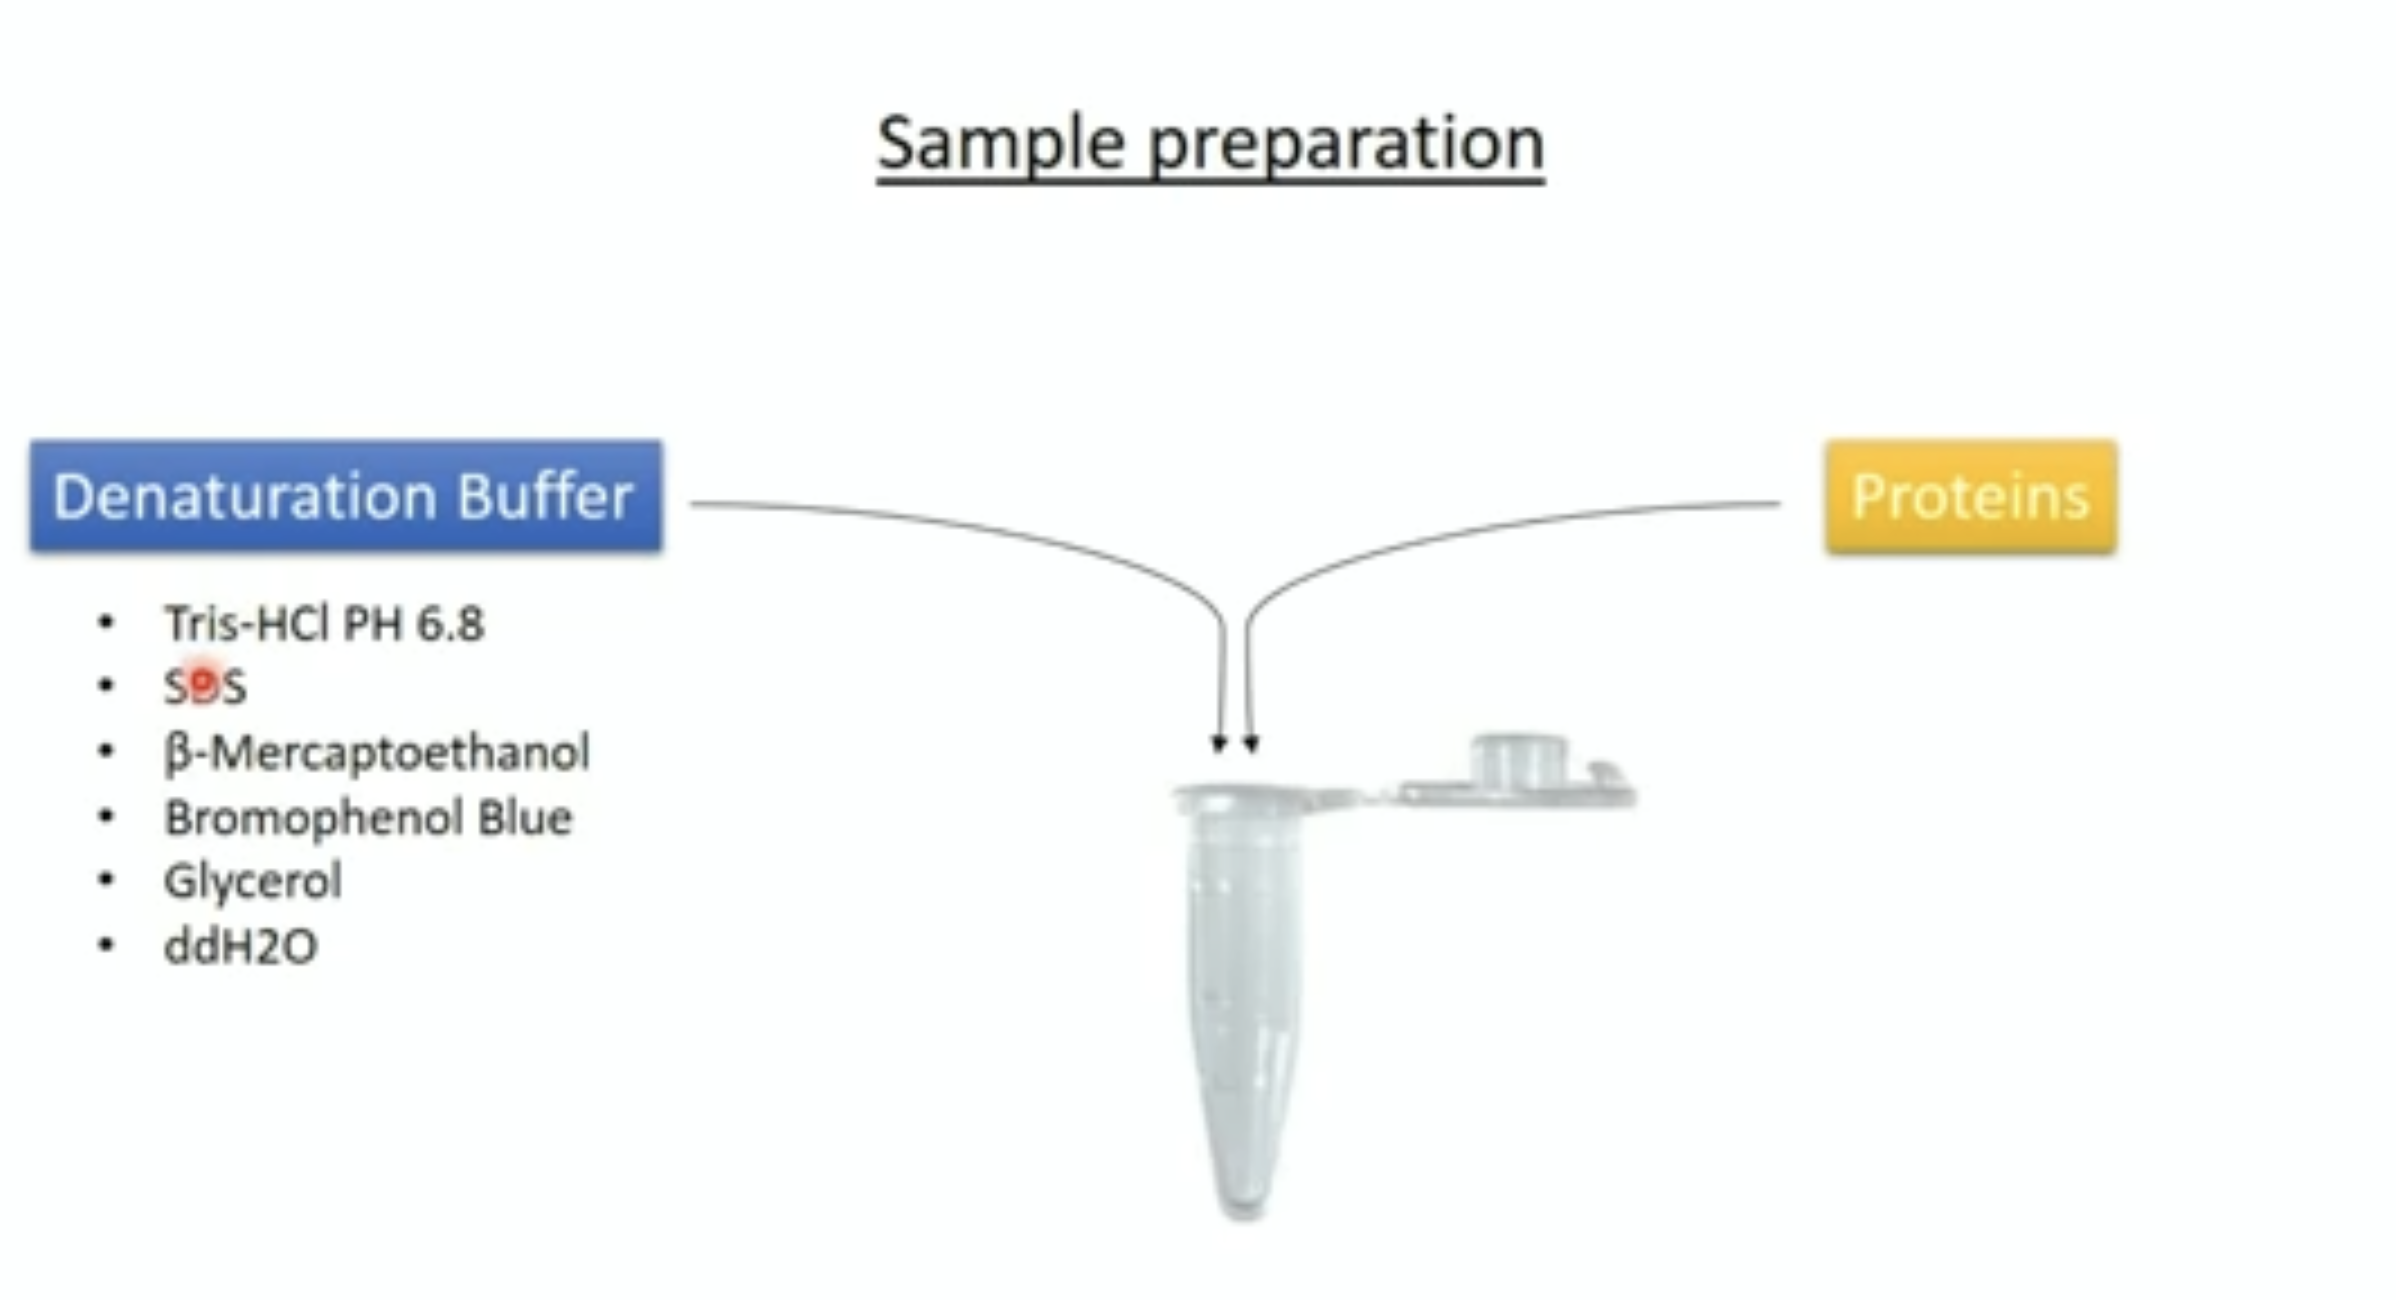
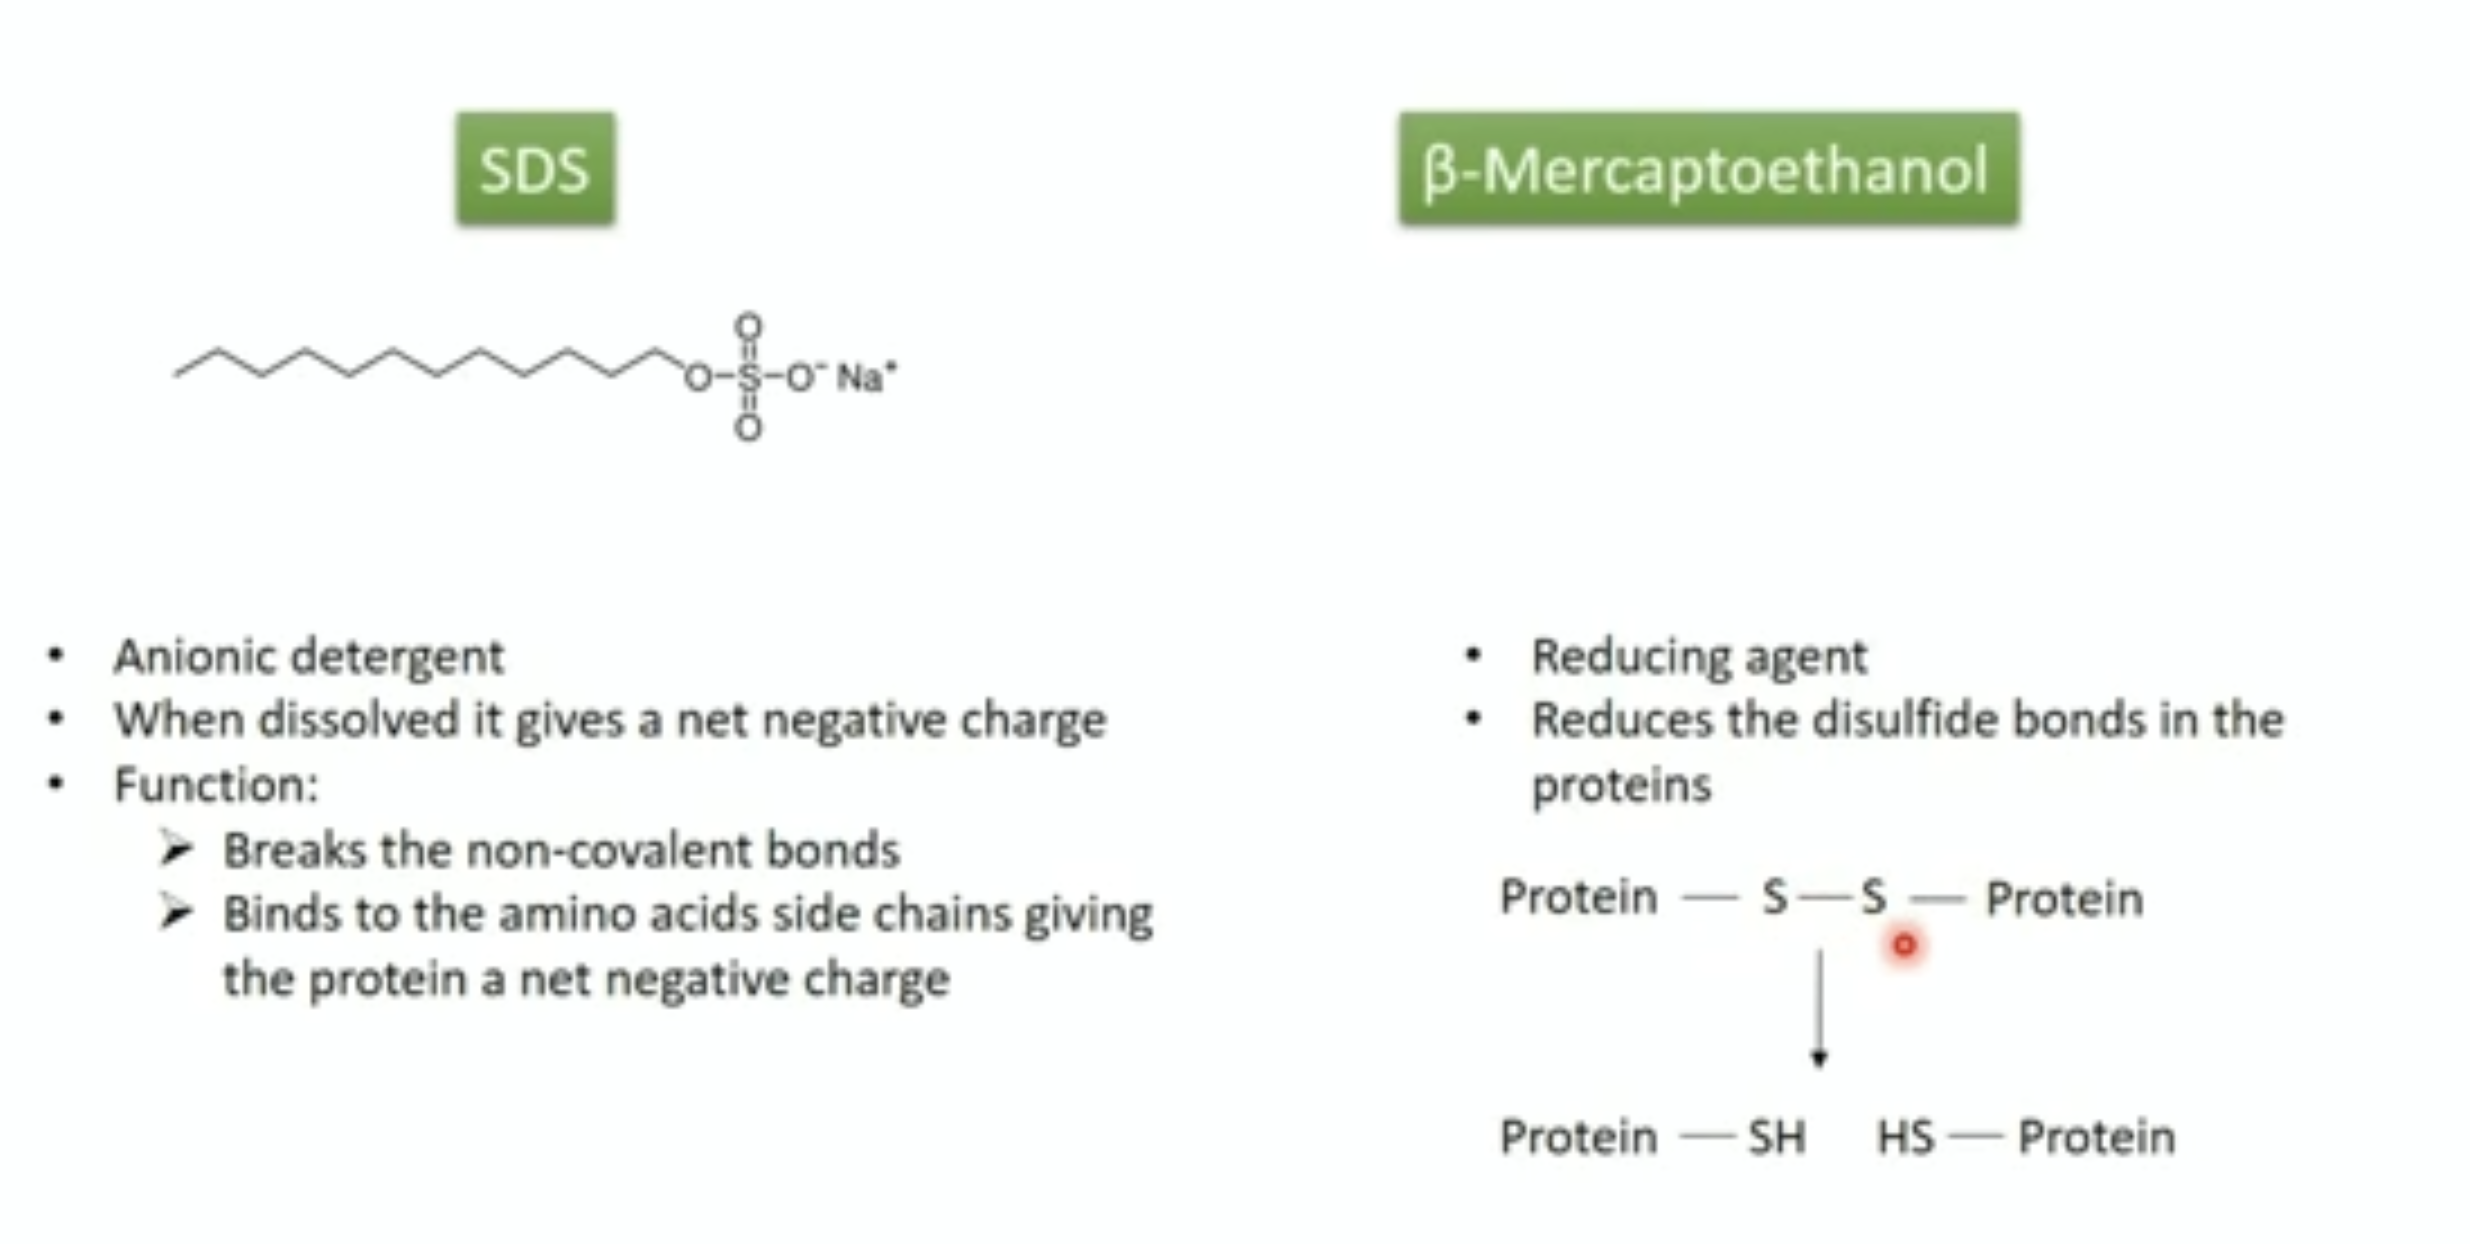
- Proteins are usually mixed with the detergent, SDS and a tracking dye to make the sample
- SDS binds to the protein and gives it size-dependent negative charge and consistent hydrodynamic properties
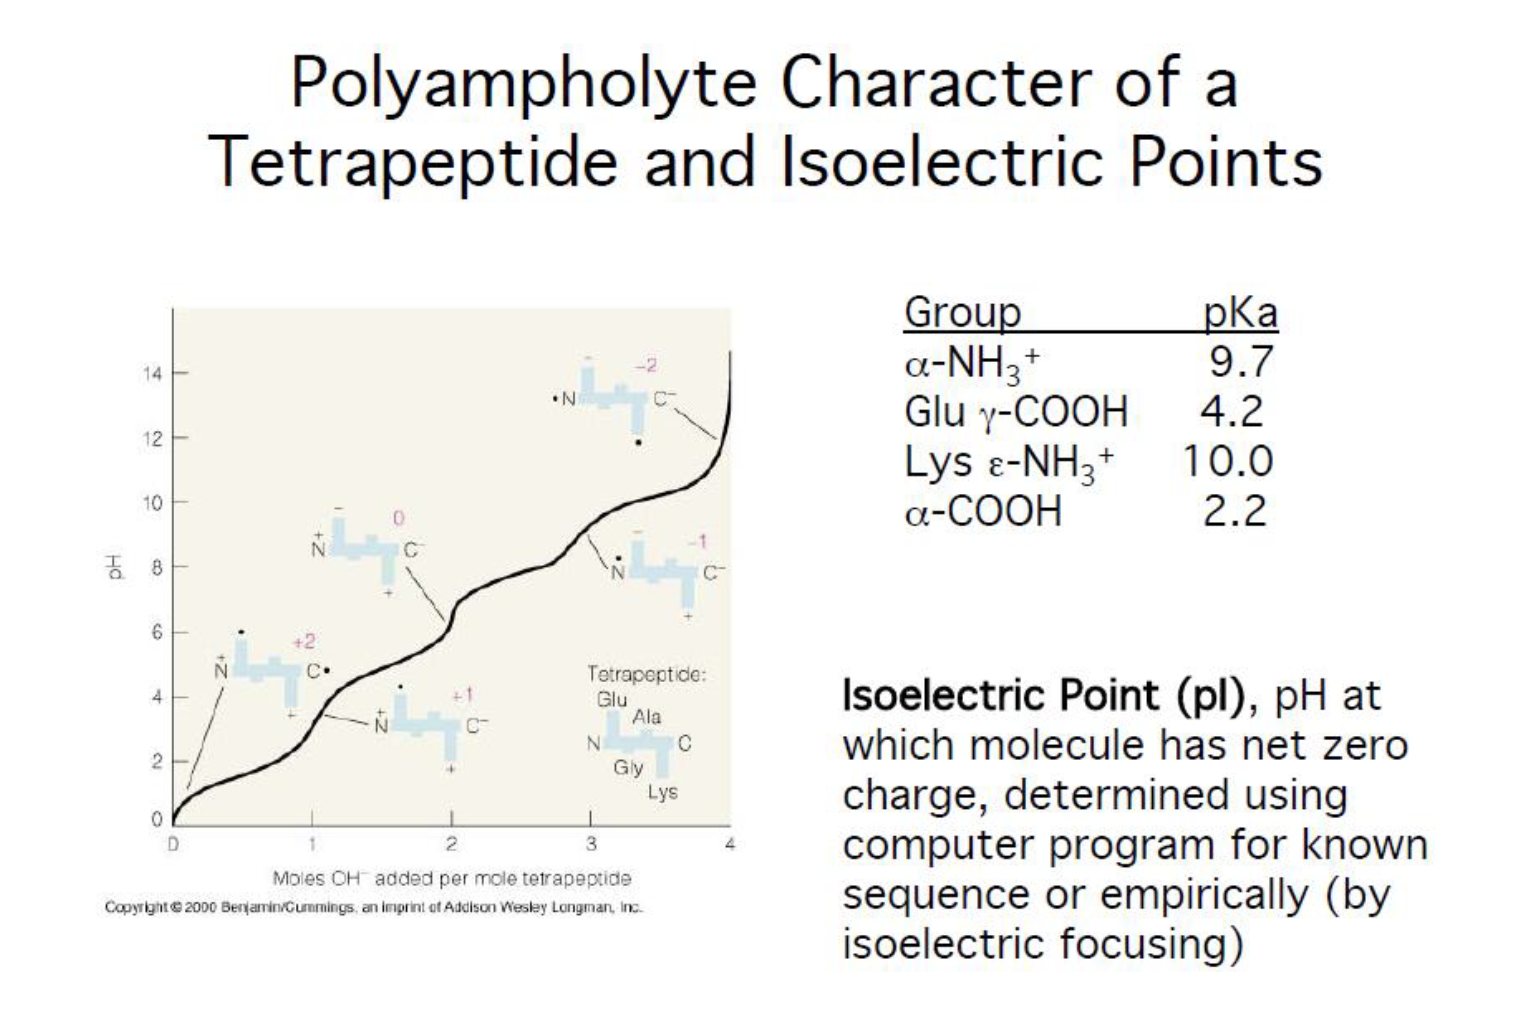
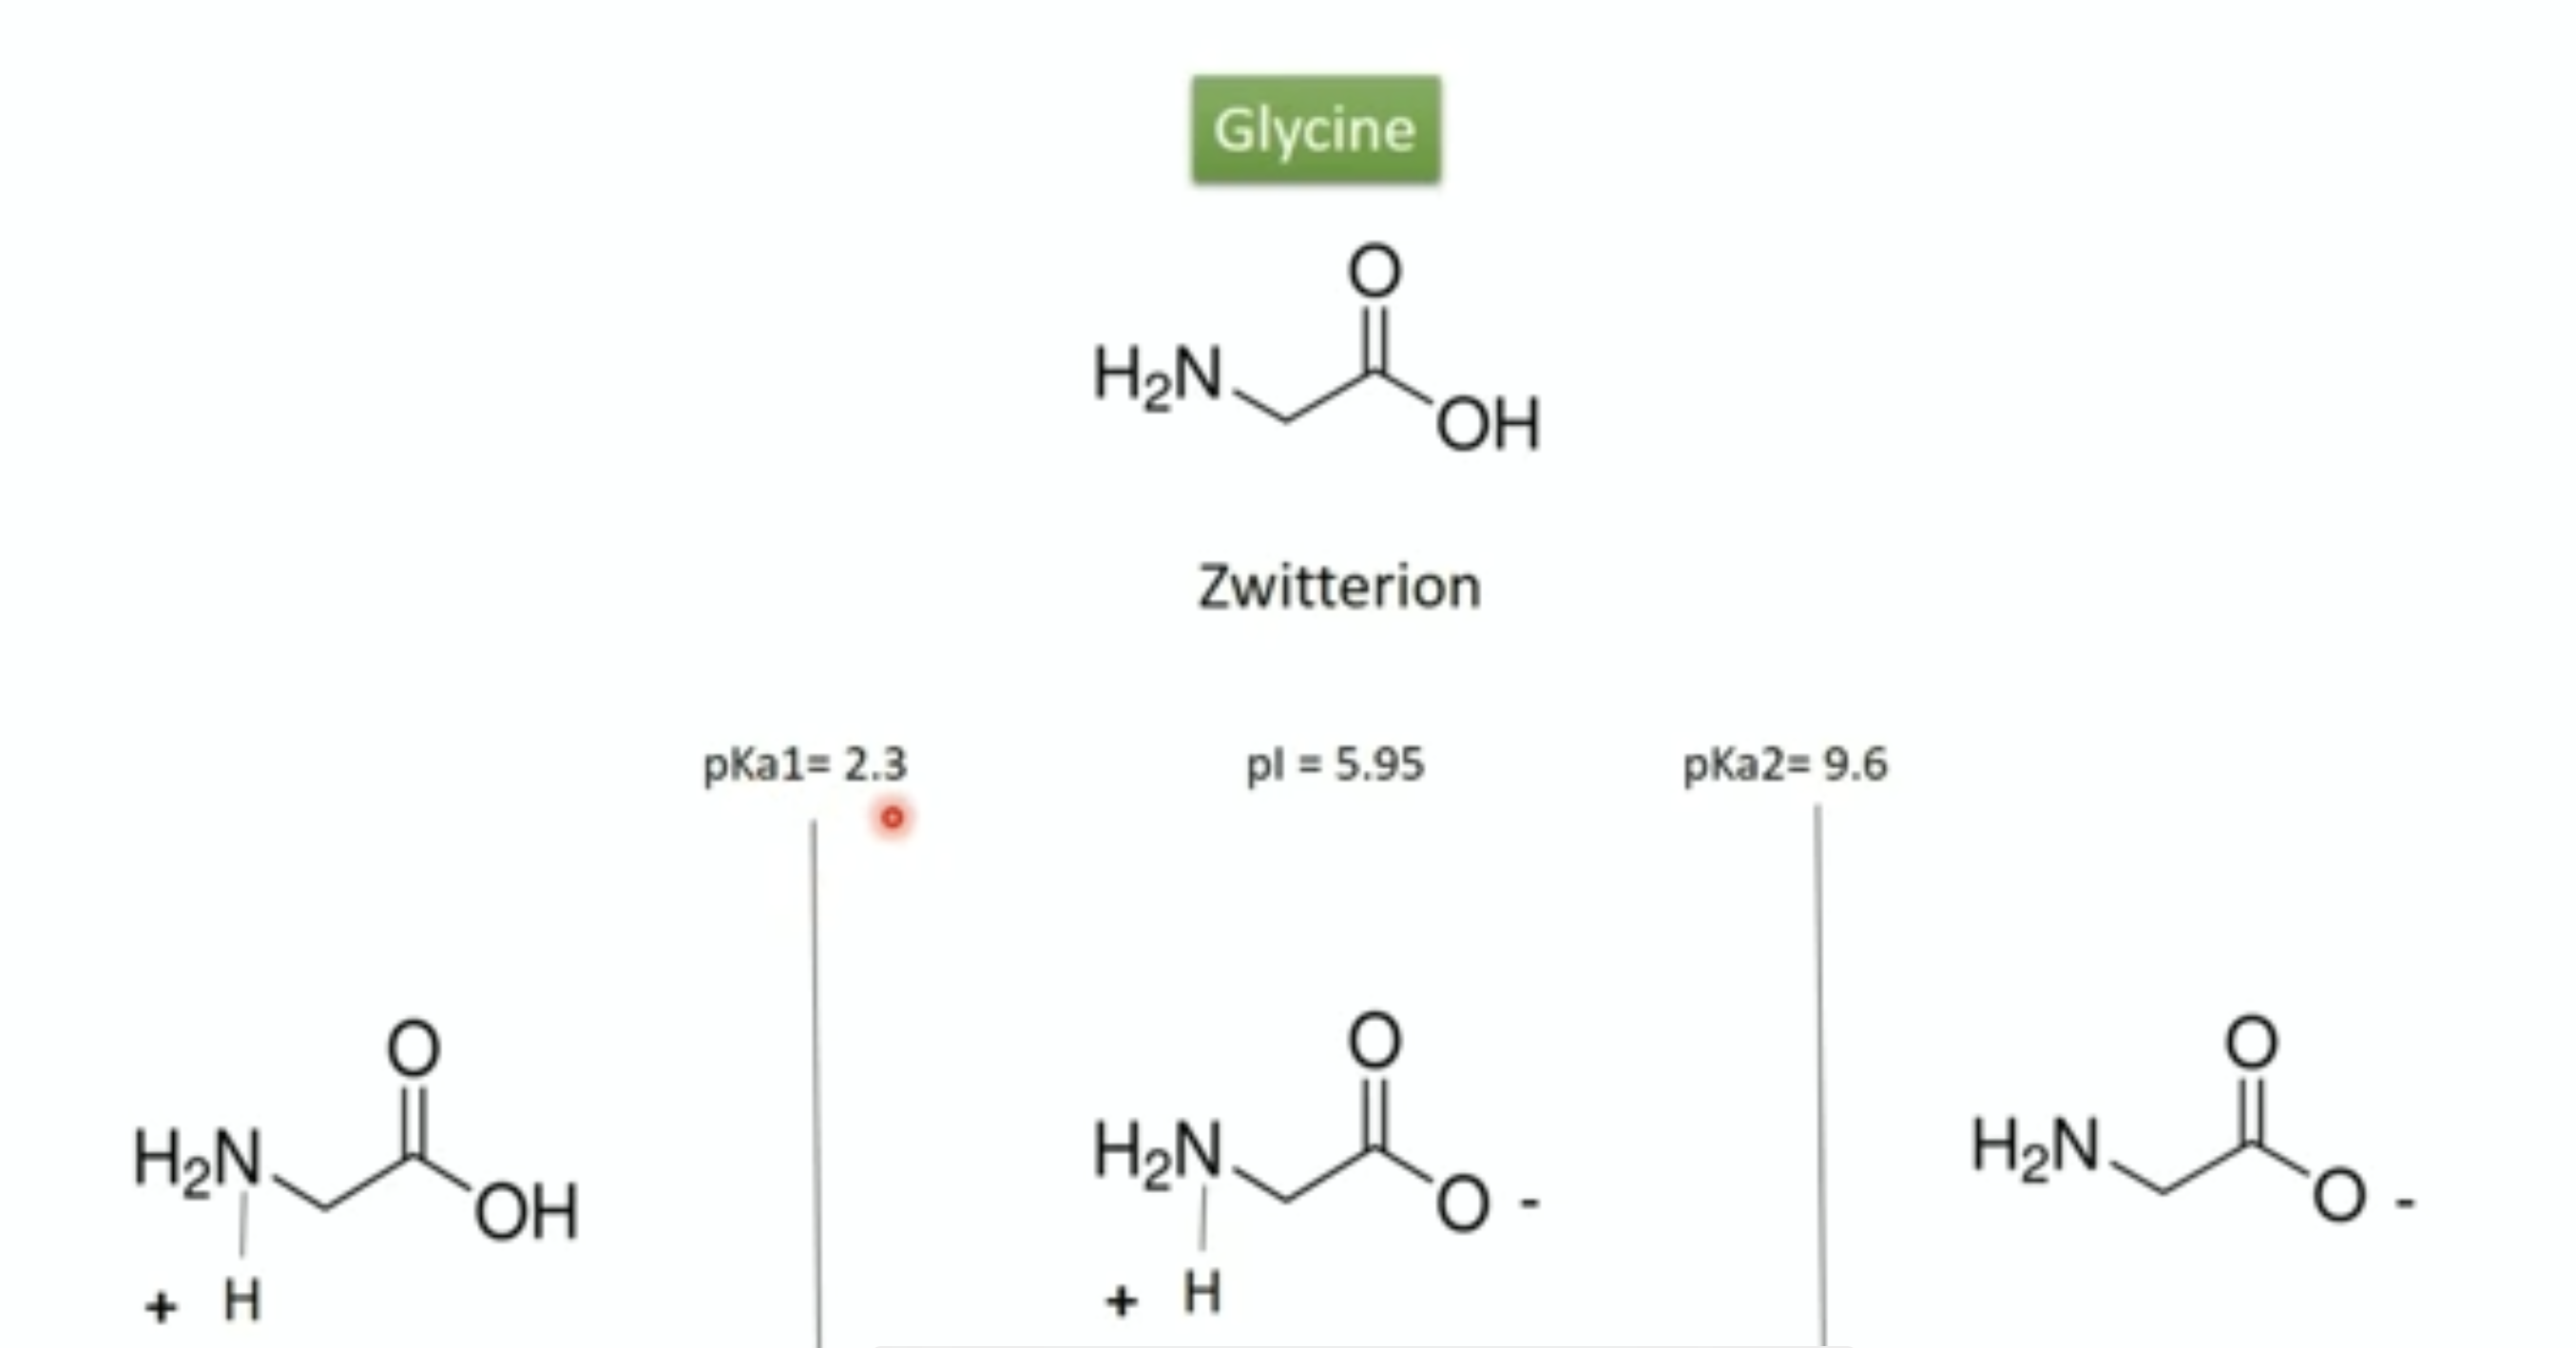
Isoelectric point (pi)
- ph at which molecule has net zero charge (determined using computer program for known sequence or empirically )
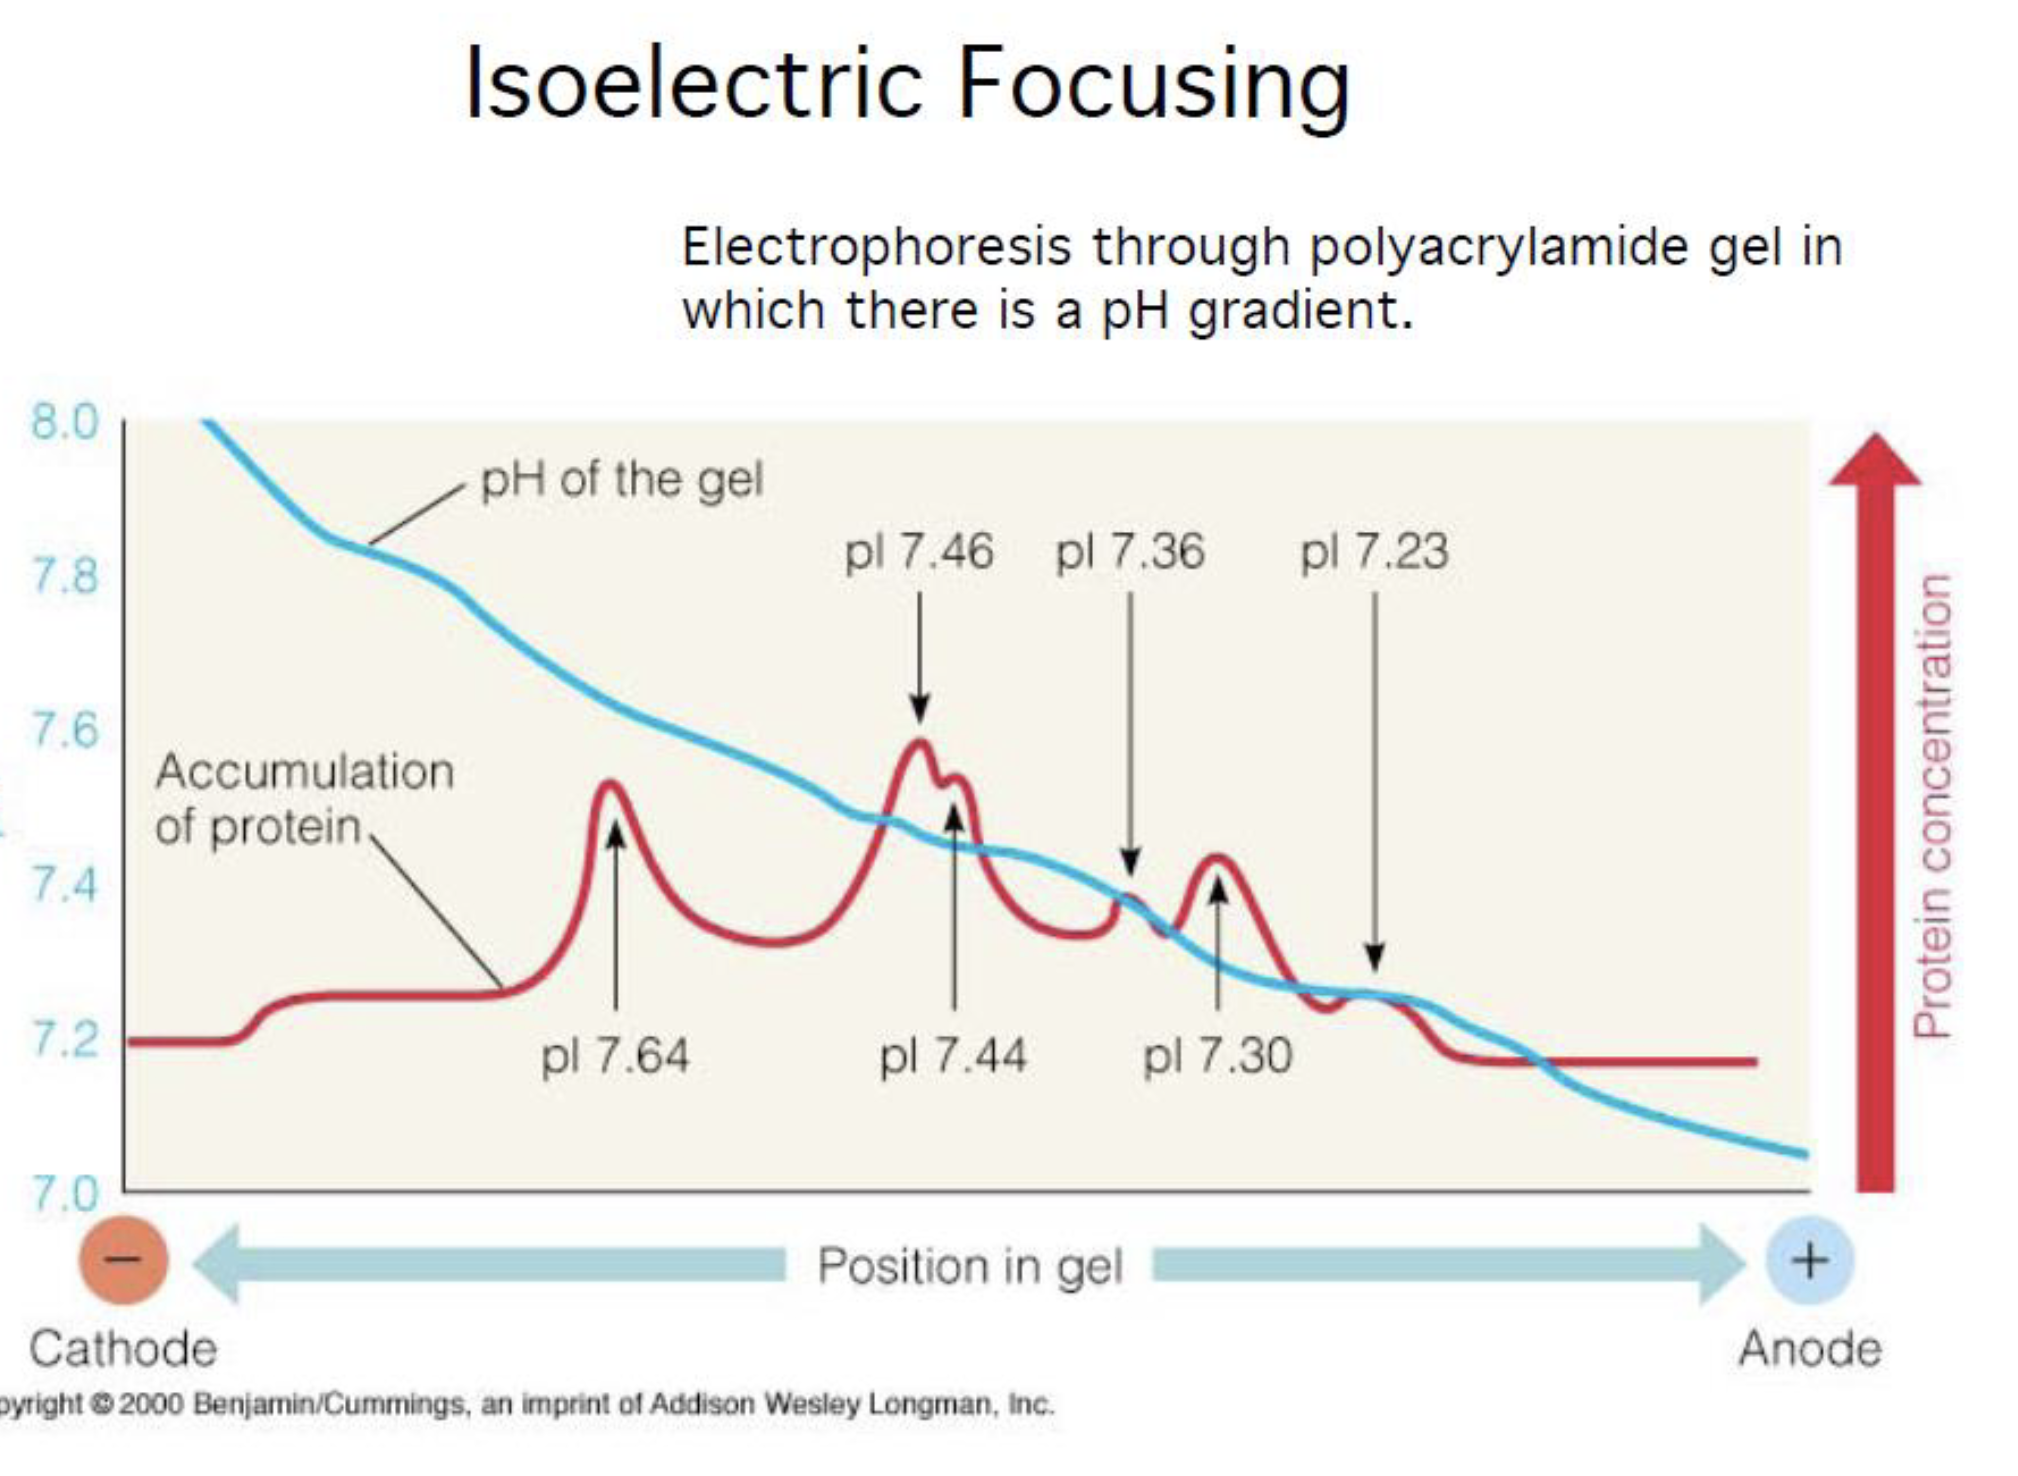
Isoelectric Focusing
Electrophoresis through polyacrylamide gel in which there is a pH gradient
2D gel
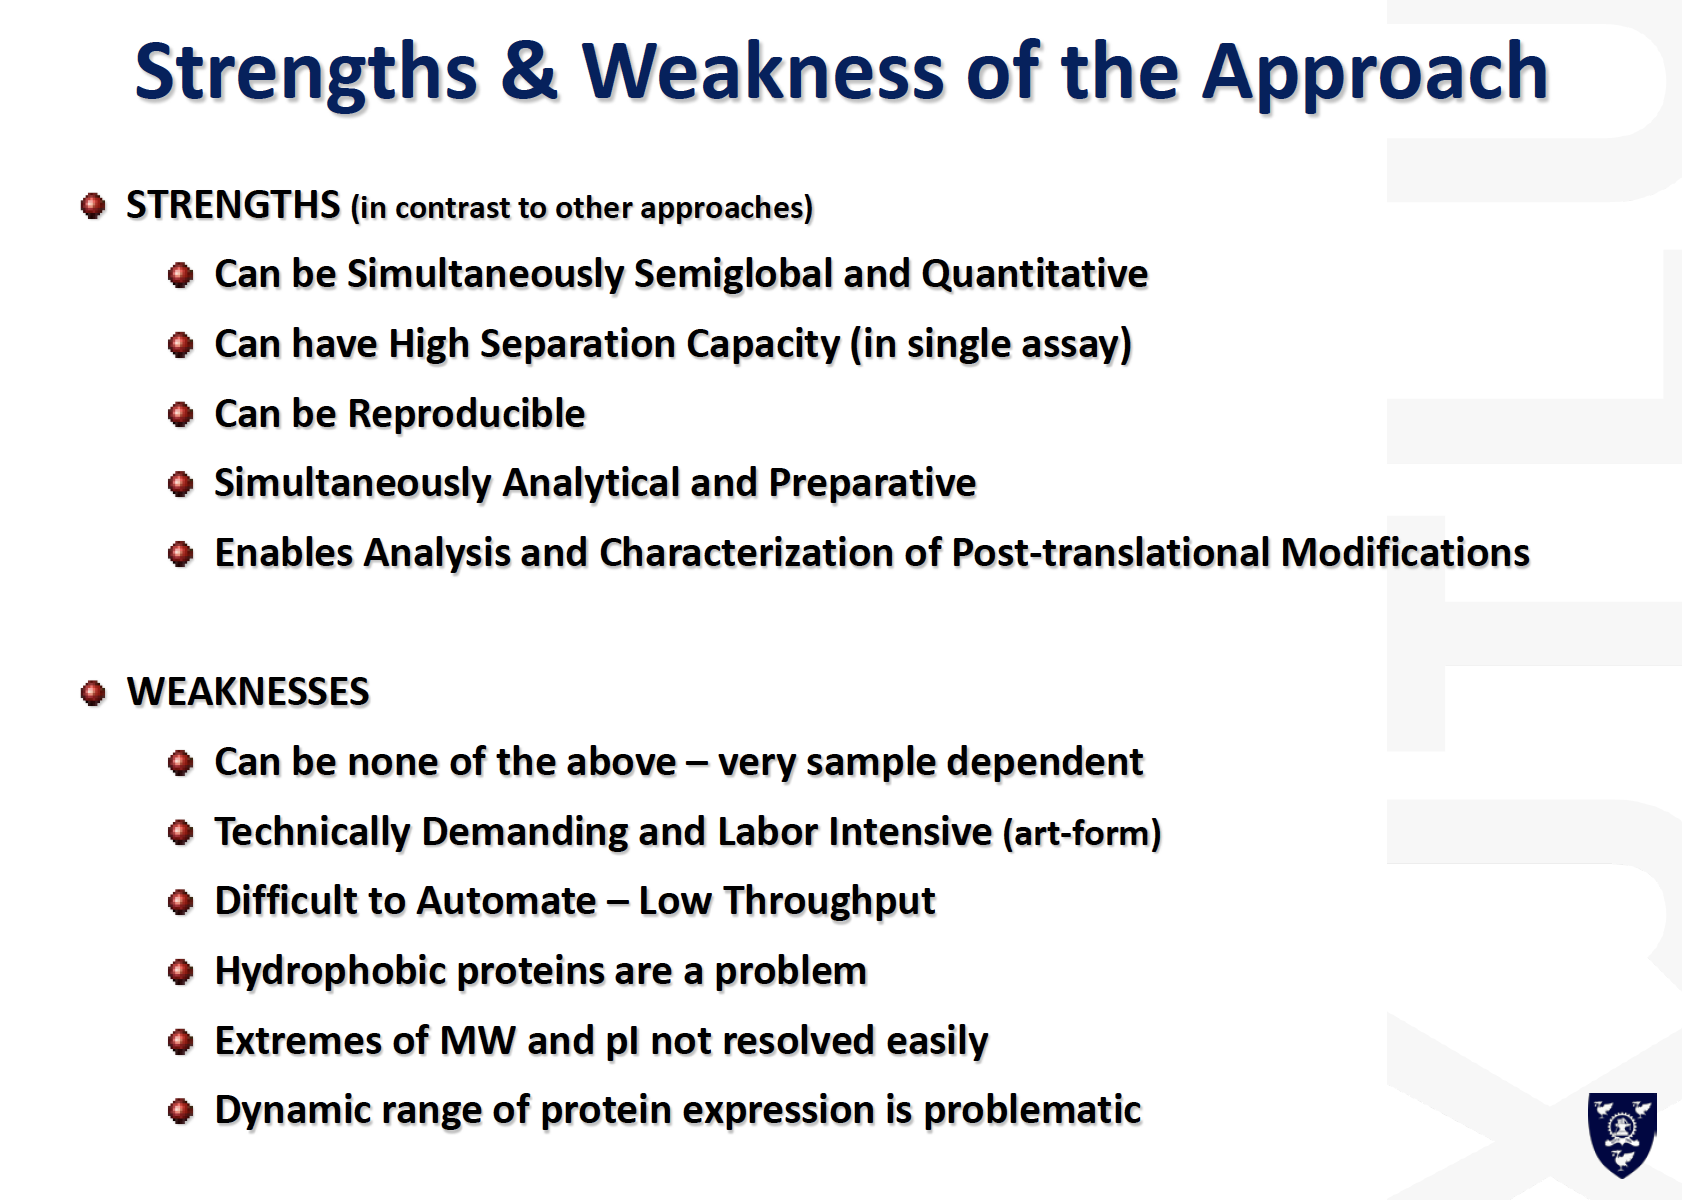
Strength and weakness of the 2D gel
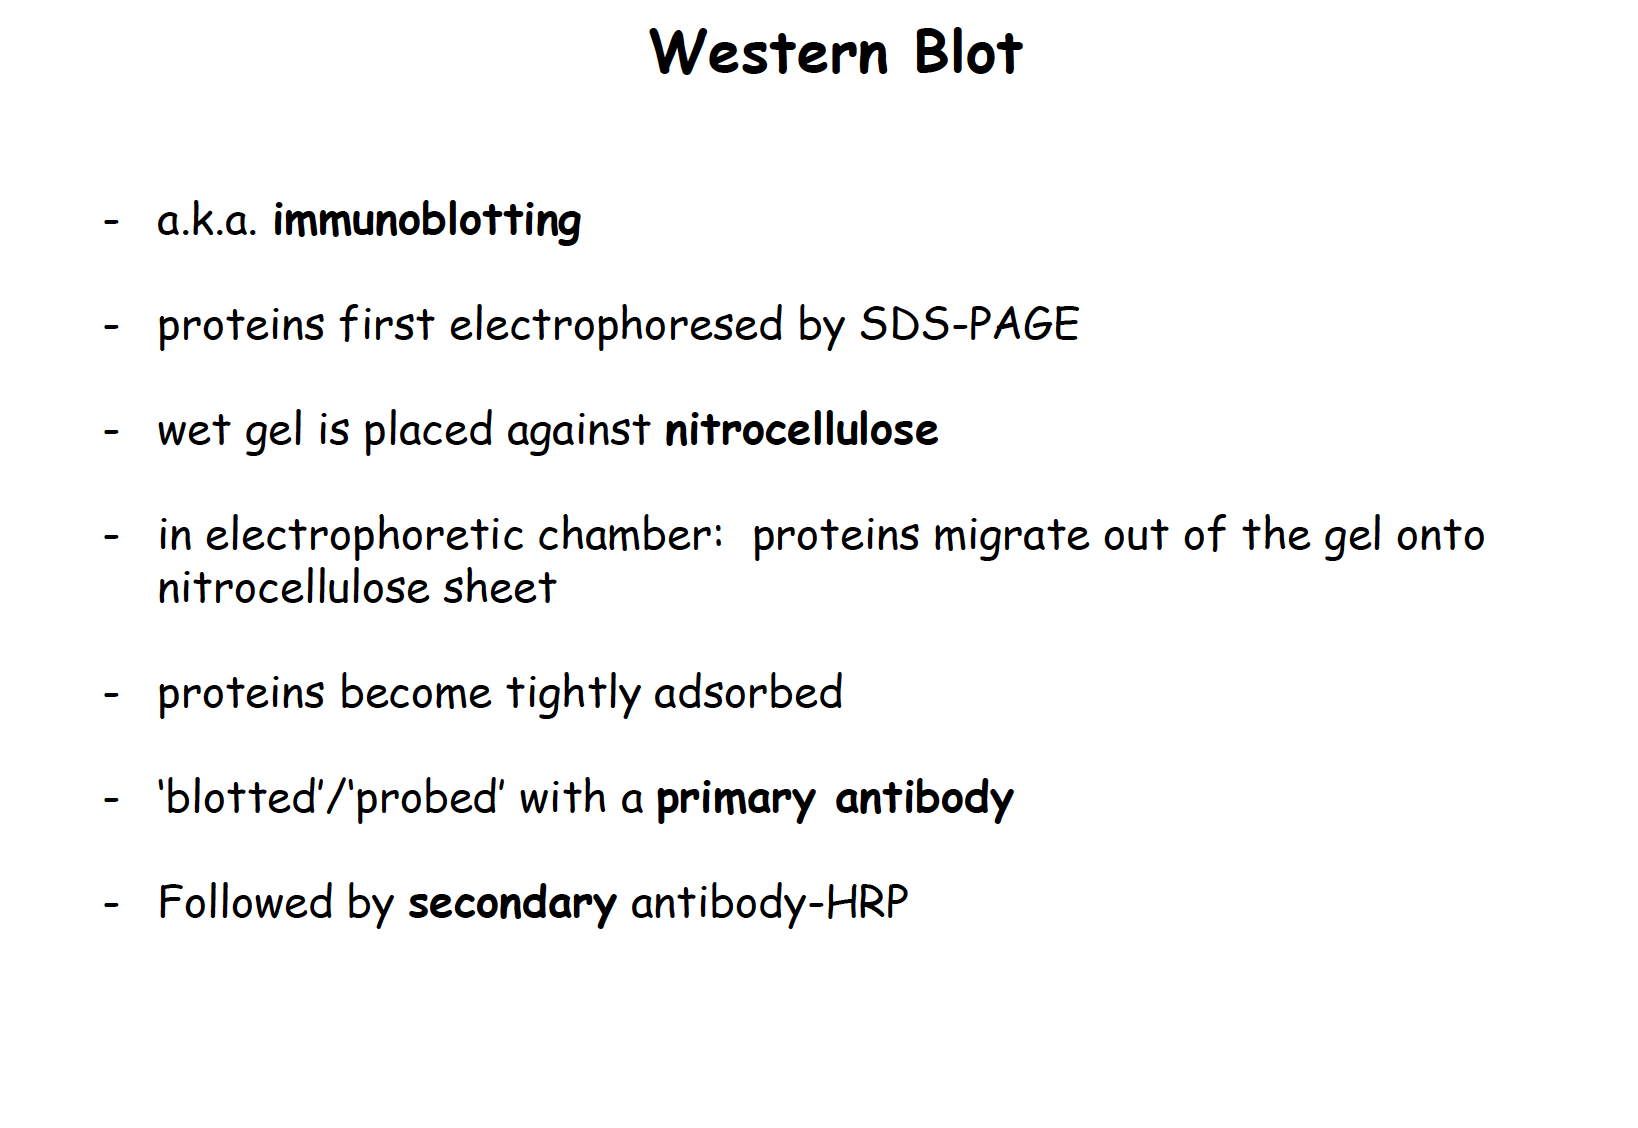
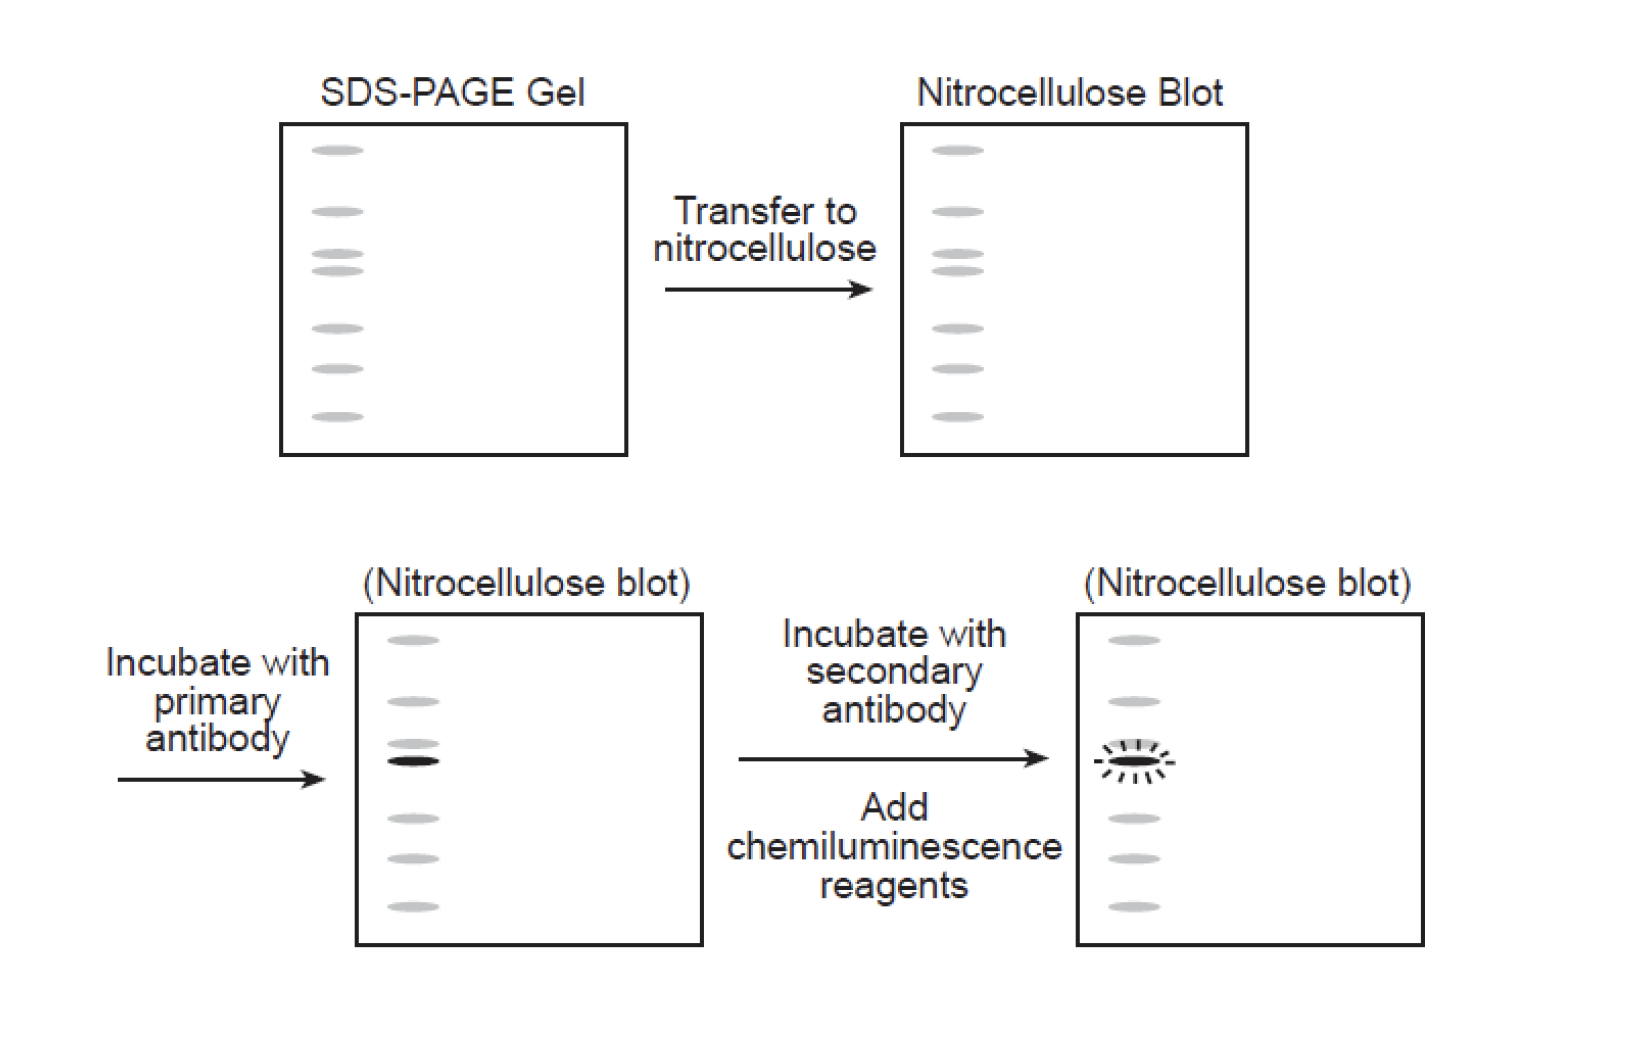
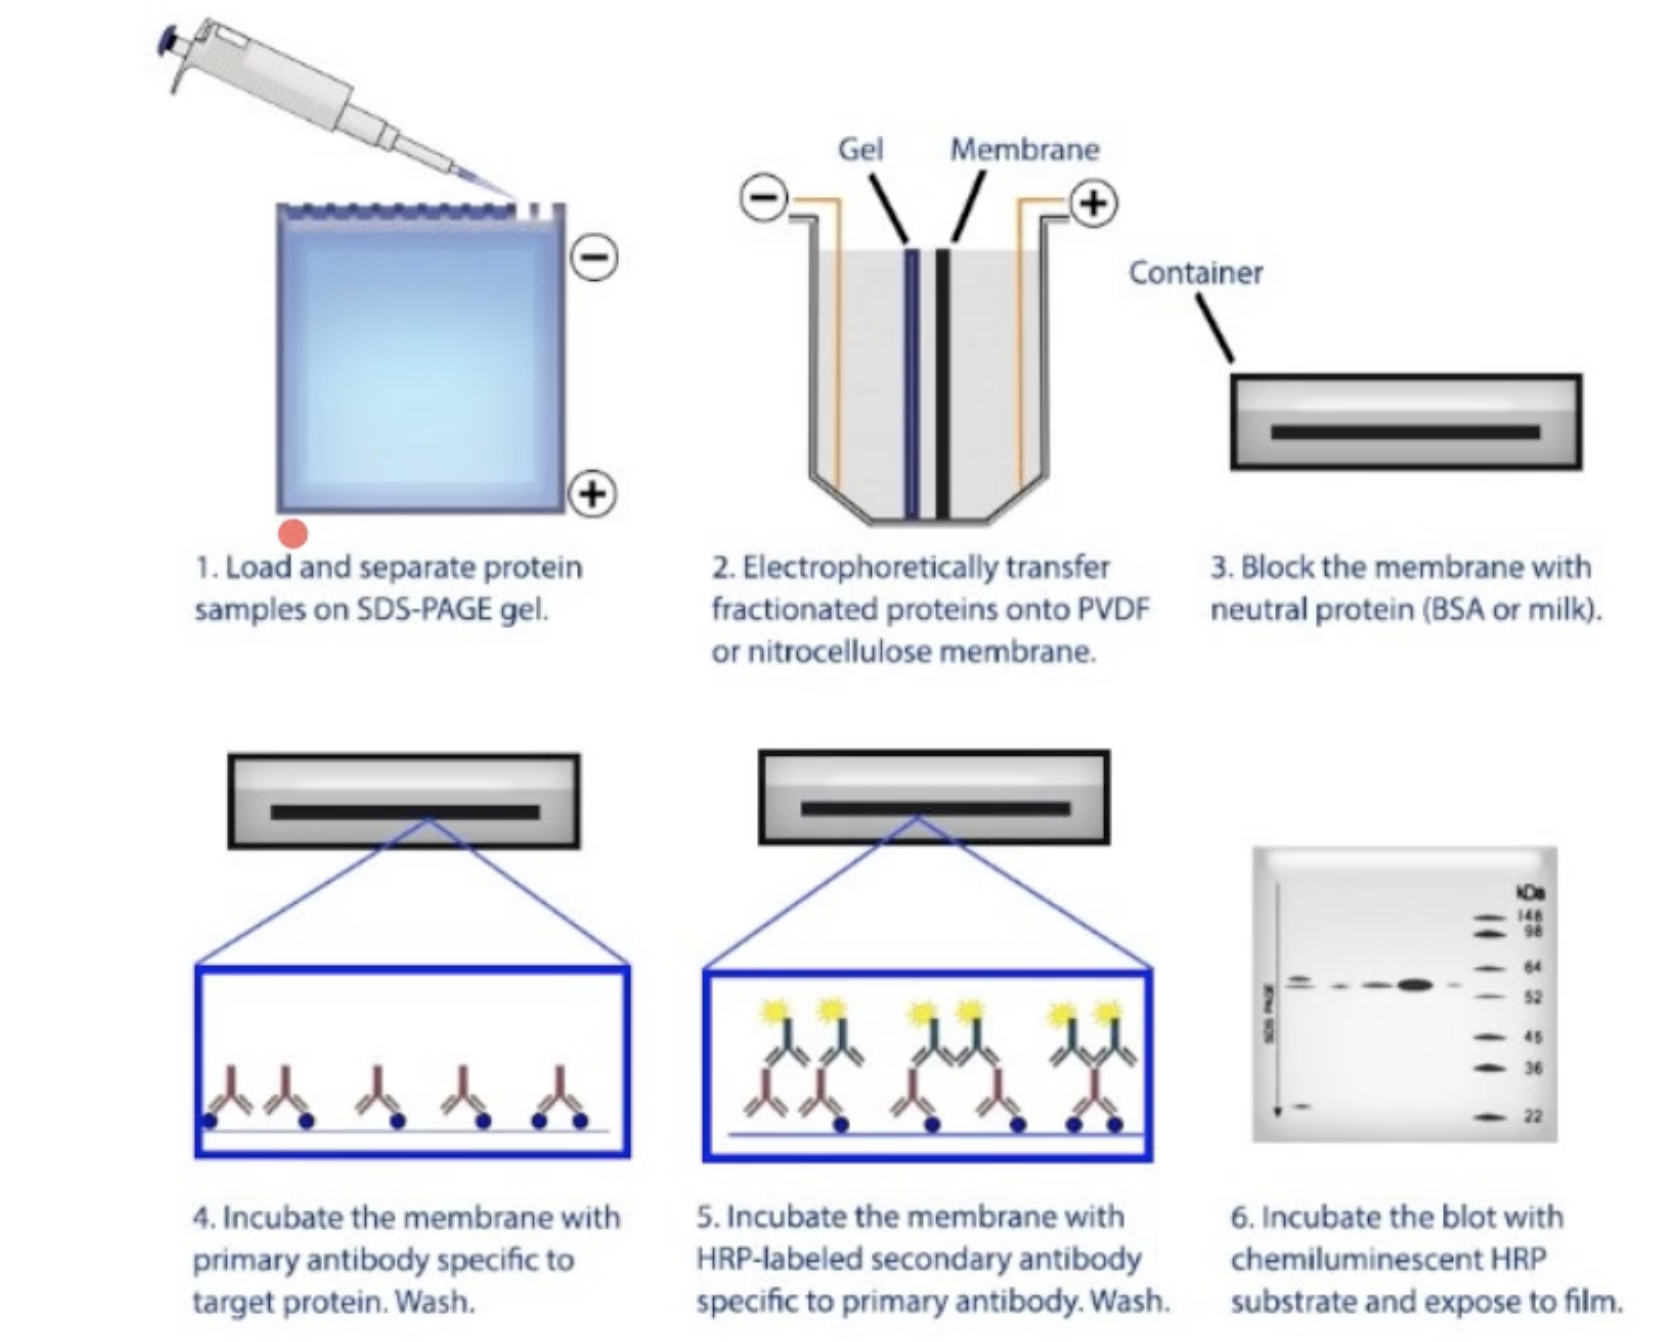
Western Blot
a.k.a: immunoblotting
- Proteins first electrophoreses by SDS-PAGE
- Wet gel is placed against nitrocellulose
- In electrophoretic chamber:
Salting out (precipitation in protein fraction)
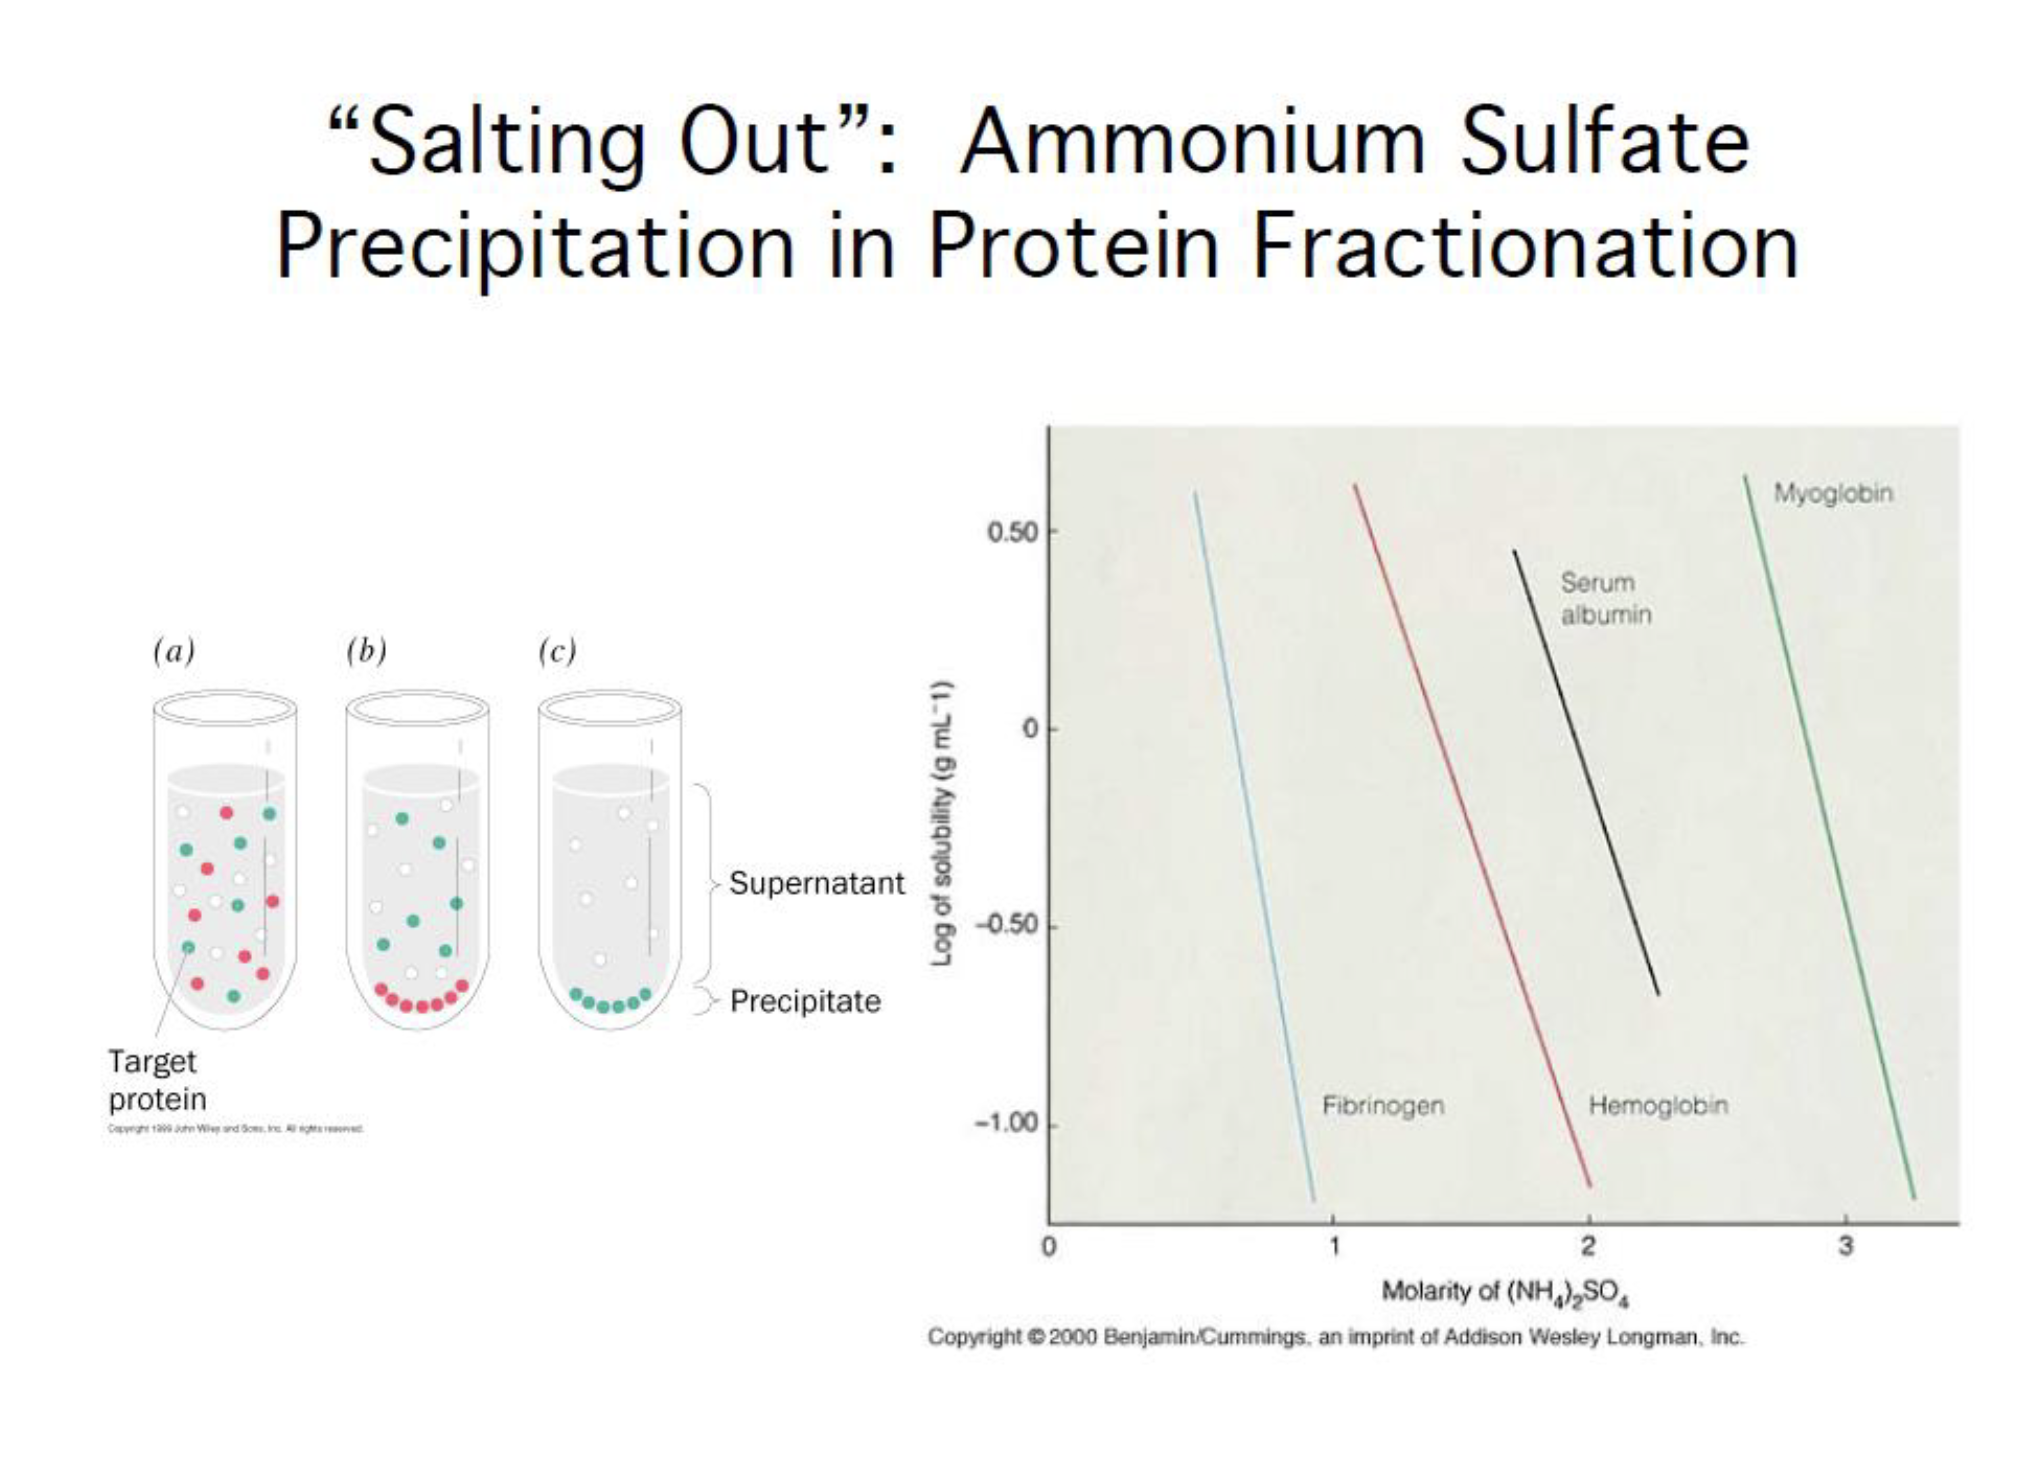
Ammonium sulfate precipitation is one of the most commonly used methods for protein purification from a solution.
In solution, proteins form hydrogen bonds with water molecules through their exposed polar and ionic groups. When high concentrations of small, highly charged ions such as ammonium sulfate are added, these groups compete with the proteins to bind to the water molecules.
This removes the water molecules from the protein and decreases its solubility, resulting in precipitation.
Critical factors that affect the concentration at which a particular protein will precipitate include: the number and position of polar groups, molecular weight of the protein, pH of the solution, and temperature at which the precipitation is performed.
The concentration at which antibodies precipitate varies among species; most rabbit antibodies precipitate with a 40% saturated solution, whereas mouse antibodies require 45-50% saturation.
Protocol
- Allow serum or ascitic fluid to thaw, determine total volume, and centrifuge at 3000g for 30 minutes.
- Transfer sample to a beaker containing a stir bar and place on a magnetic stirrer.
- While the sample is stirring, slowly add saturated ammonium sulfate to bring the final concentration to 50% saturation.
- Volume of ammonium sulfate needed is equal to the volume of sample.
- Adding the ammonium sulfate very slowly ensures that local concentration around the site of addition does not exceed the desired salt concentration.
- Once the total volume of ammonium sulfate is added, move beaker to 4°C for 6 hours or overnight.
- Transfer to conical tube and centrifuge the precipitate at 3000g for 30 minutes.
- Carefully remove and discard supernatant. Invert conical tube and drain well. For serum or ascites, resuspend pellet in 30%-50% of the starting volume in 1XPBS. For monoclonal antibody tissue culture supernatants, resuspend pellet in 10% of the starting volume in 1X PBS.
- Transfer antibody solution to dialysis tubing and dialyze versus three changes of 1XPBS/0.08% Sodium Azide. Be sure to allow enough space for expansion of the antibody solution during dialysis. Normally twice the re-suspended volume is sufficient.
- Remove antibody solution from the tubing and centrifuge to remove any remaining debris.
- Determine the concentration and store at -80°C for long-term storage.
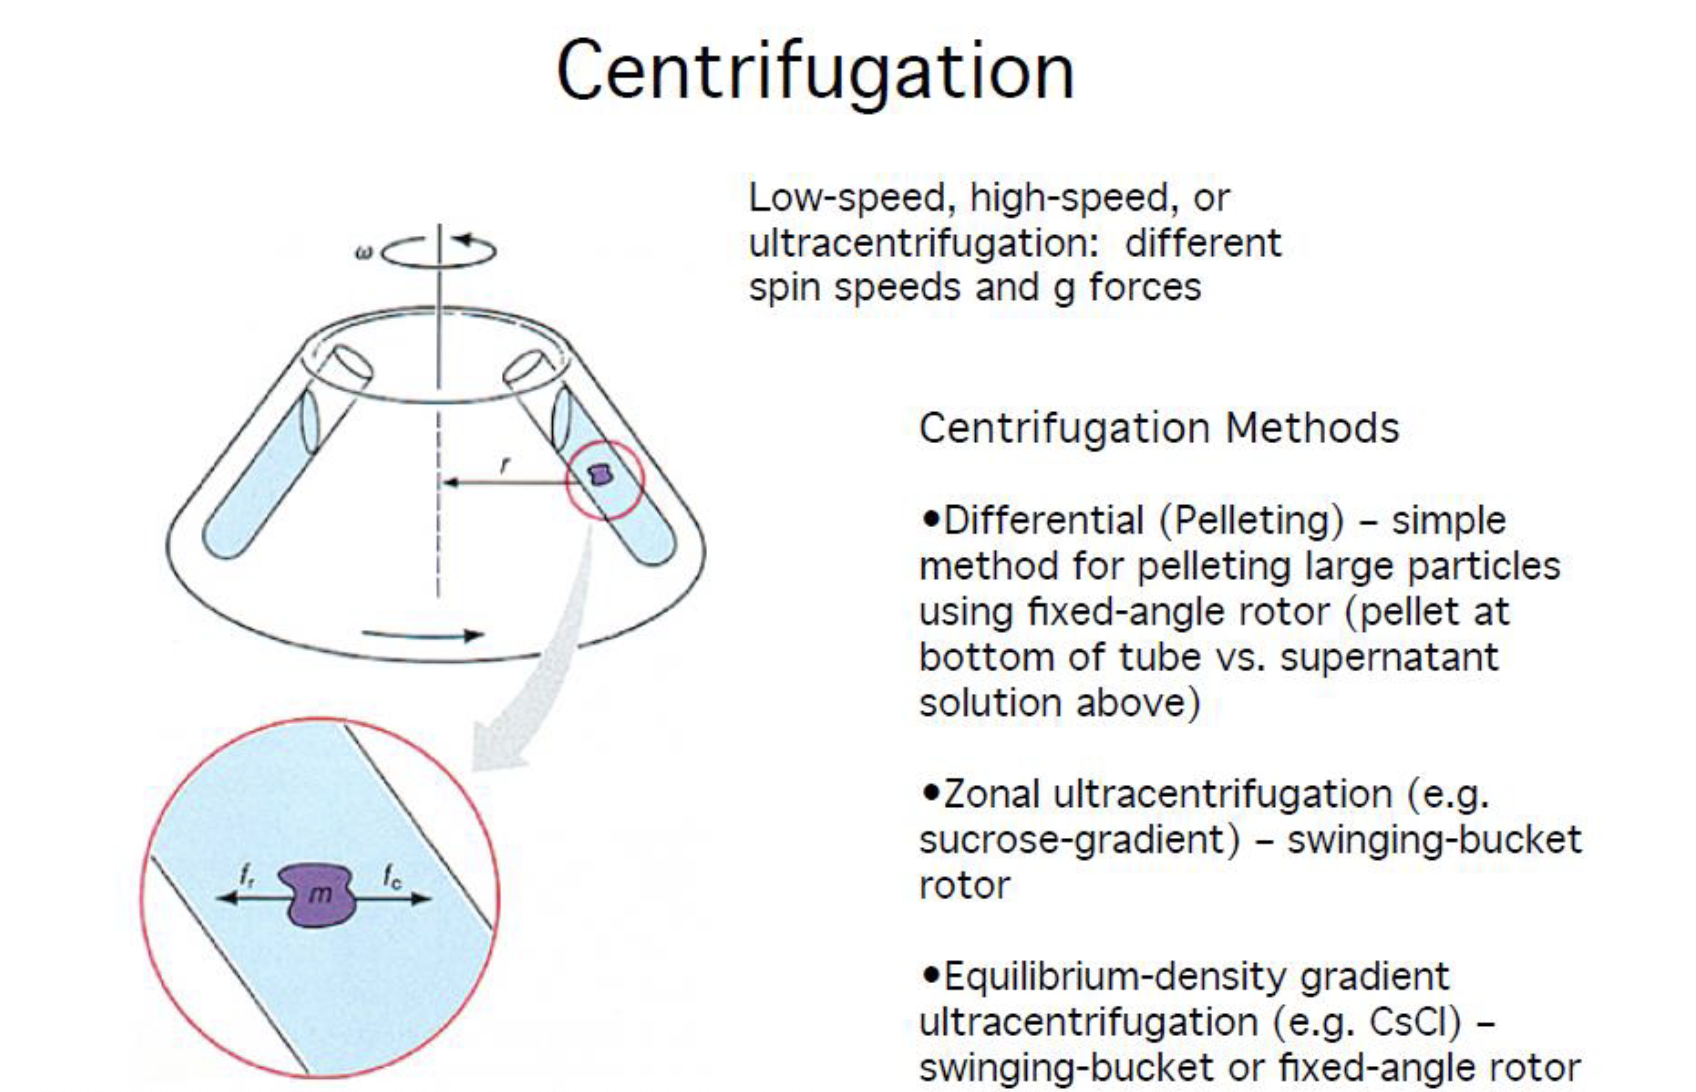
Centrifugation
chromatography
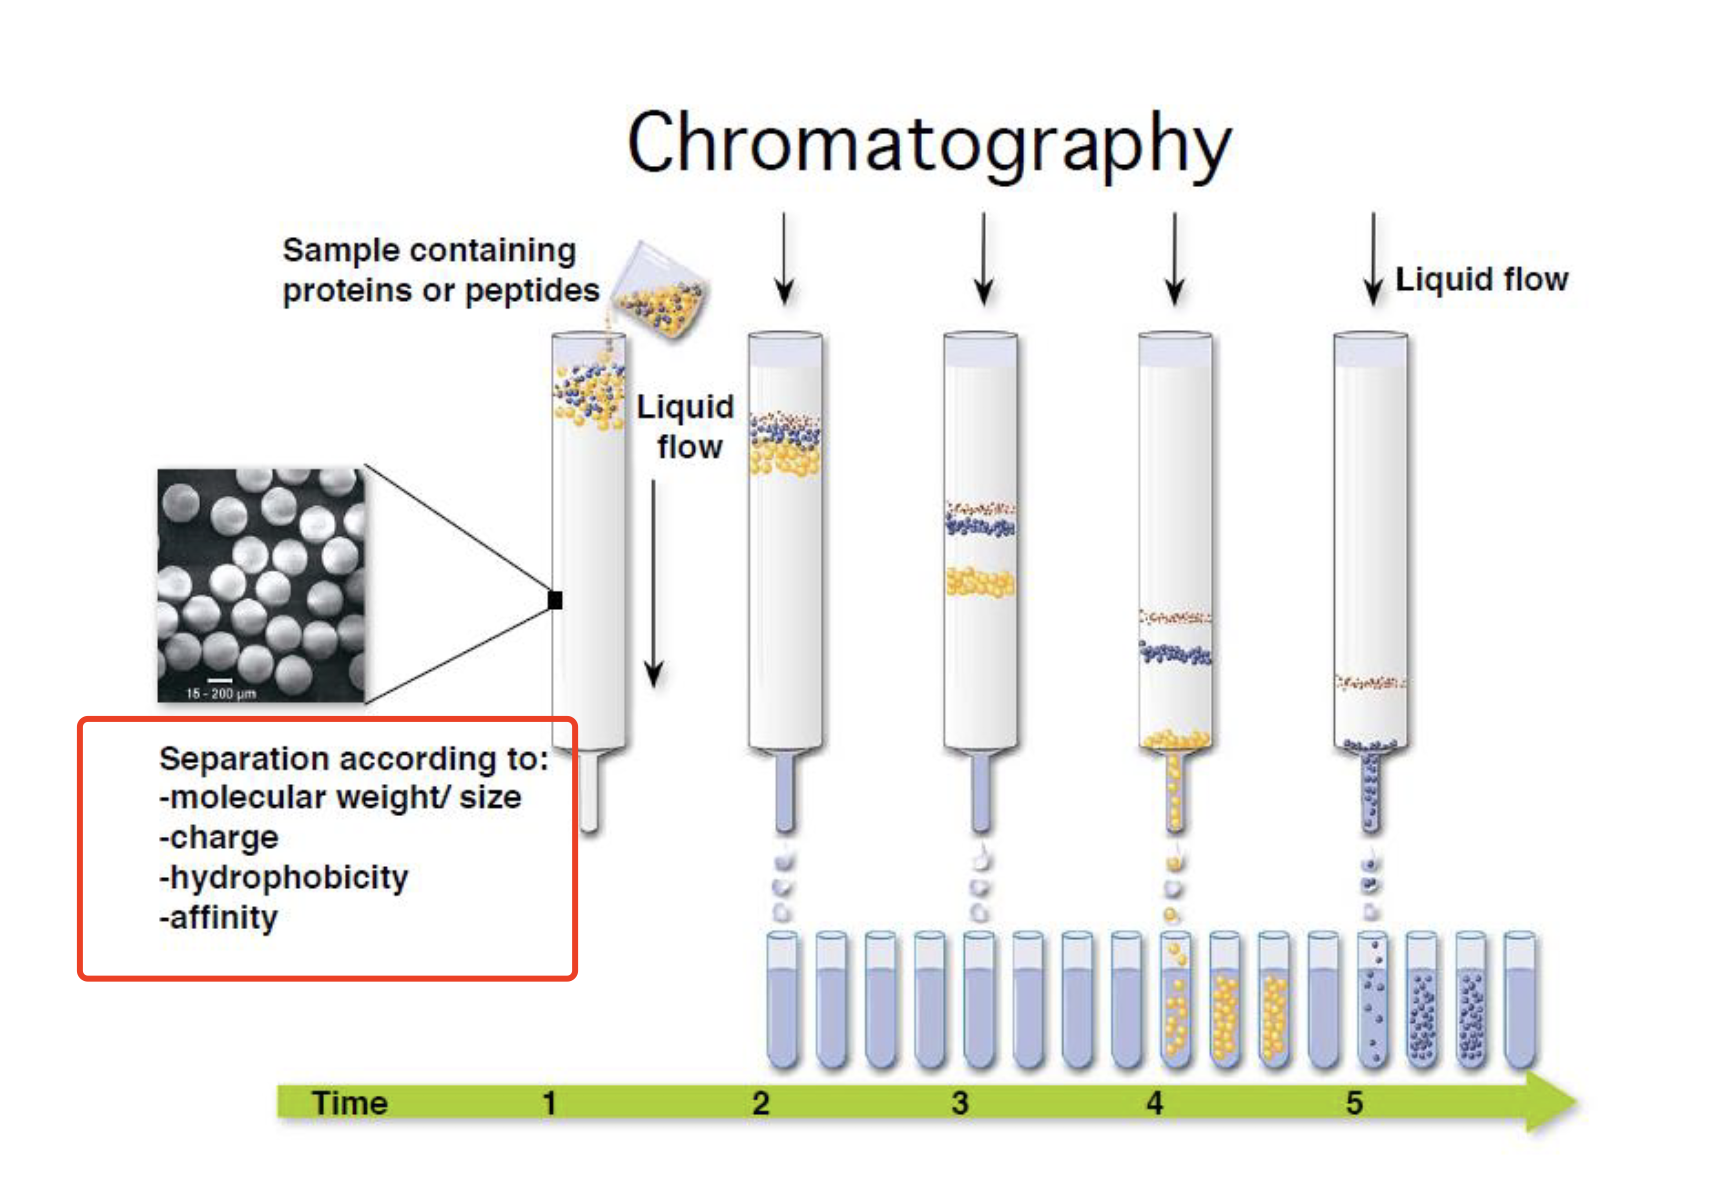
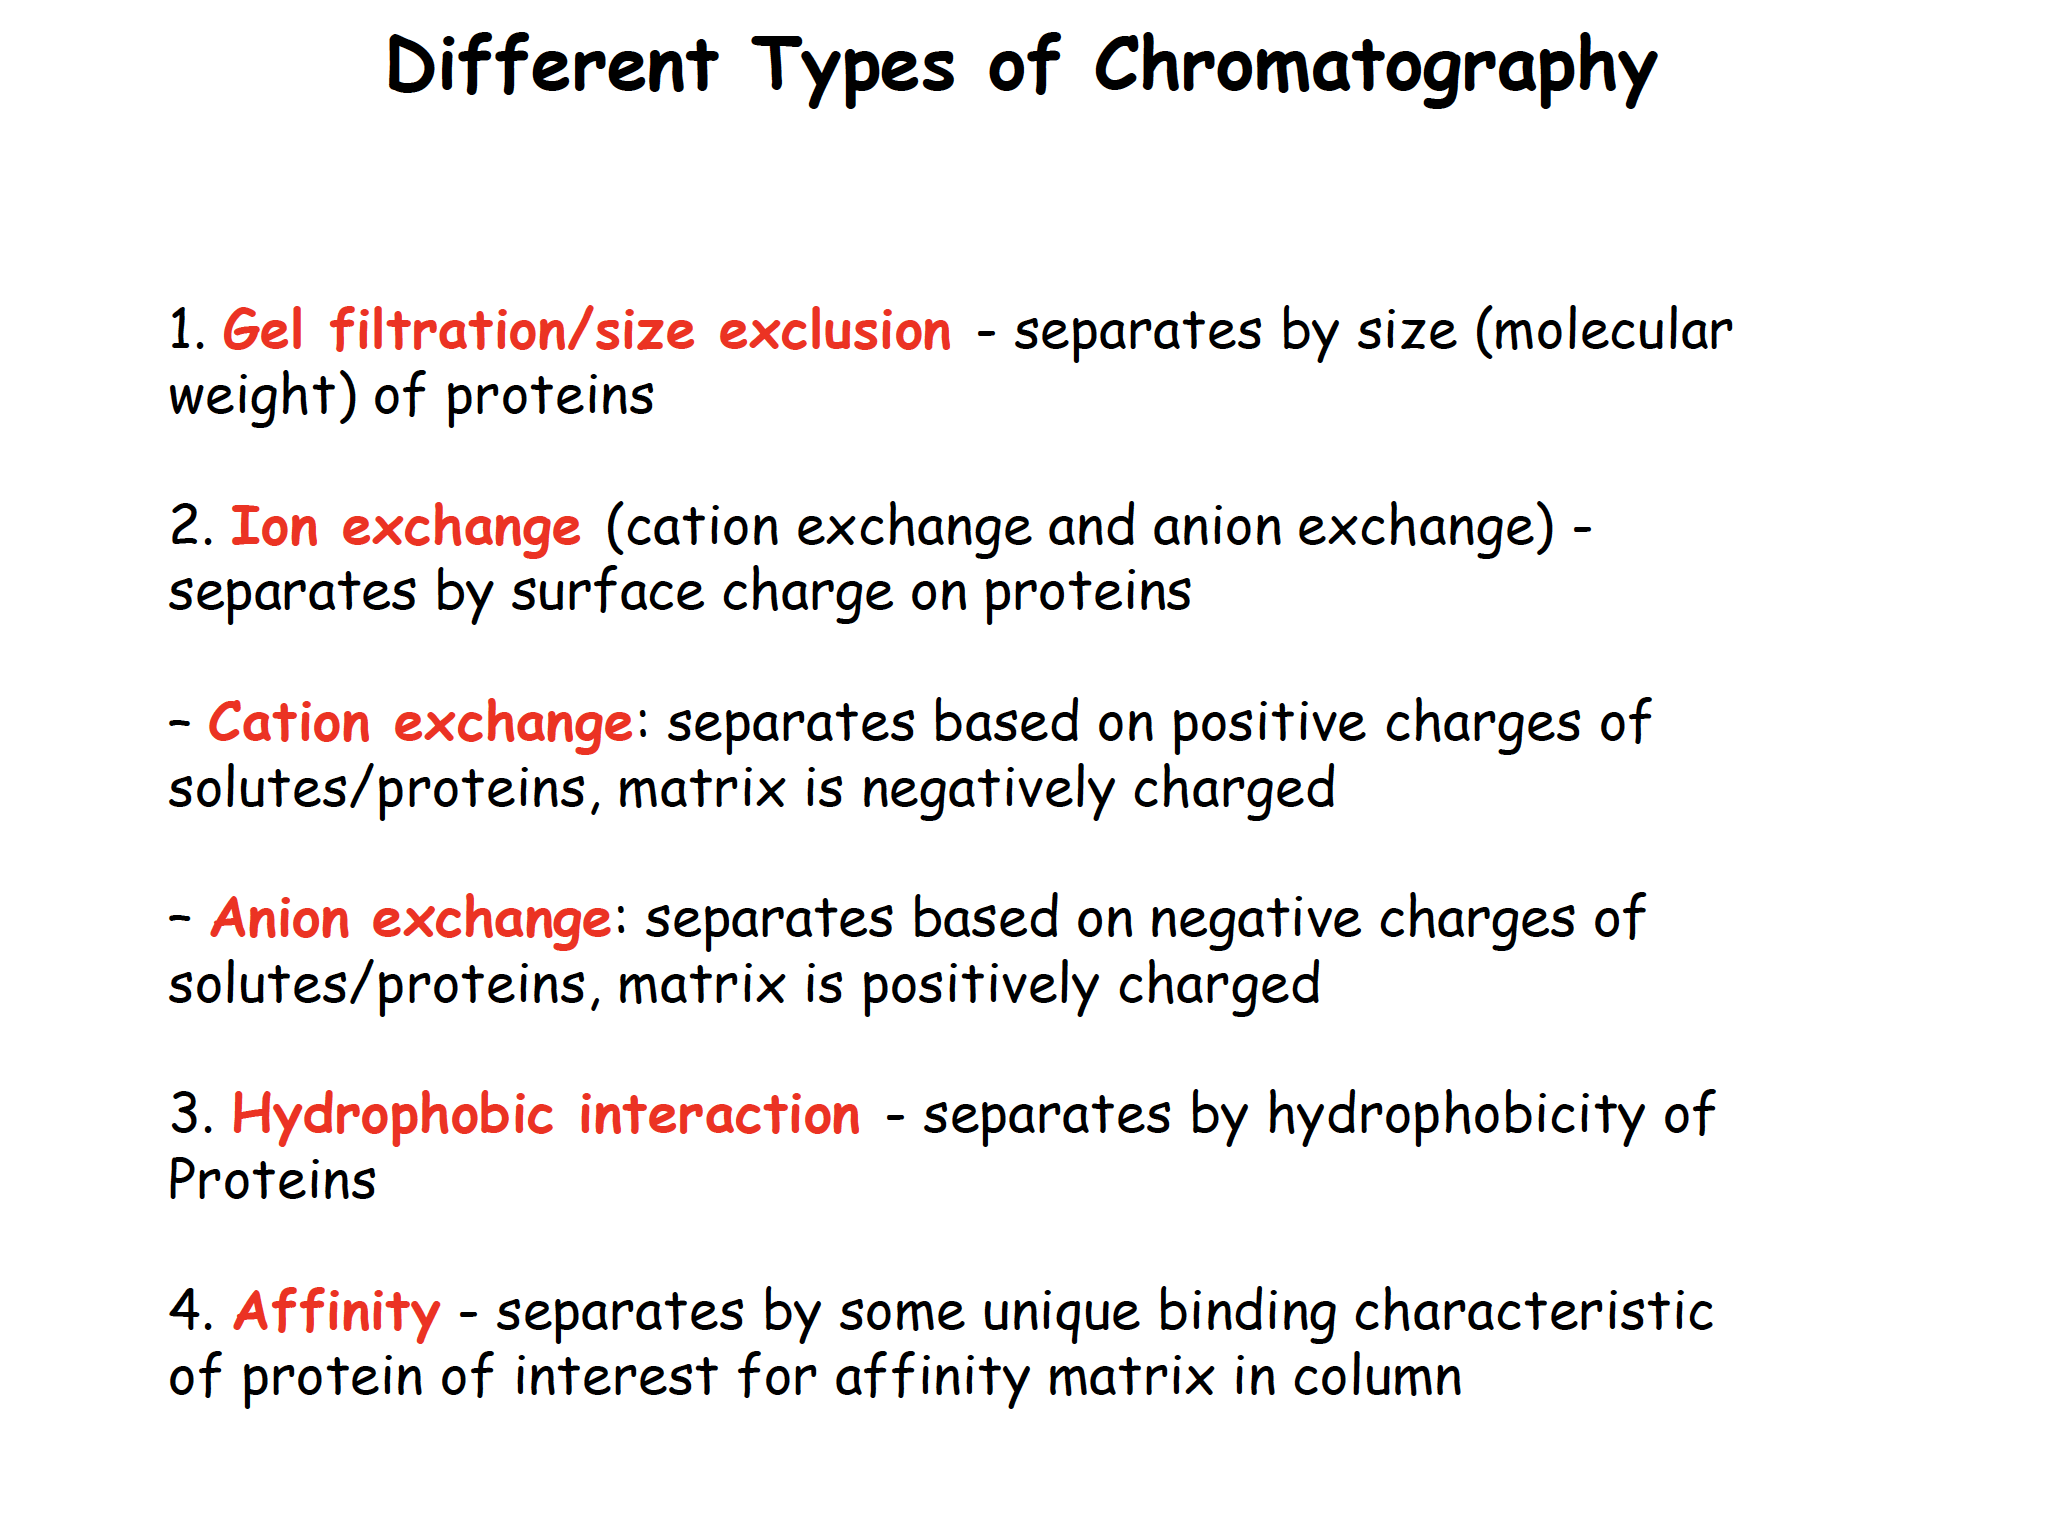
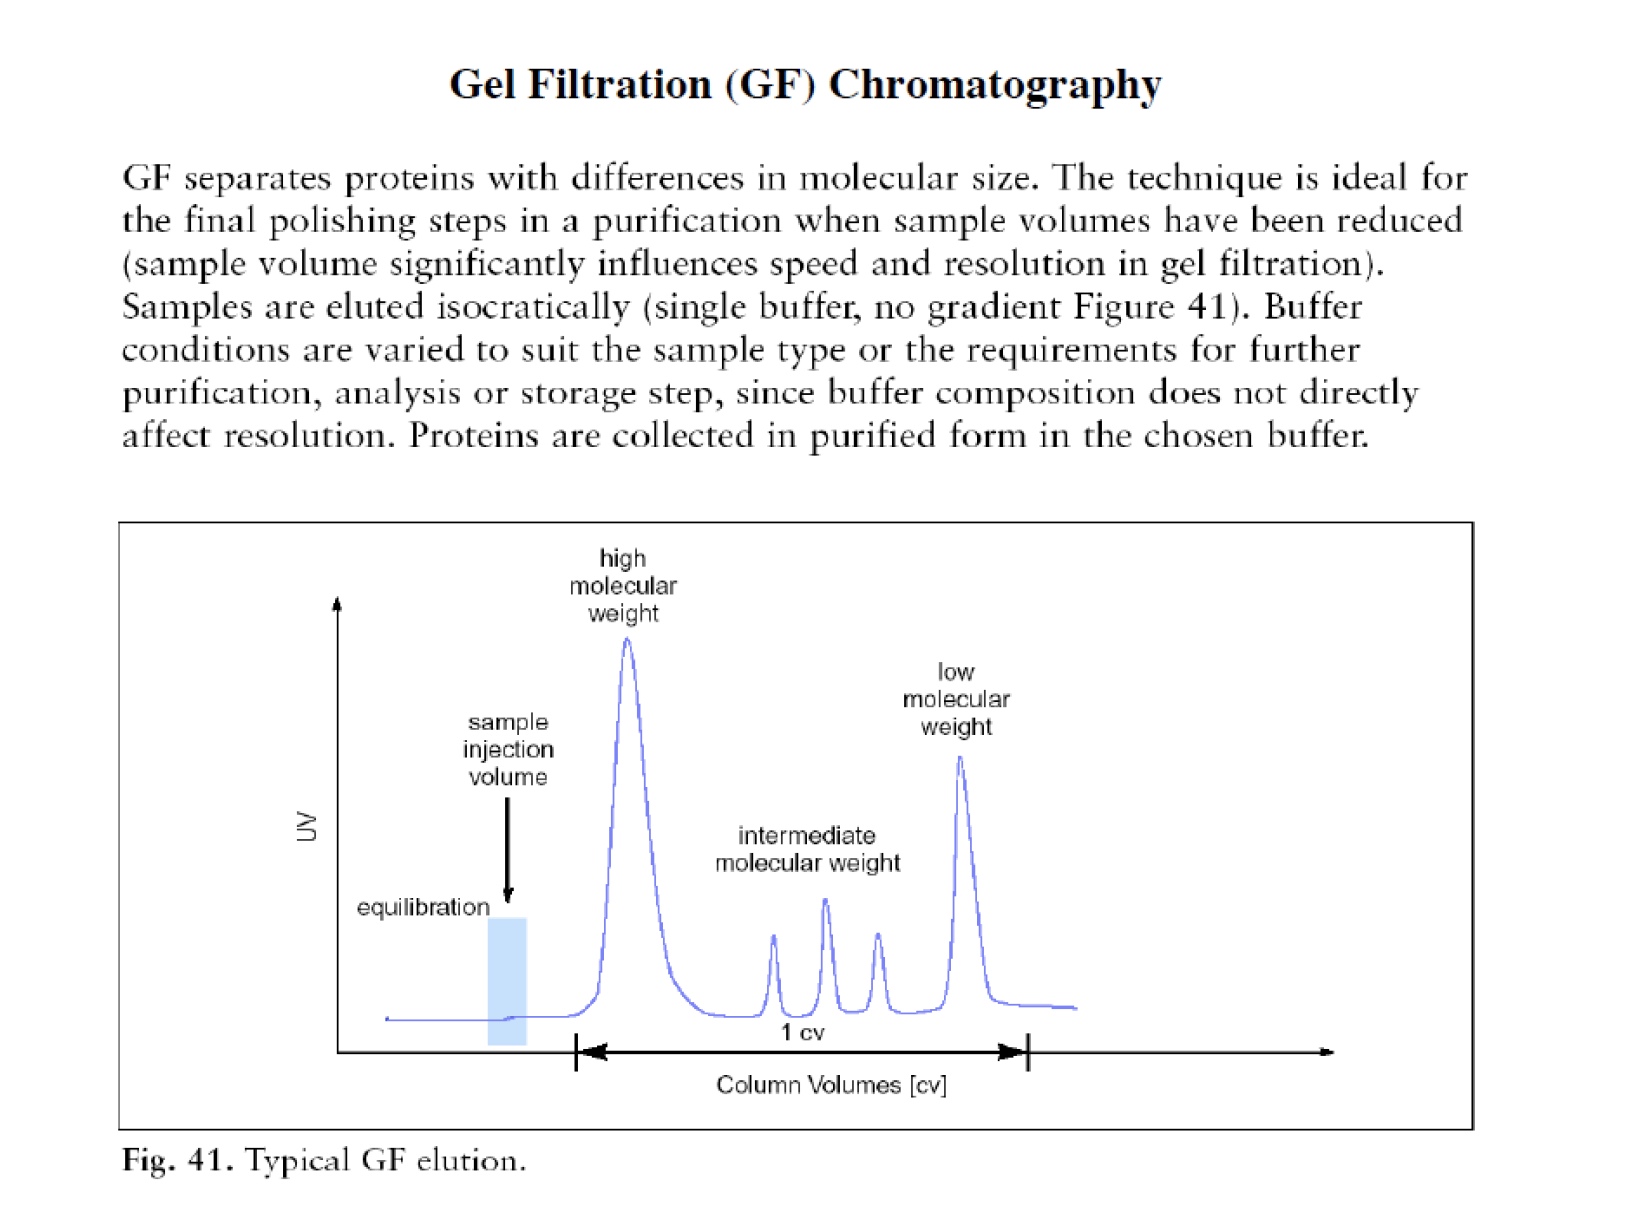
Gel filtration/Size exclusion chromatography
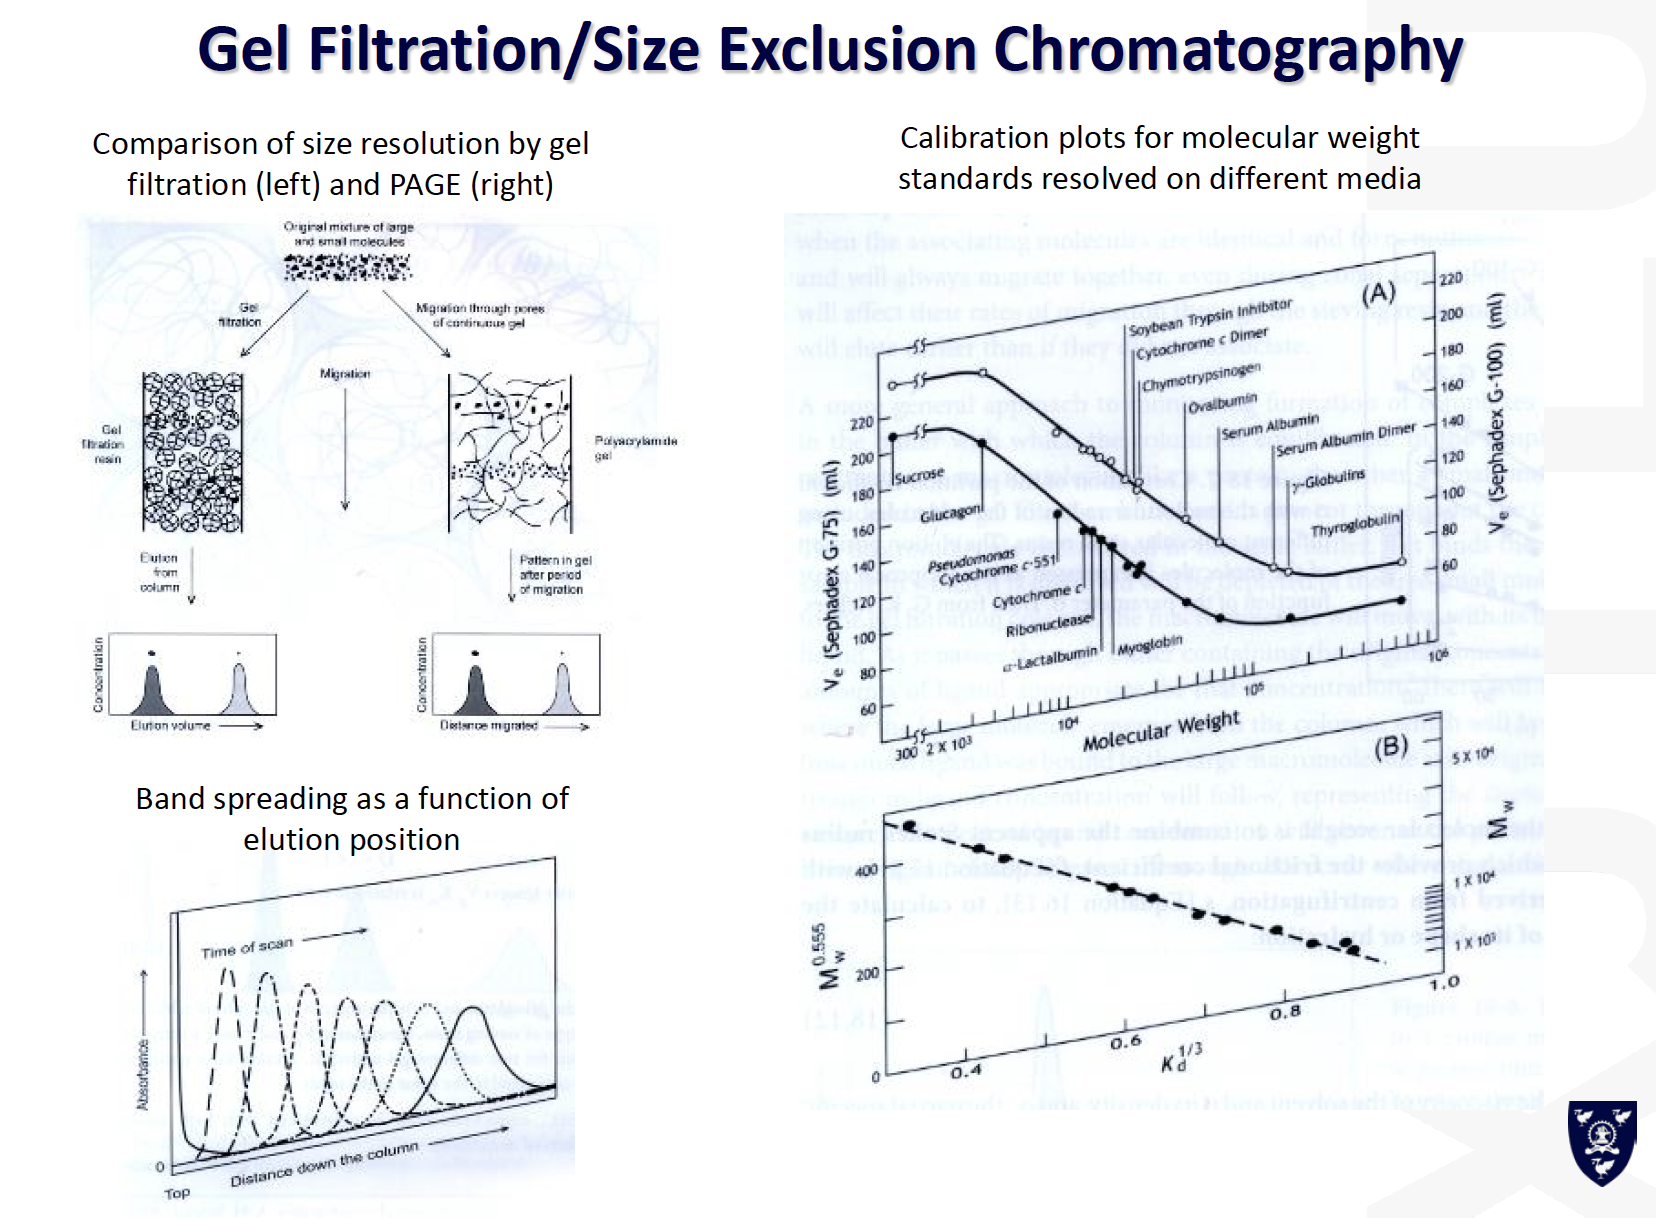
Ion exchange chromatography
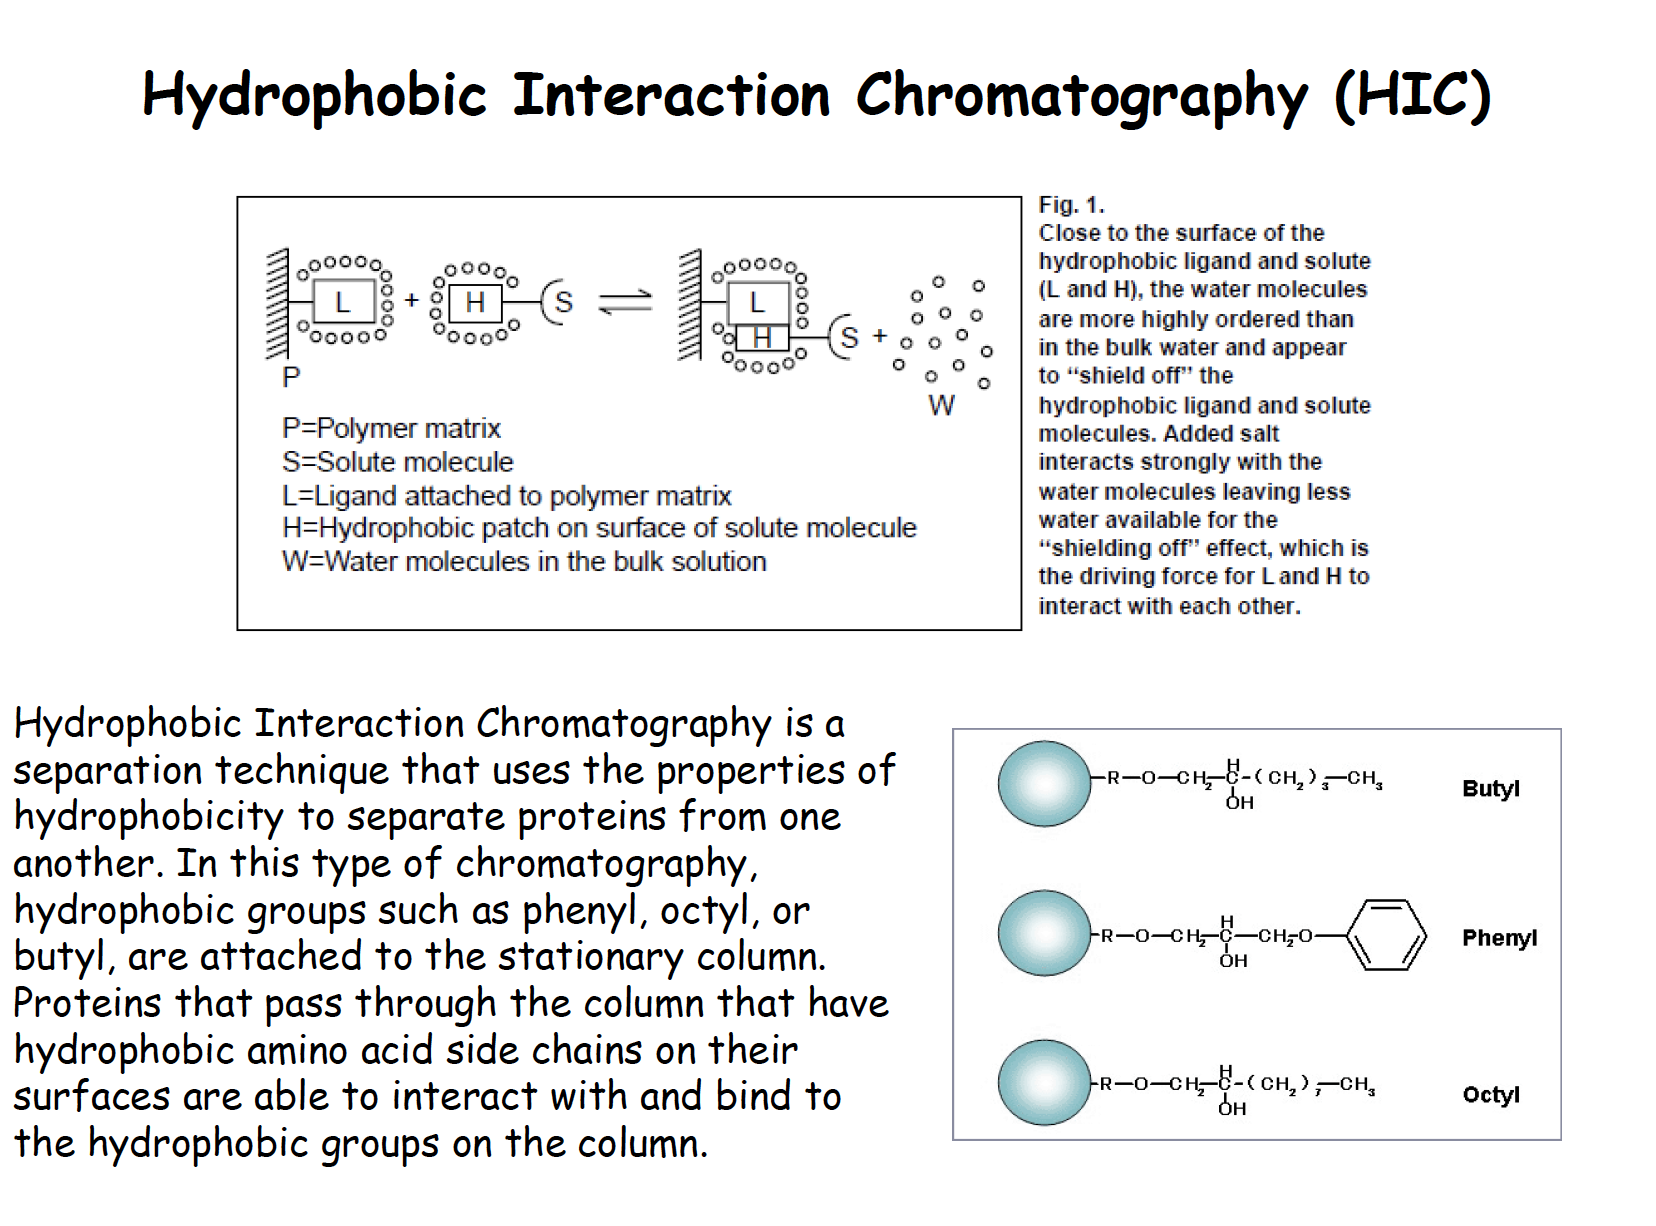
Hydrophobic interaction chromatography
Protein sequencing
Sanger sequence (protein identification)
Cleavage of polypeptides for analysis
- Strong acid - not sequence specific
- Sequence-specific proteolytic enzymes (proteases)
- Sequence-specific chemical cleavage (cyanogen bromide cleavage at methonine residues)
Only used in the mutant protein that is not in the databases
FPLC:
HPLC: high pressure
Protein identification
Edman degradation
Sequence aa in a peptide.
Amino-terminal residue is labeled and cleaved from the pipetted without disrupting the peptide bonds between other amino acid residues
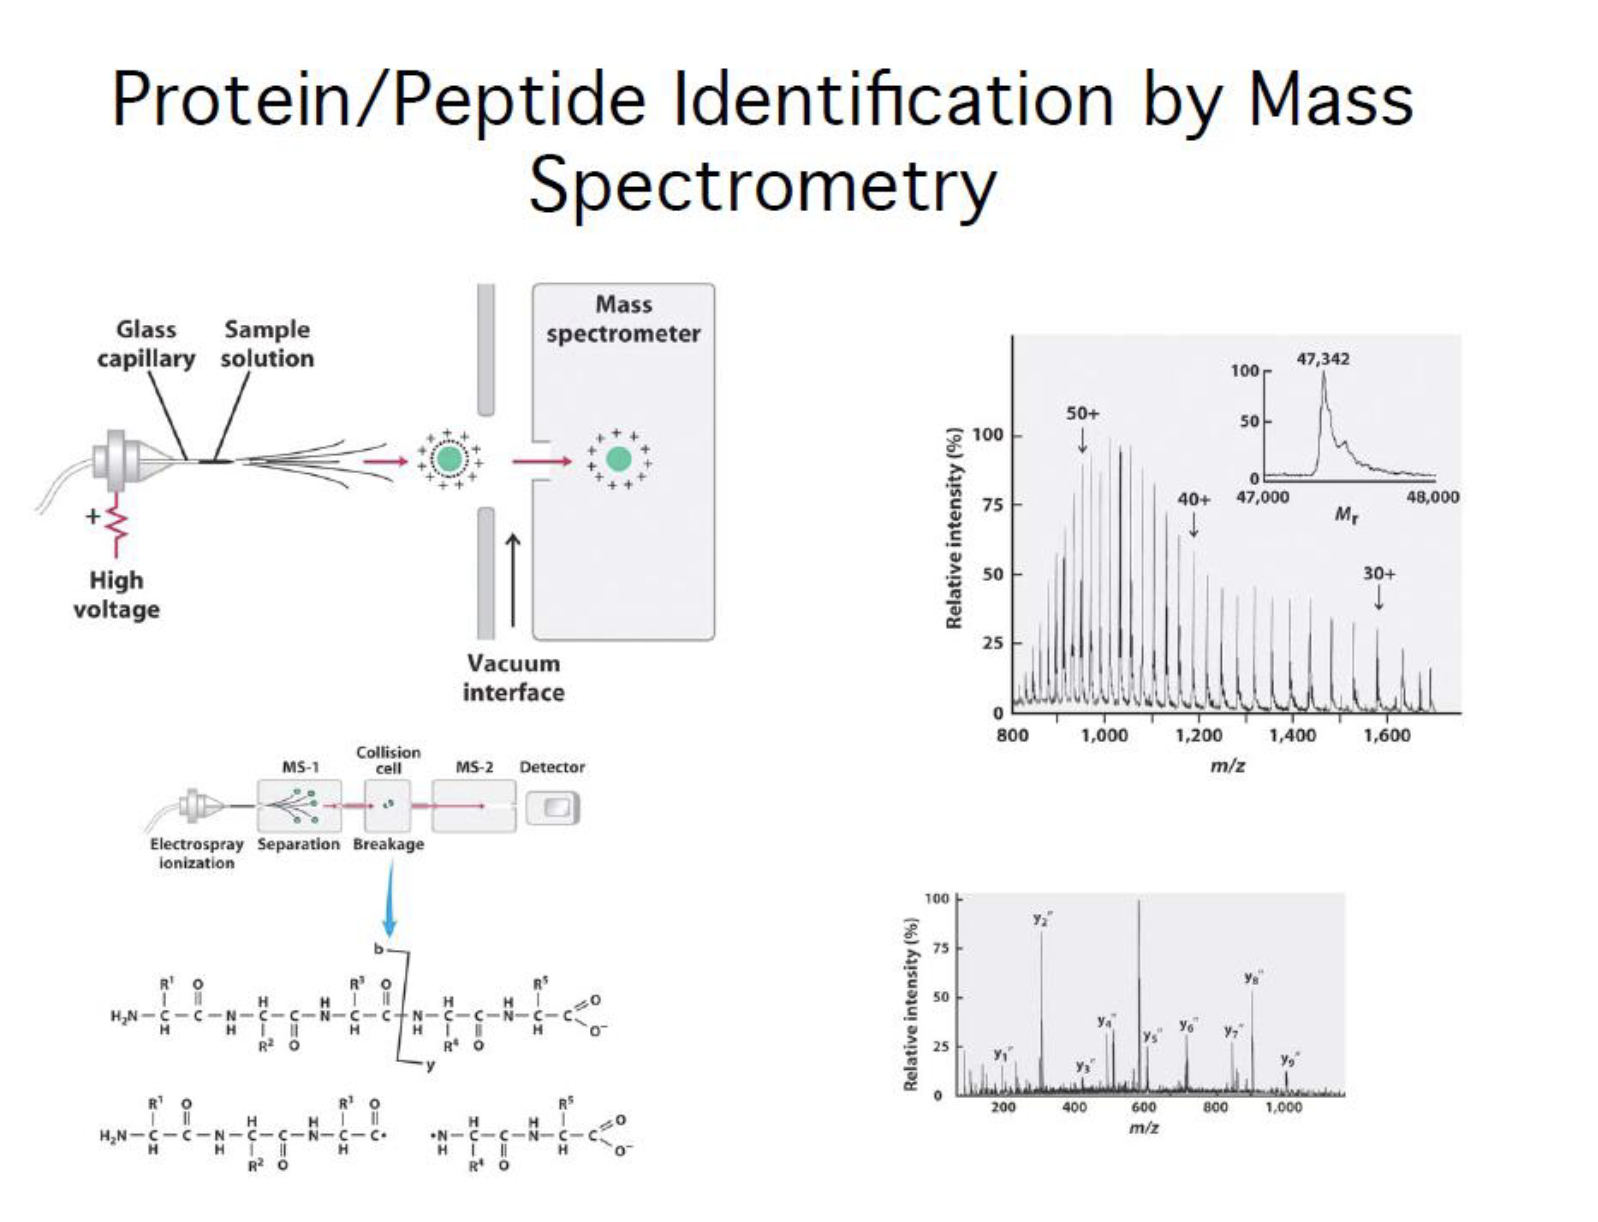
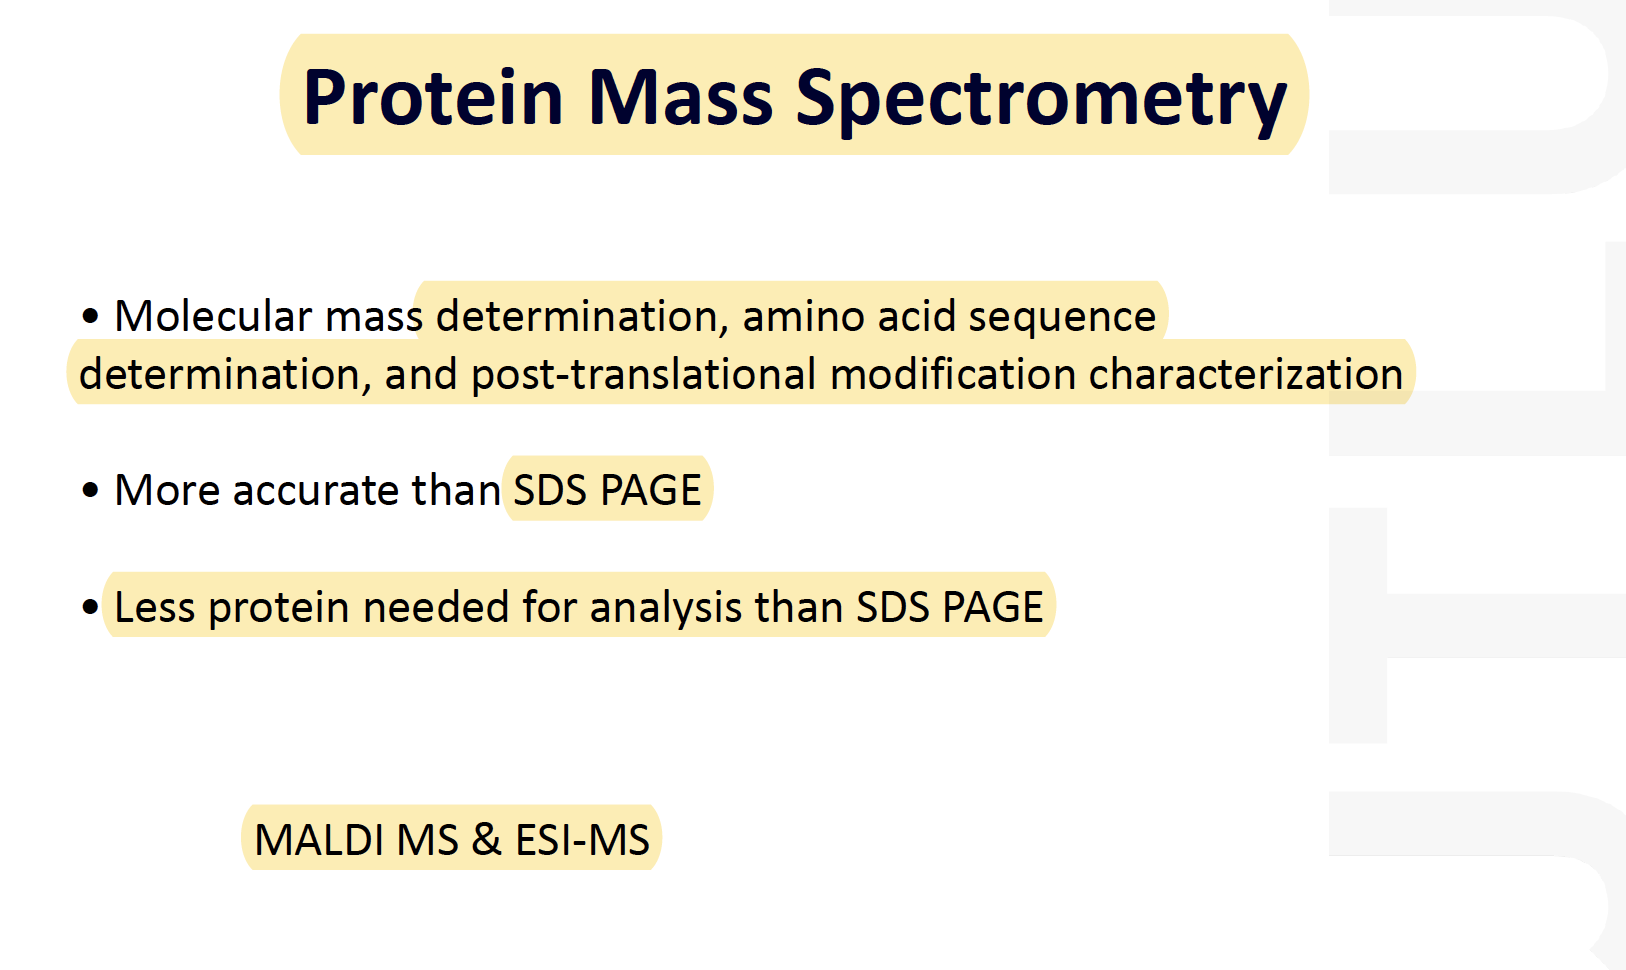
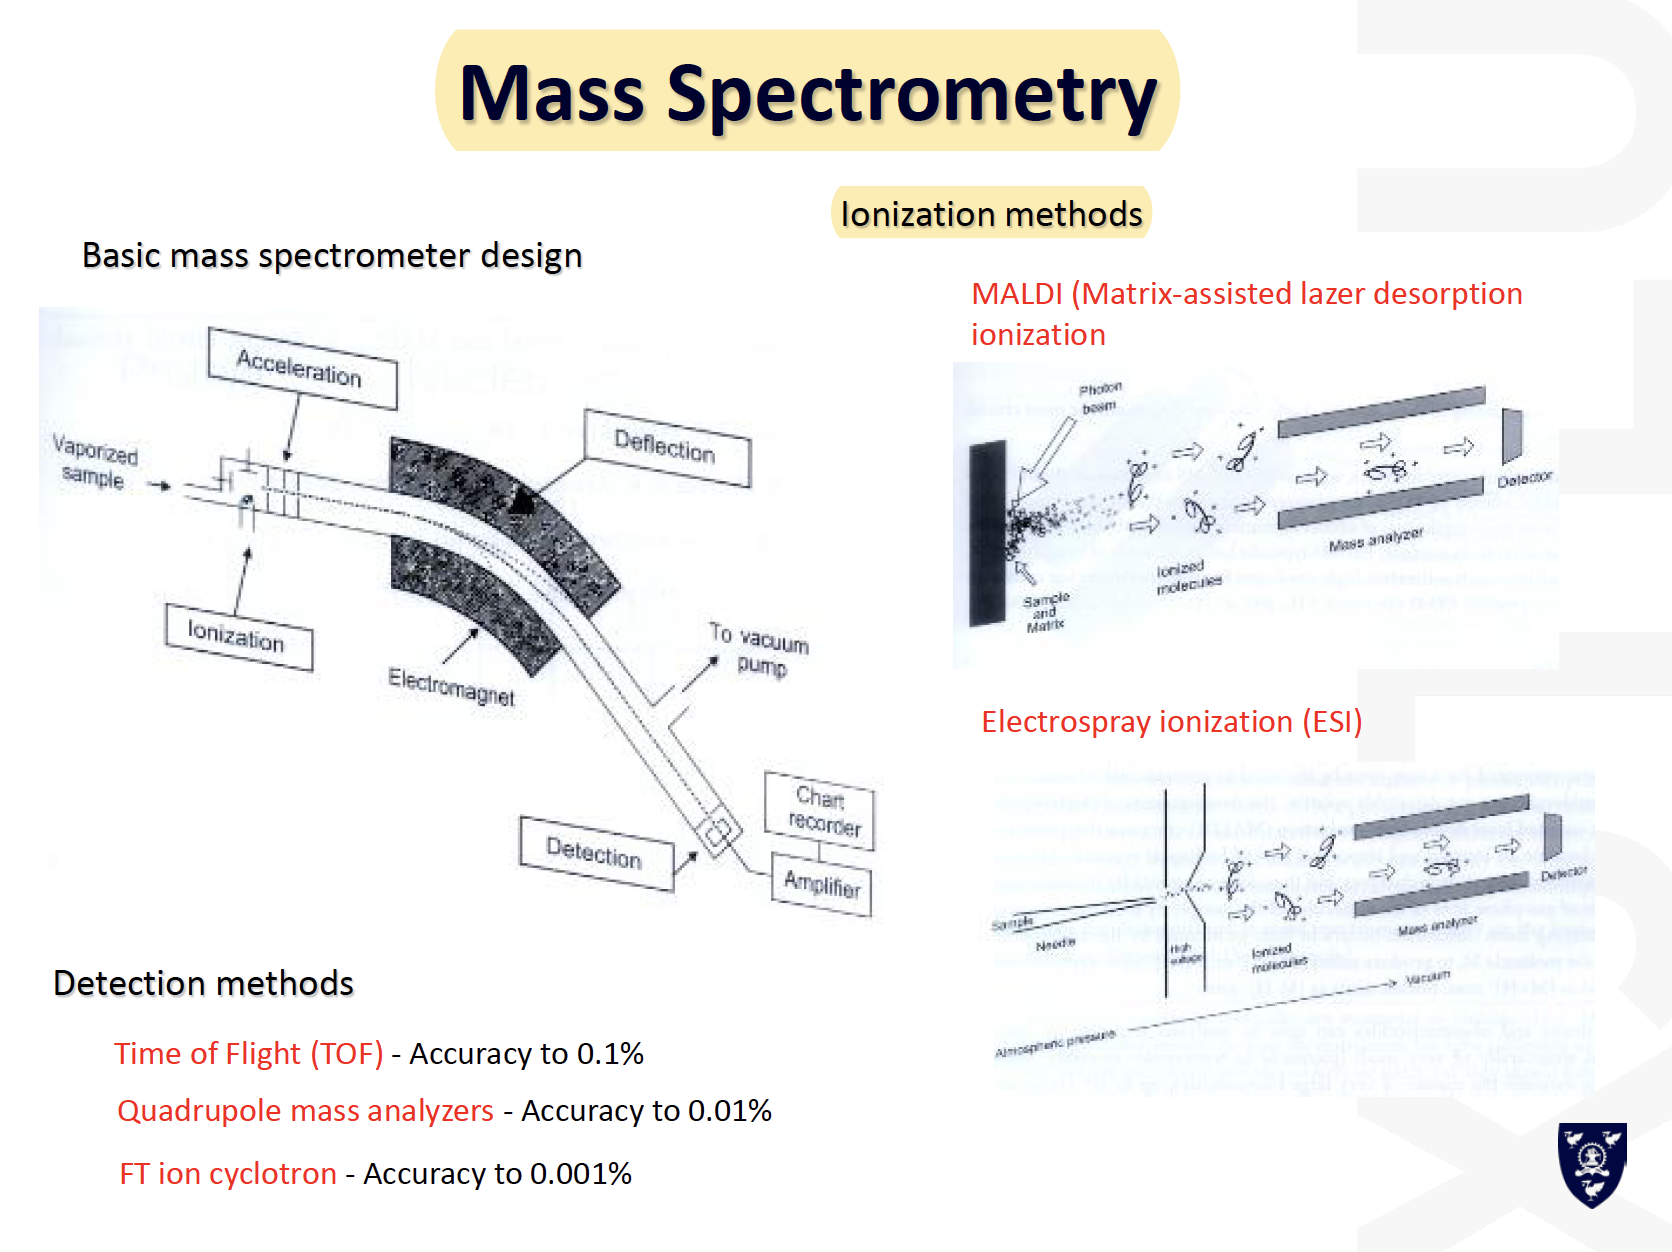
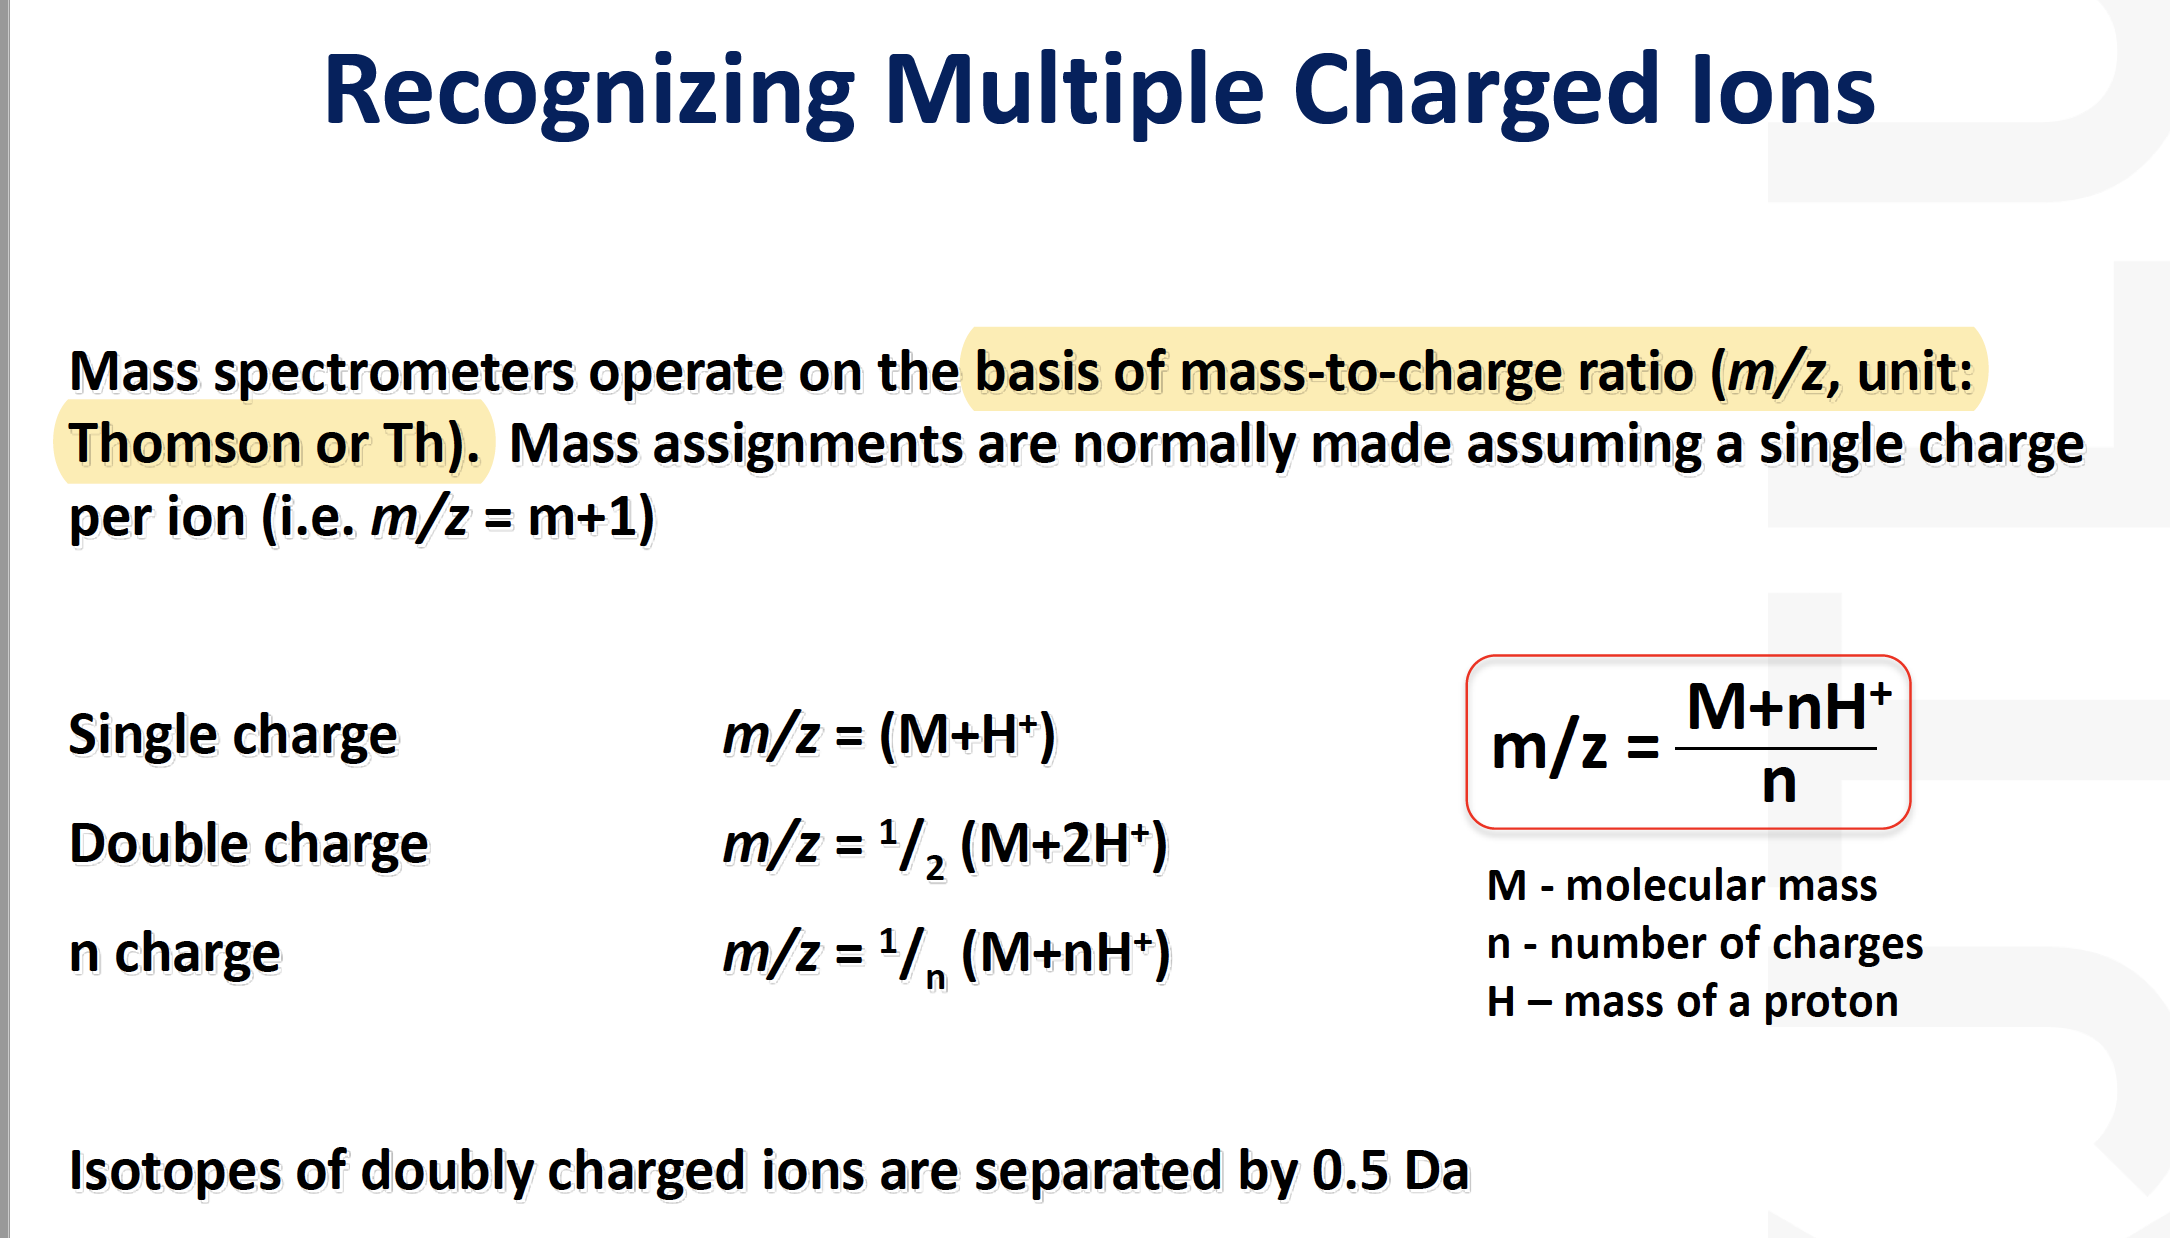
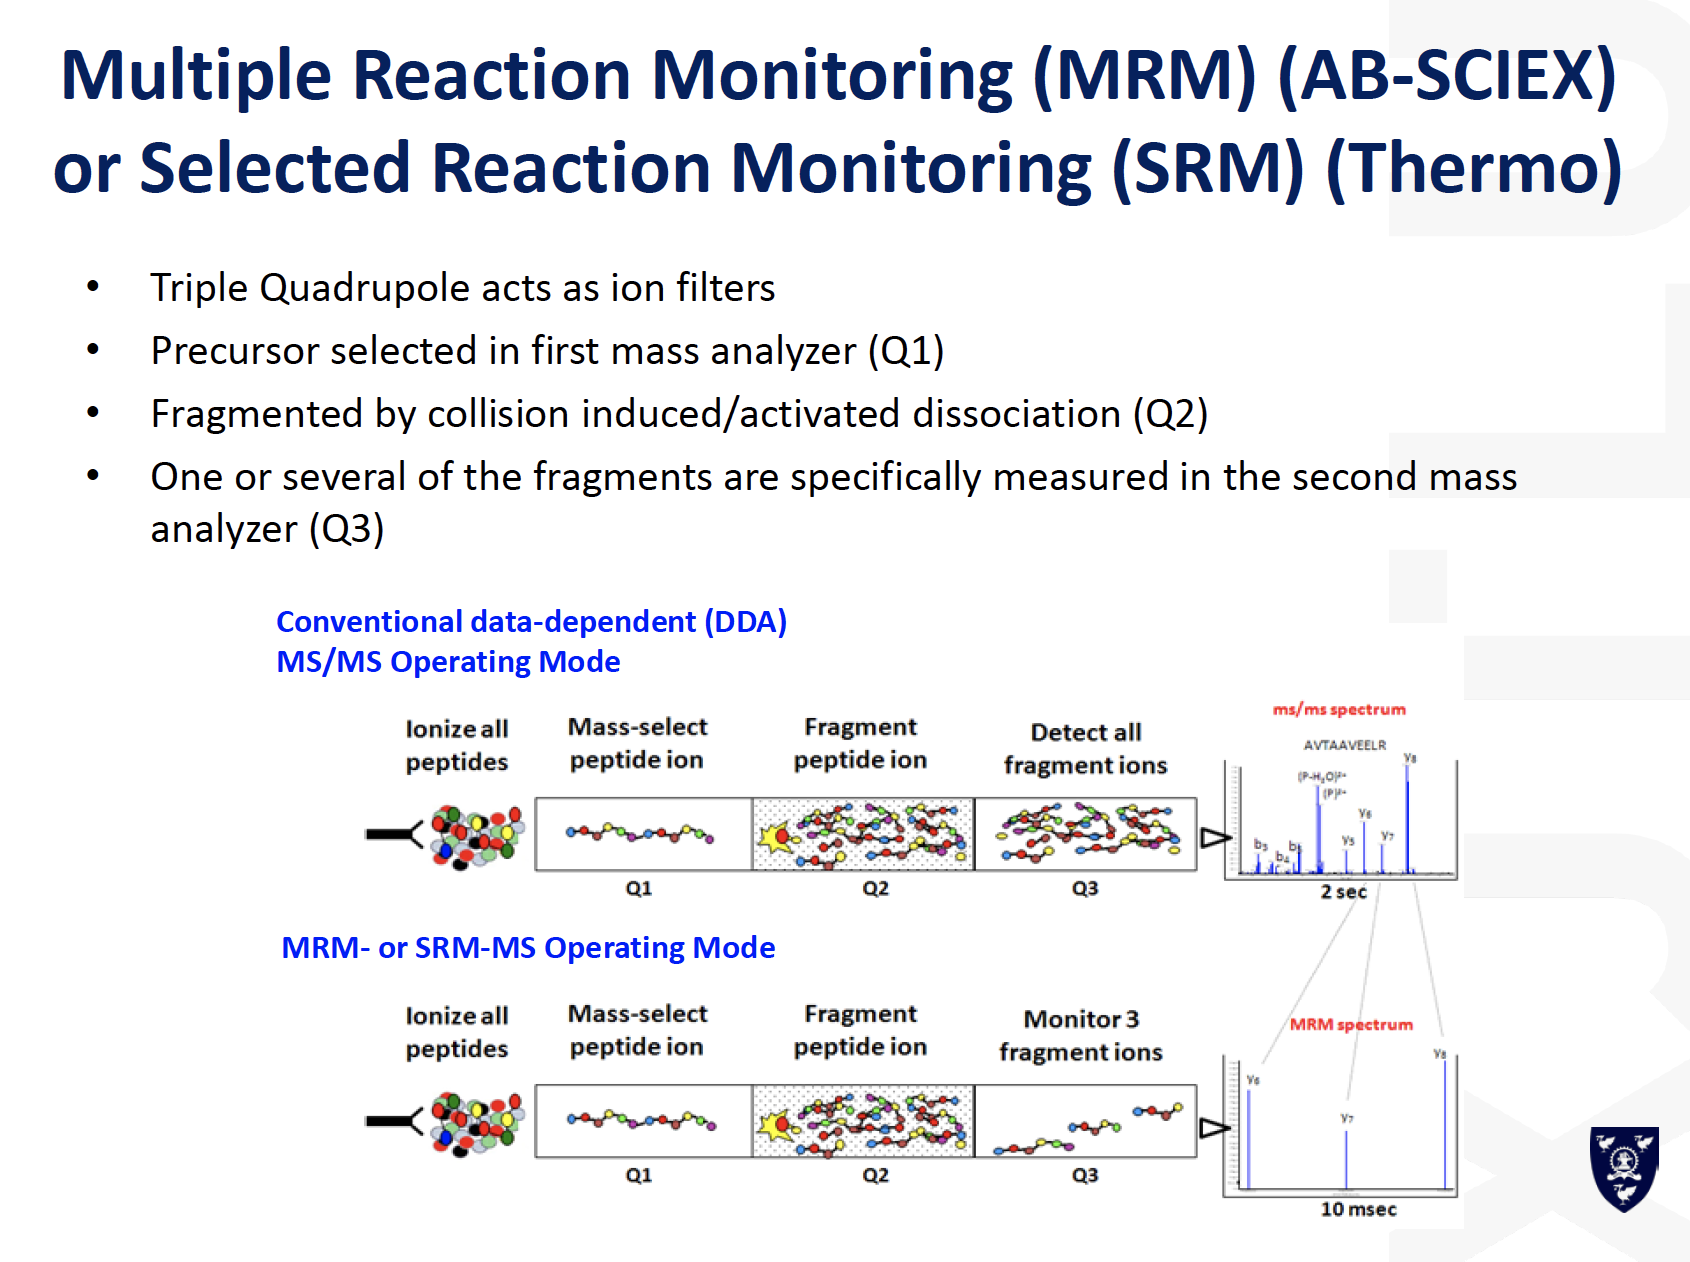
Mass spectrometry
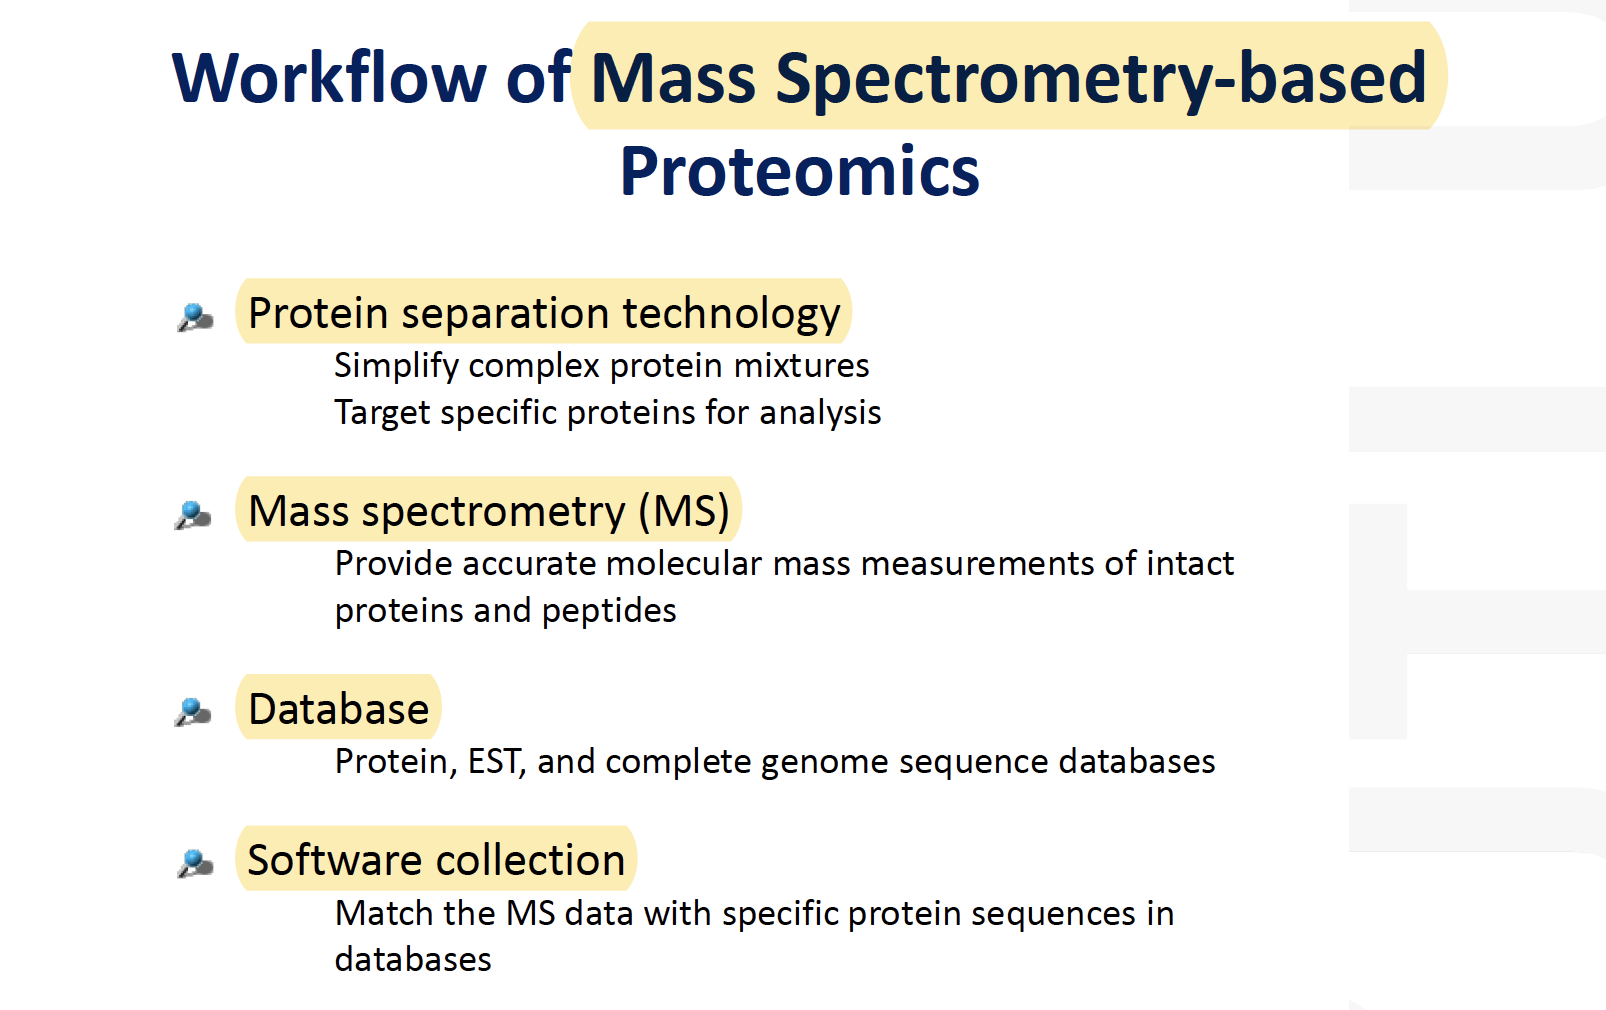
Mass Spectrometry:
Analytical techniques that measures the mass-to-charge ratio of charged particles, mass spectrometry is used for determining masses of particles and the elemental composition of a sample of molecules as well as for elucidating the chemical structure of molecules such as peptide
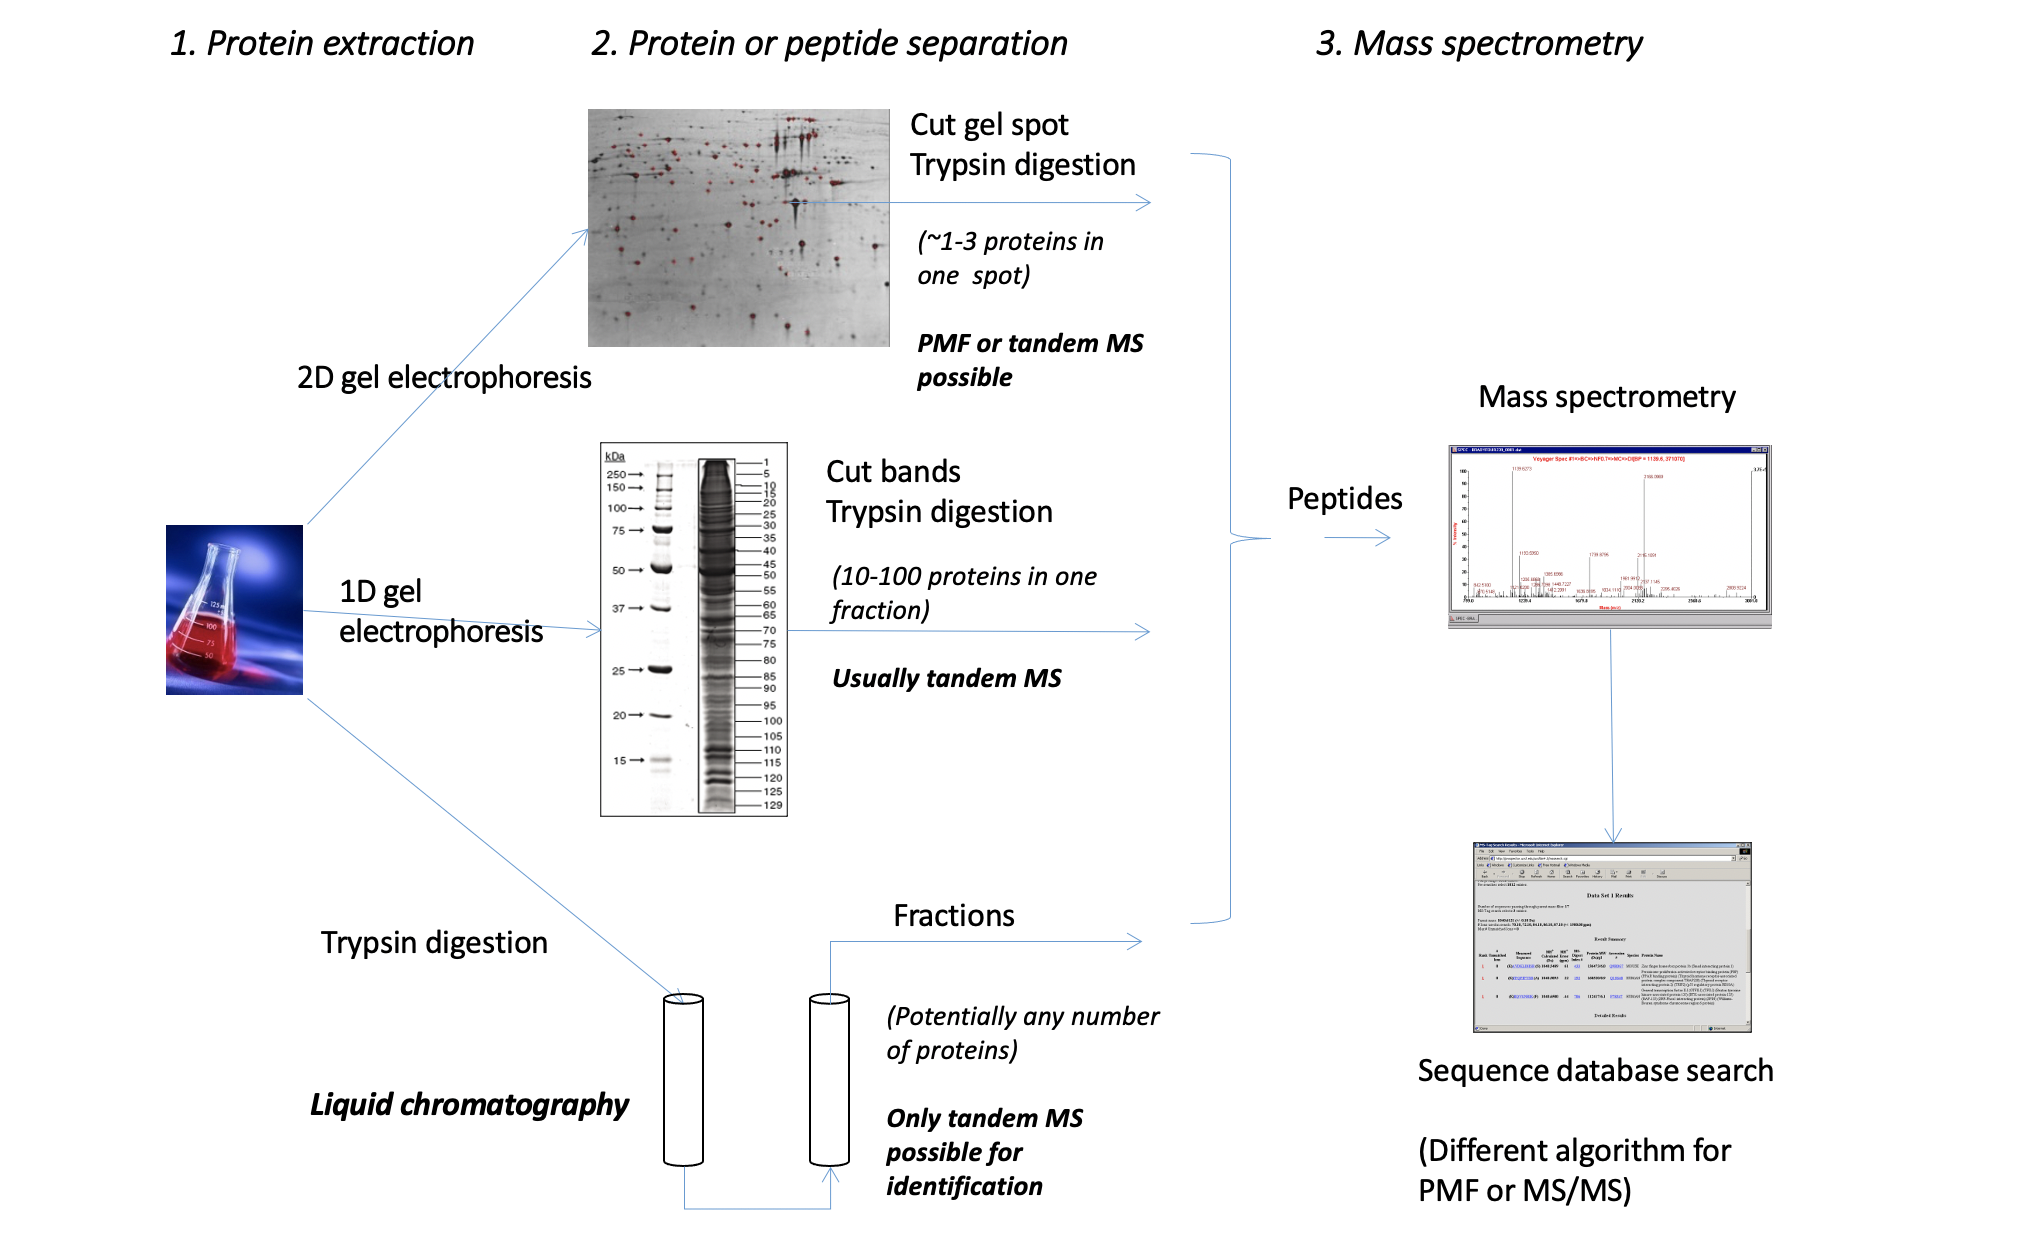
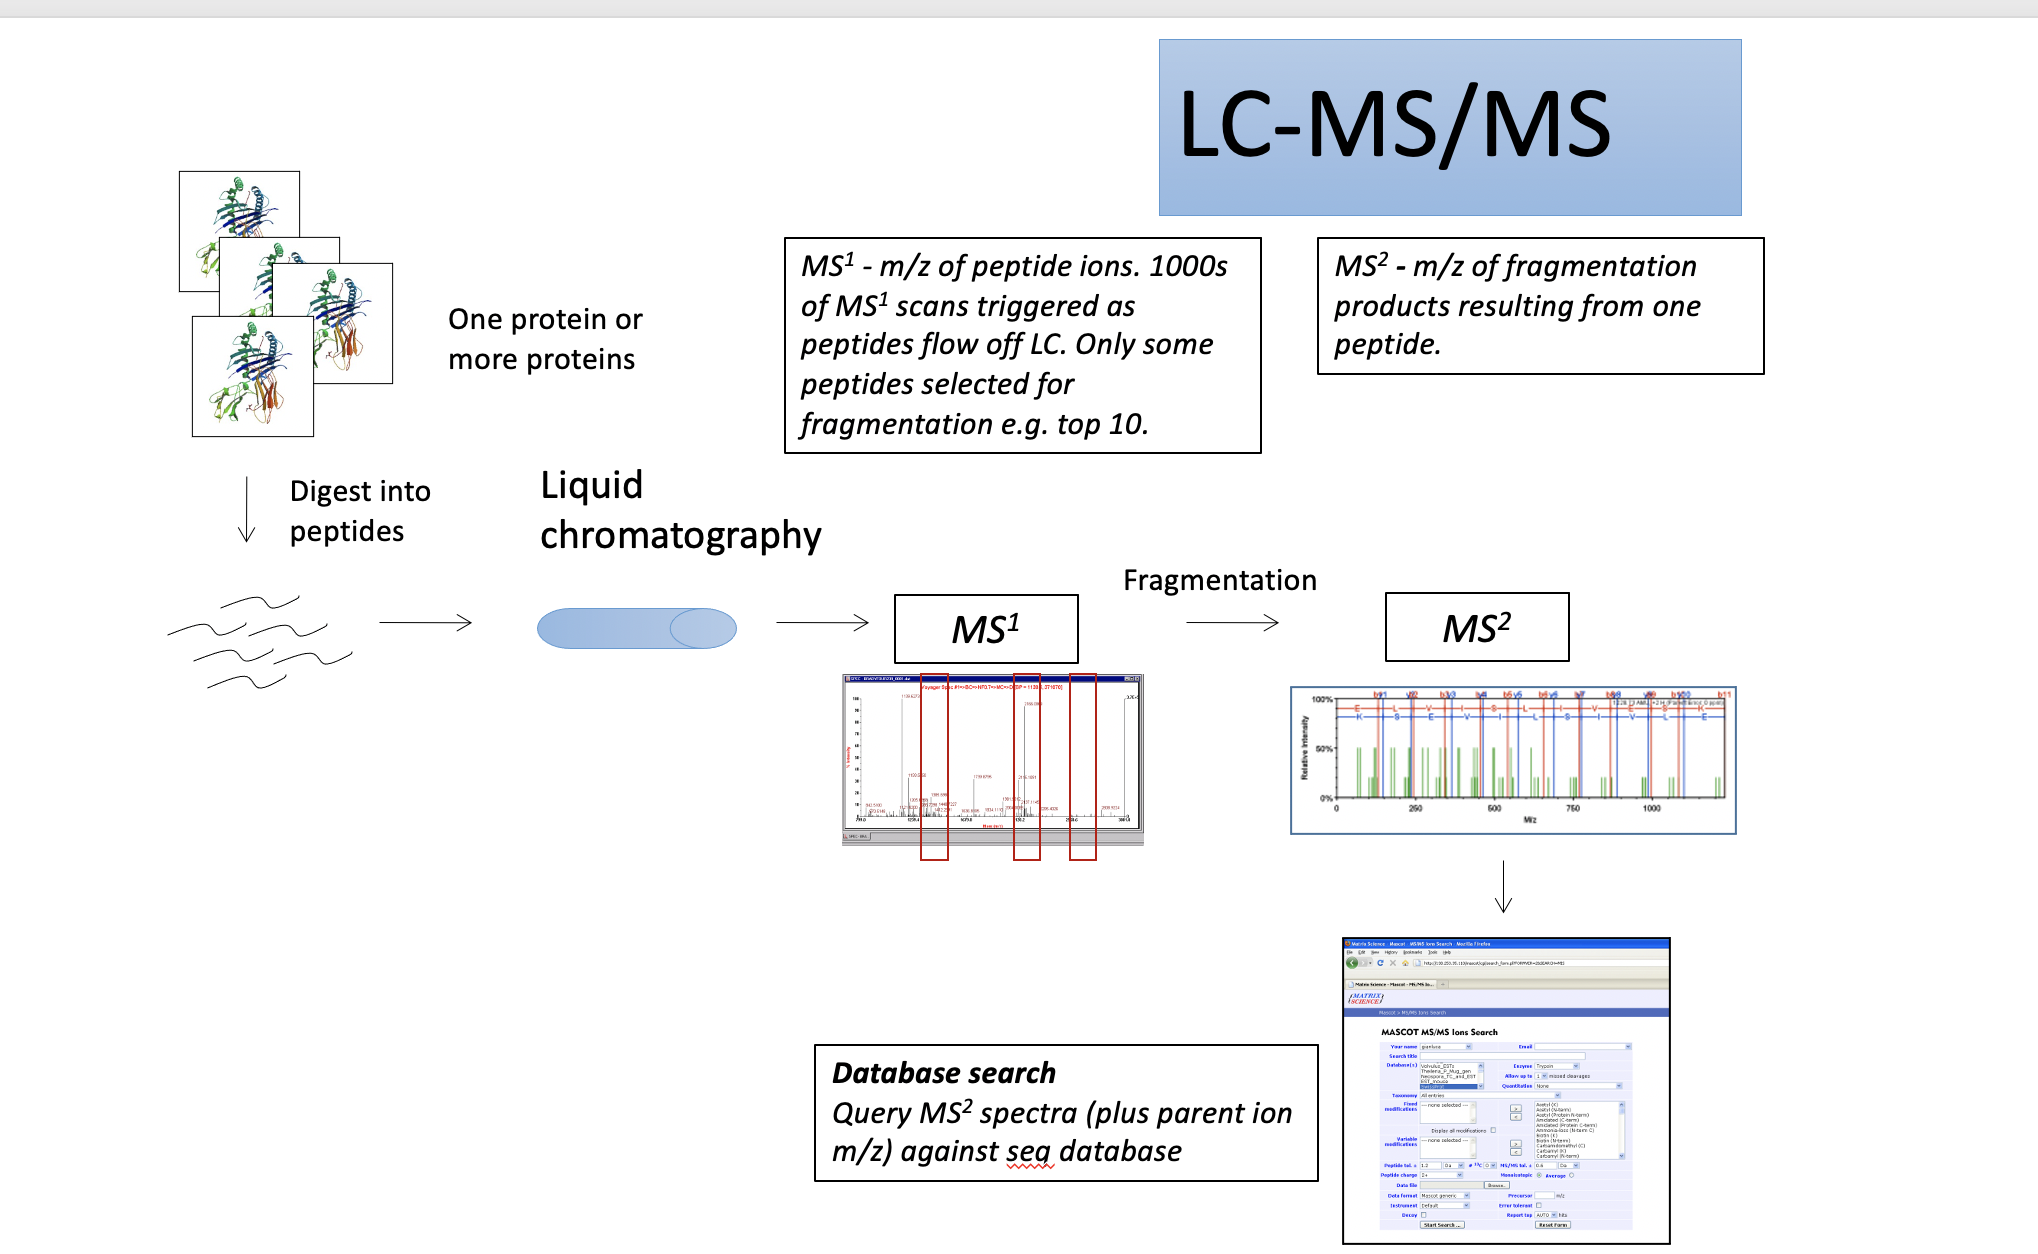
Workflow
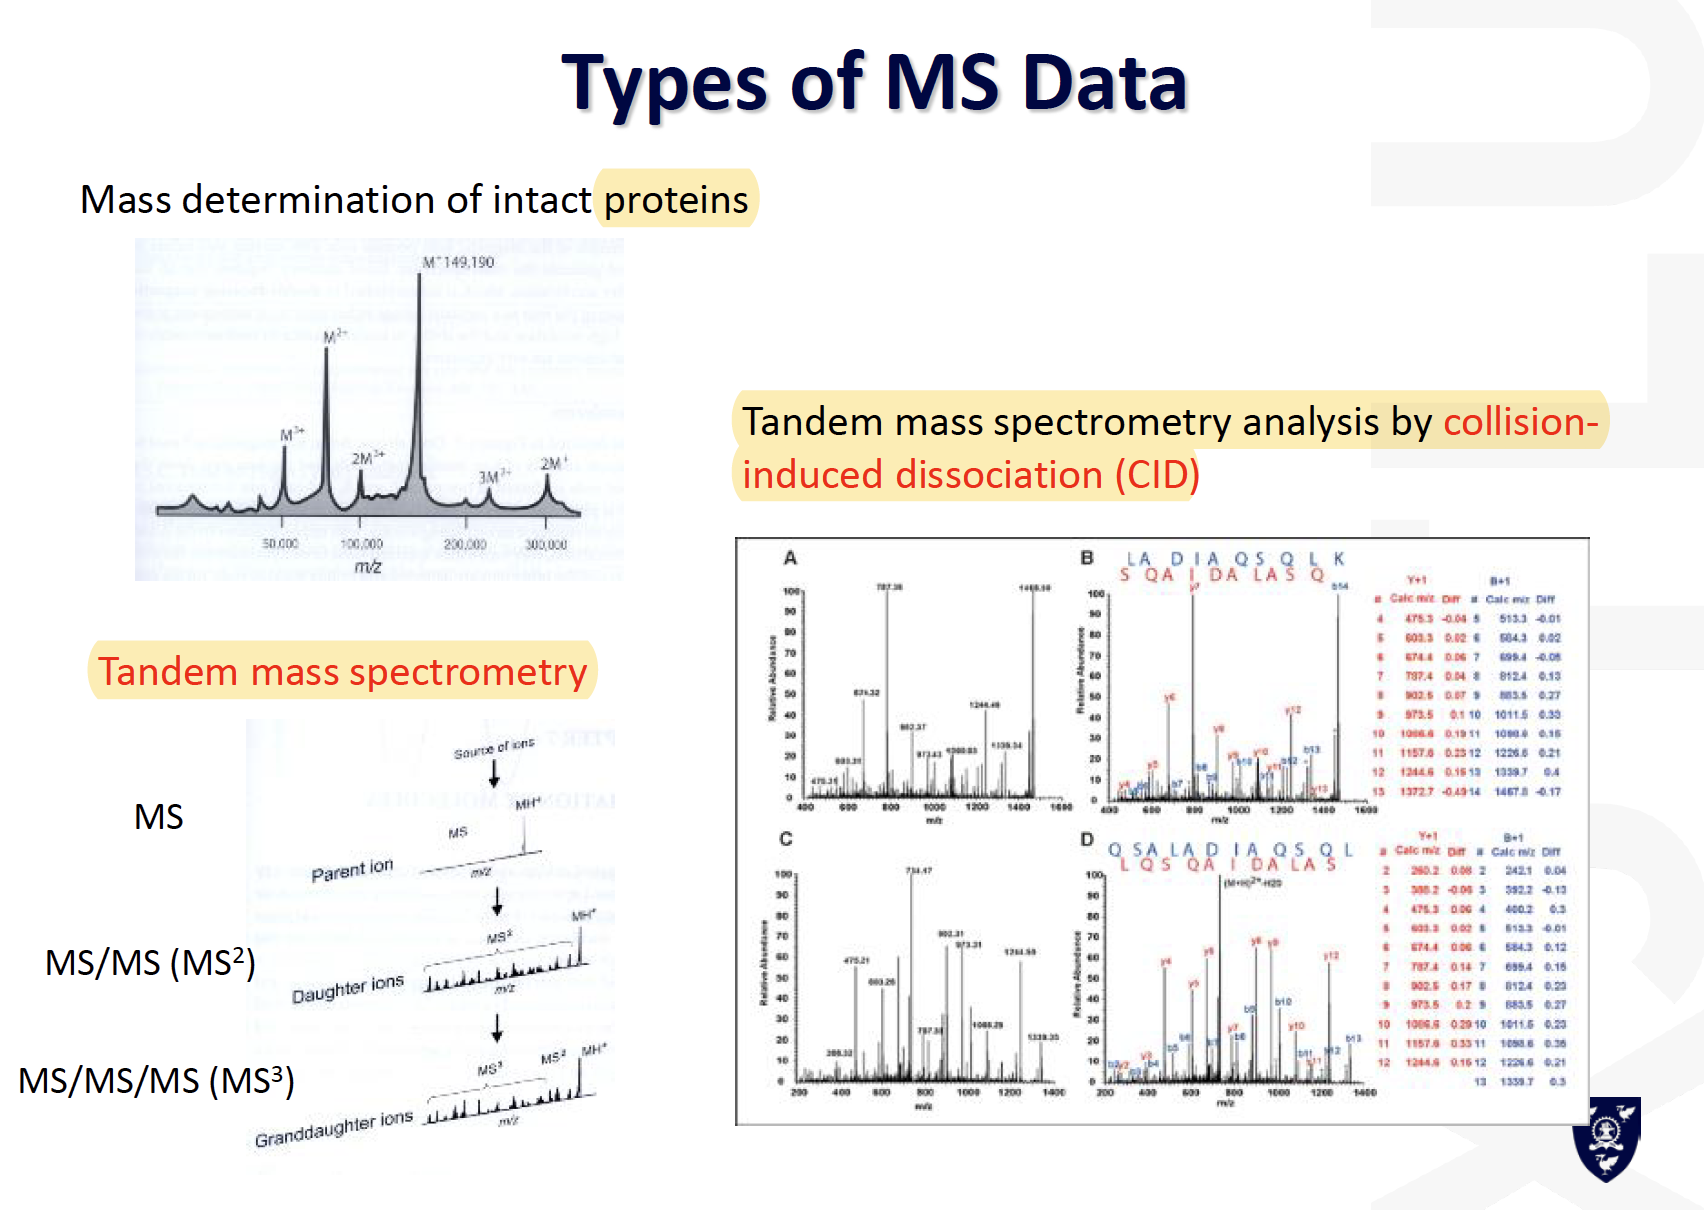
Types of MS data
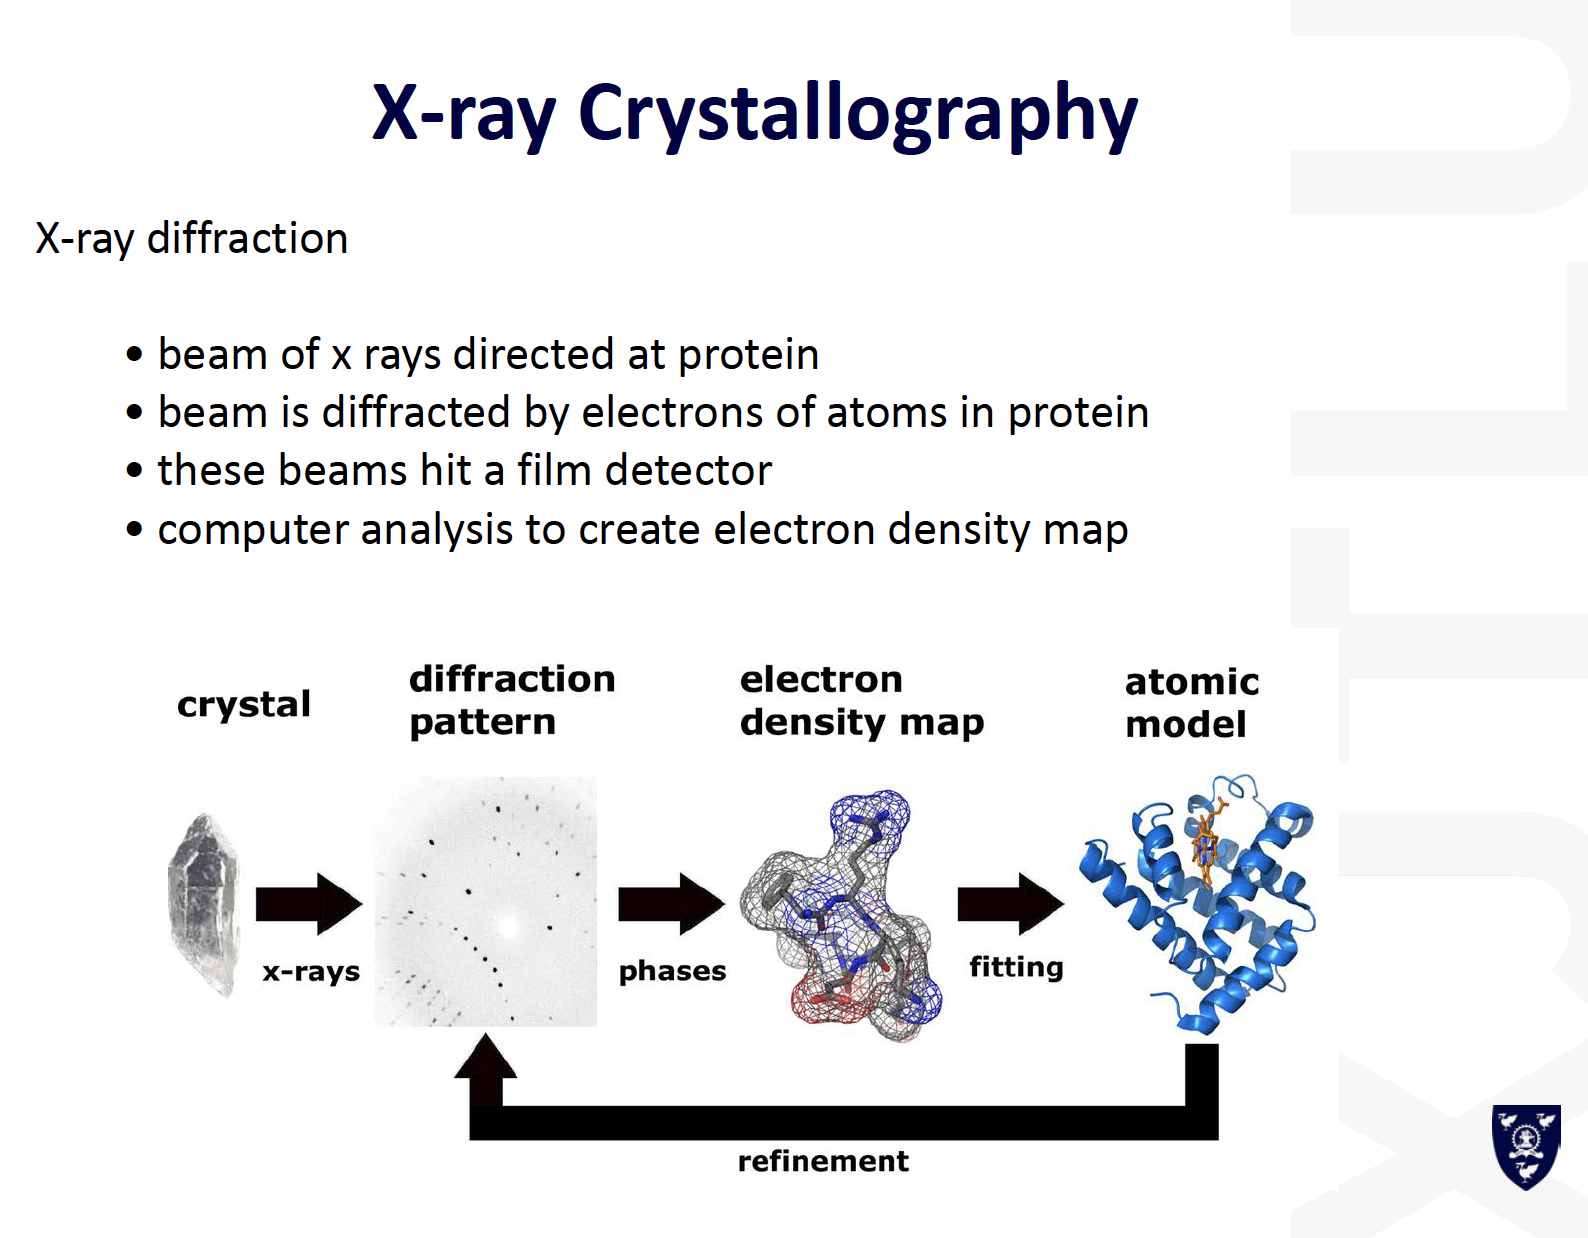
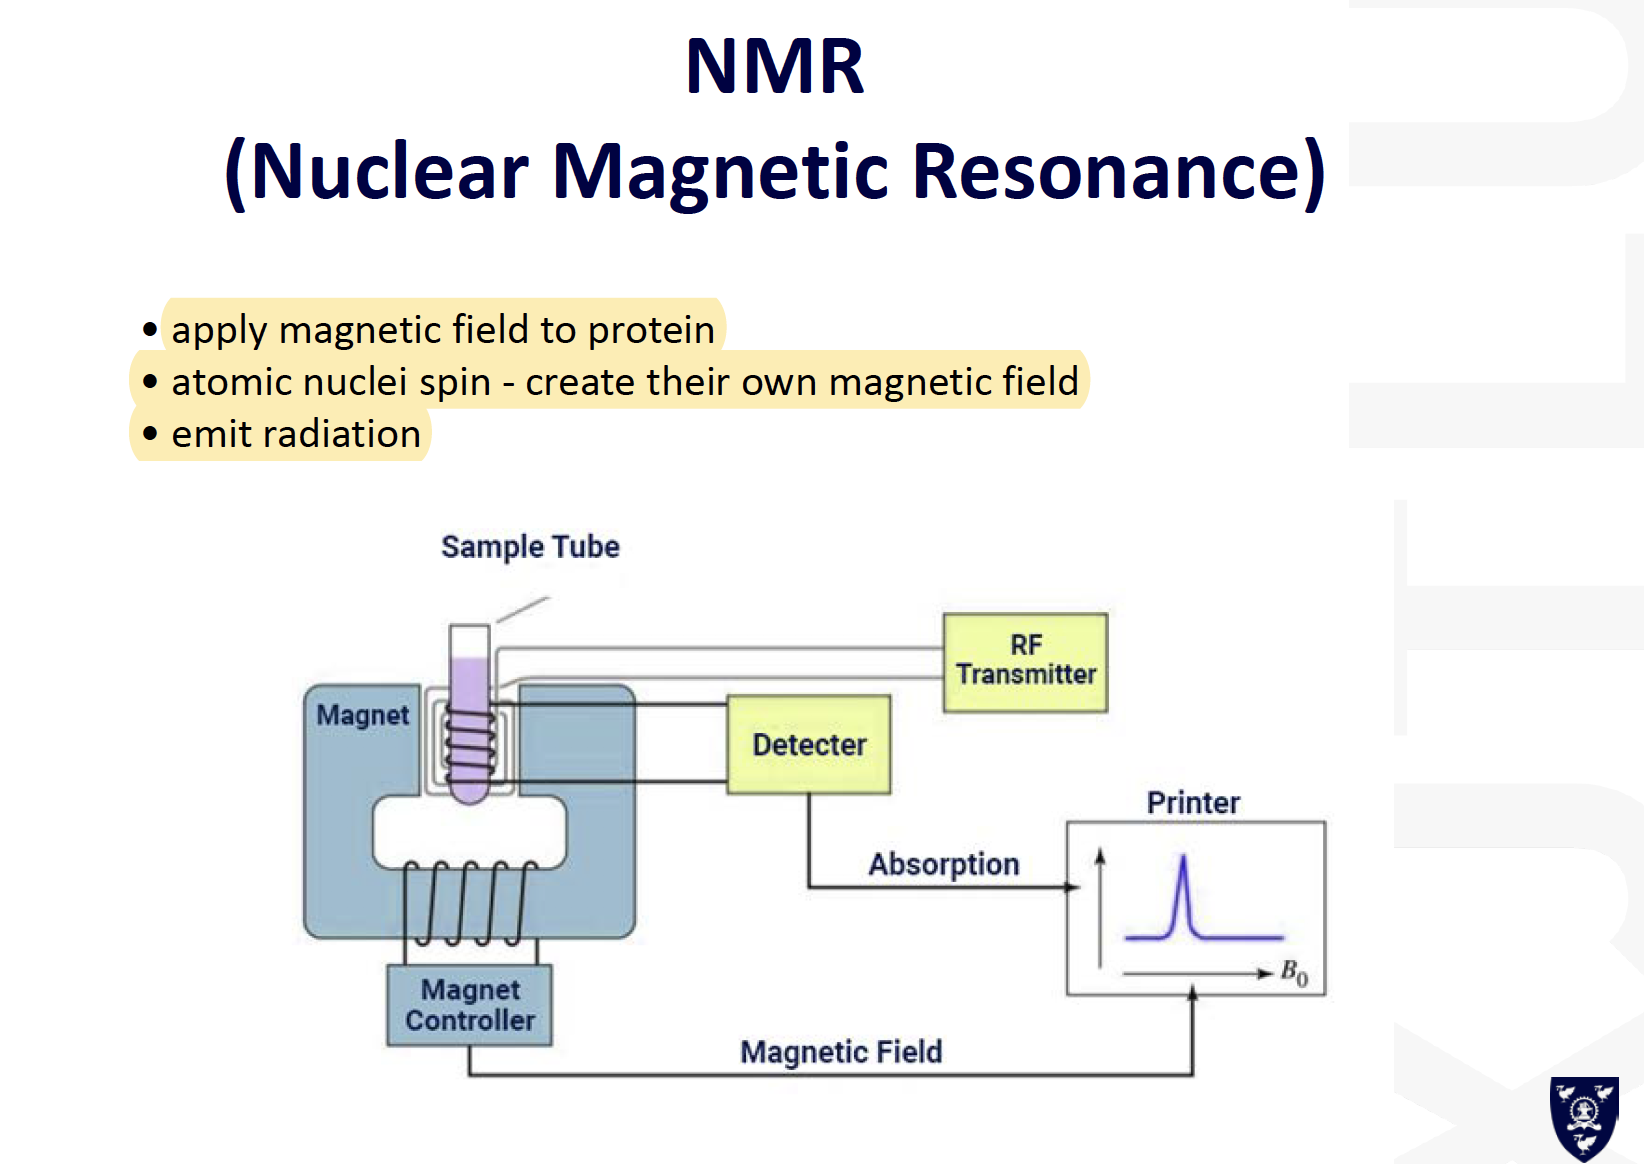
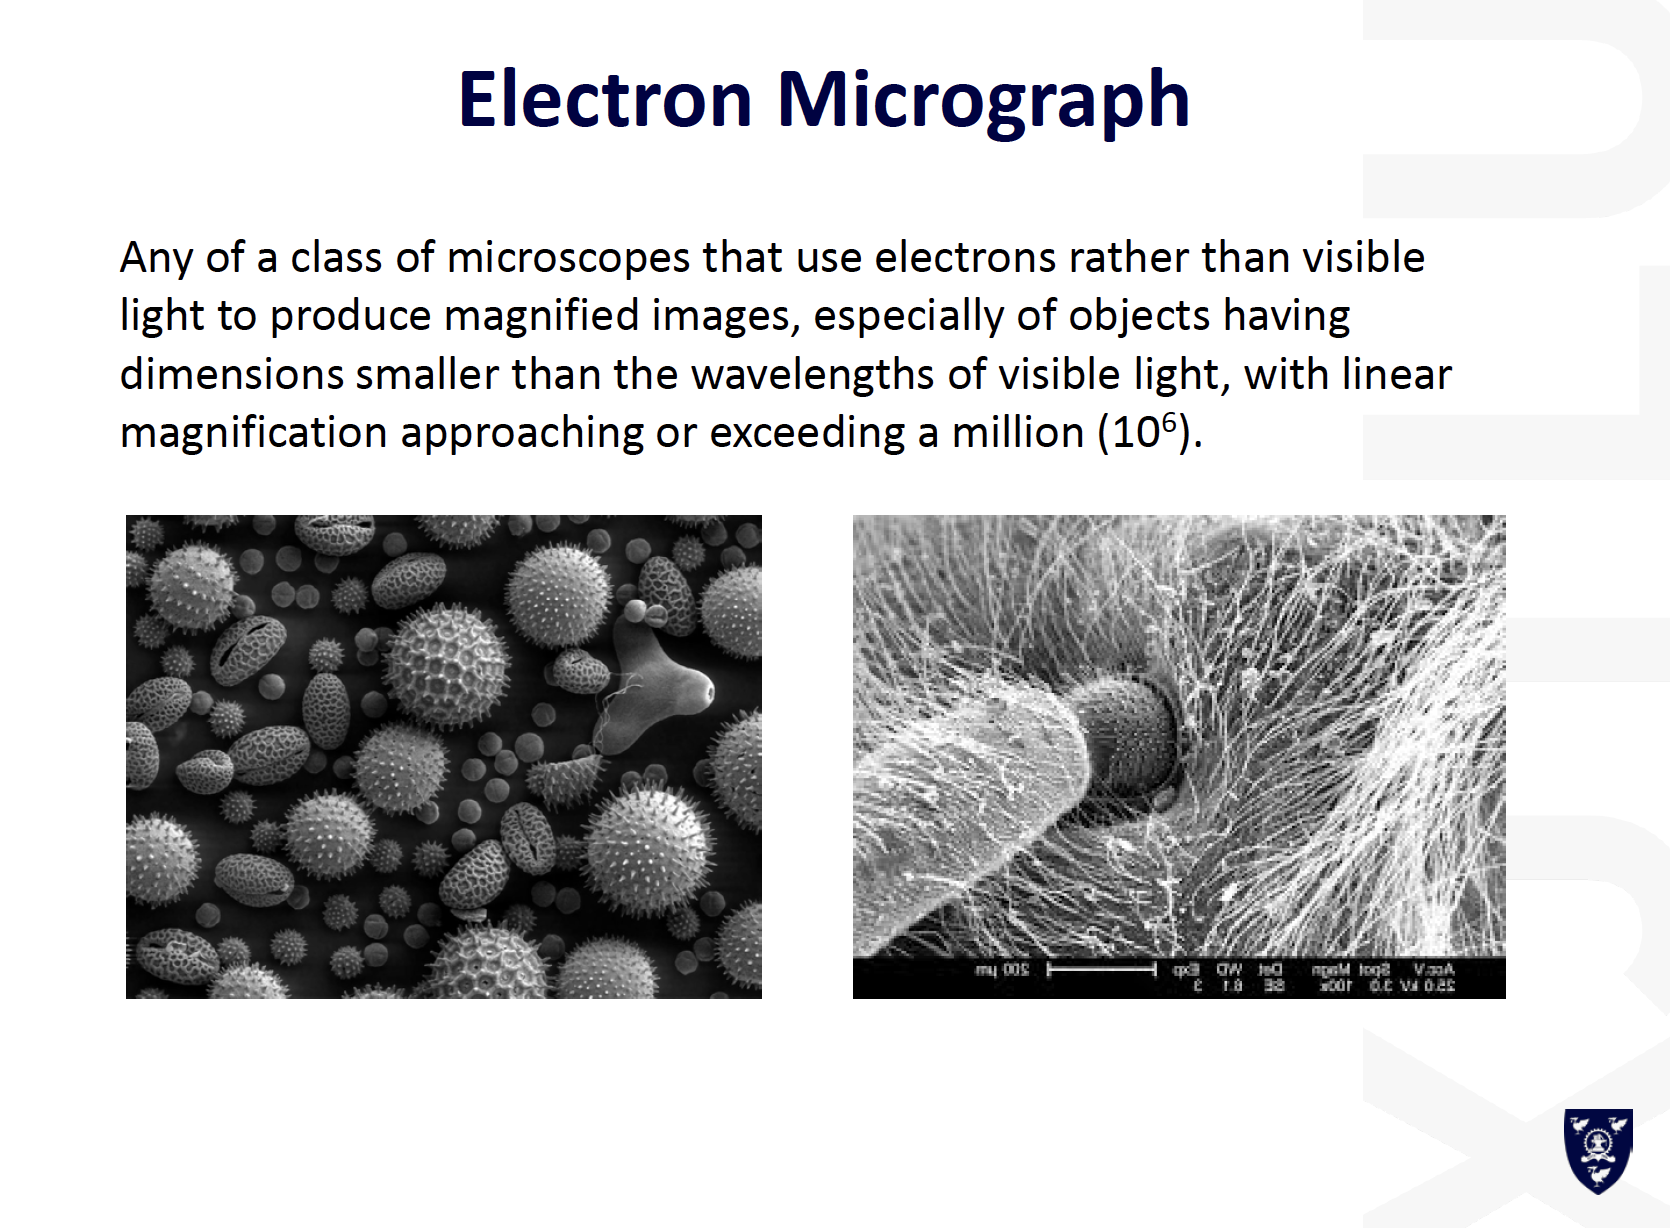
3D structure determination
- X-Ray Diffractionneed to crystalize (can be difficult)
- NMR small proteins (<25kD)
- Electron Micrographpoor resolution
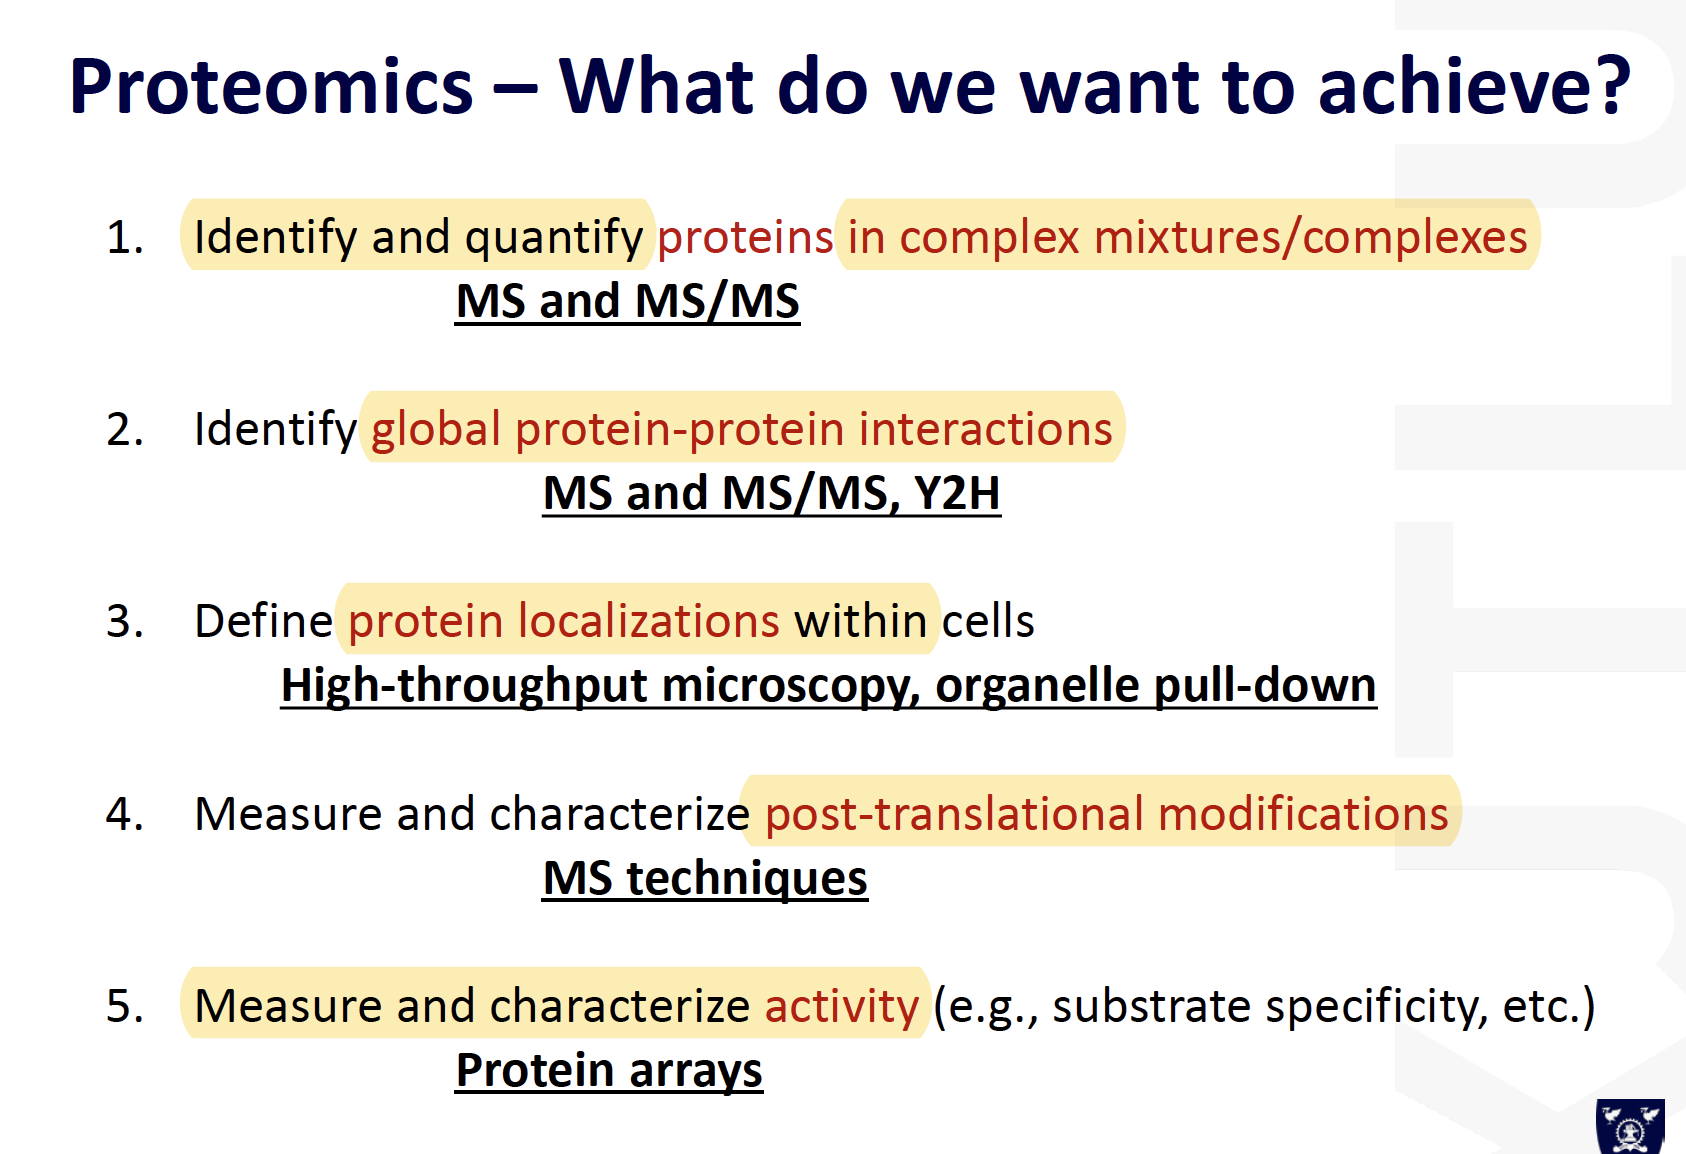
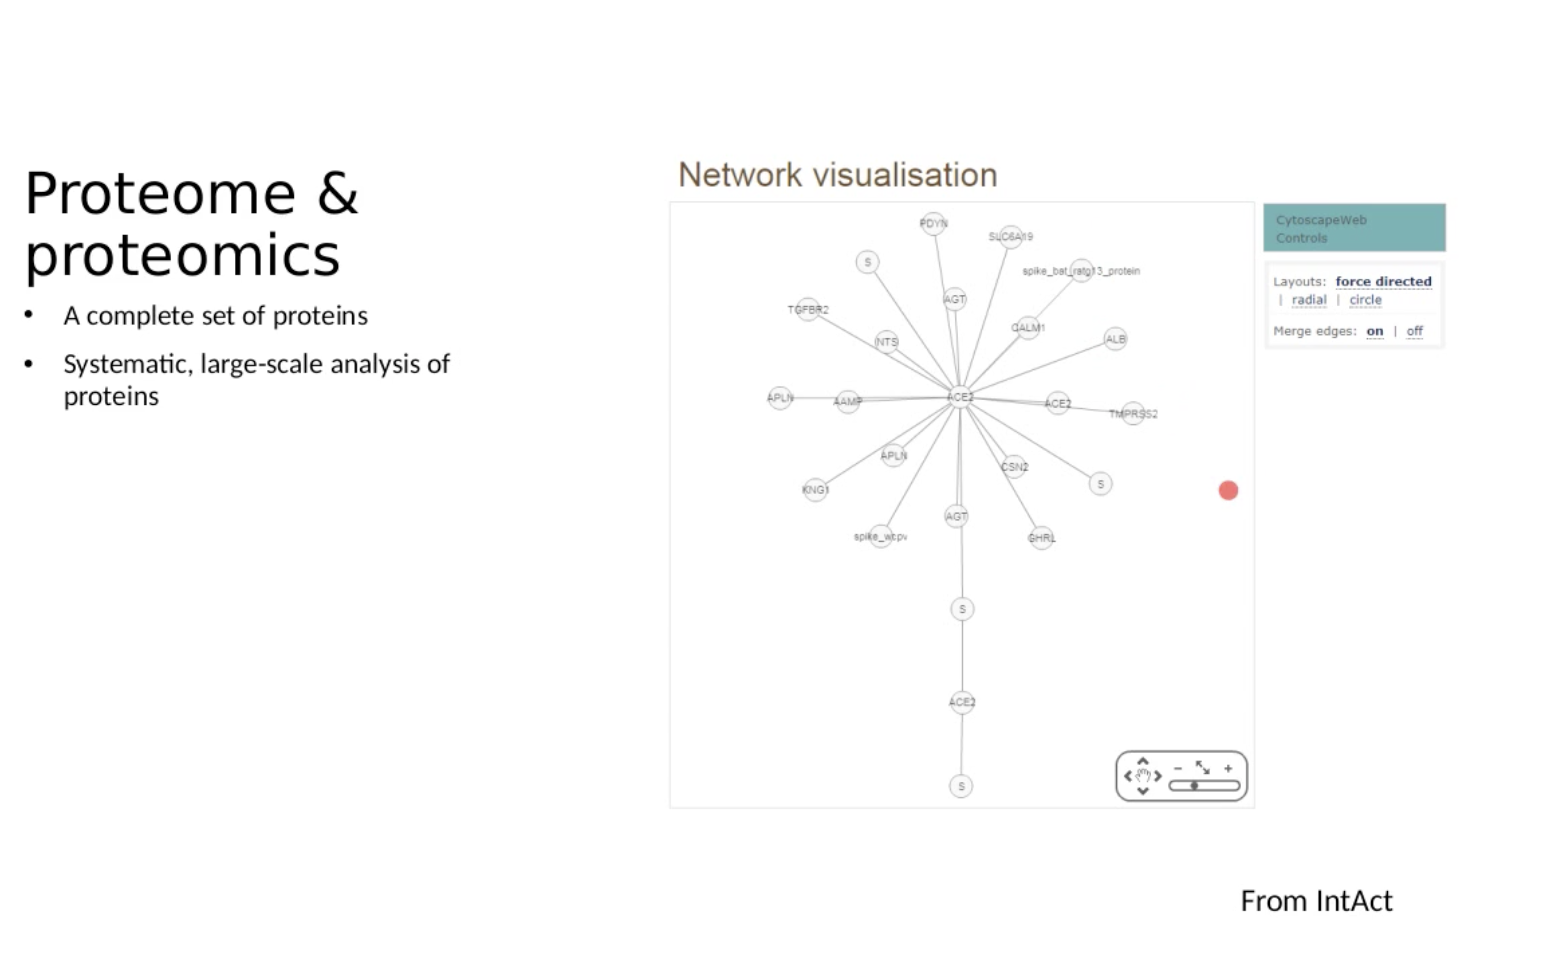
Identification of proteins in complex mixtures
Proteomics achievement
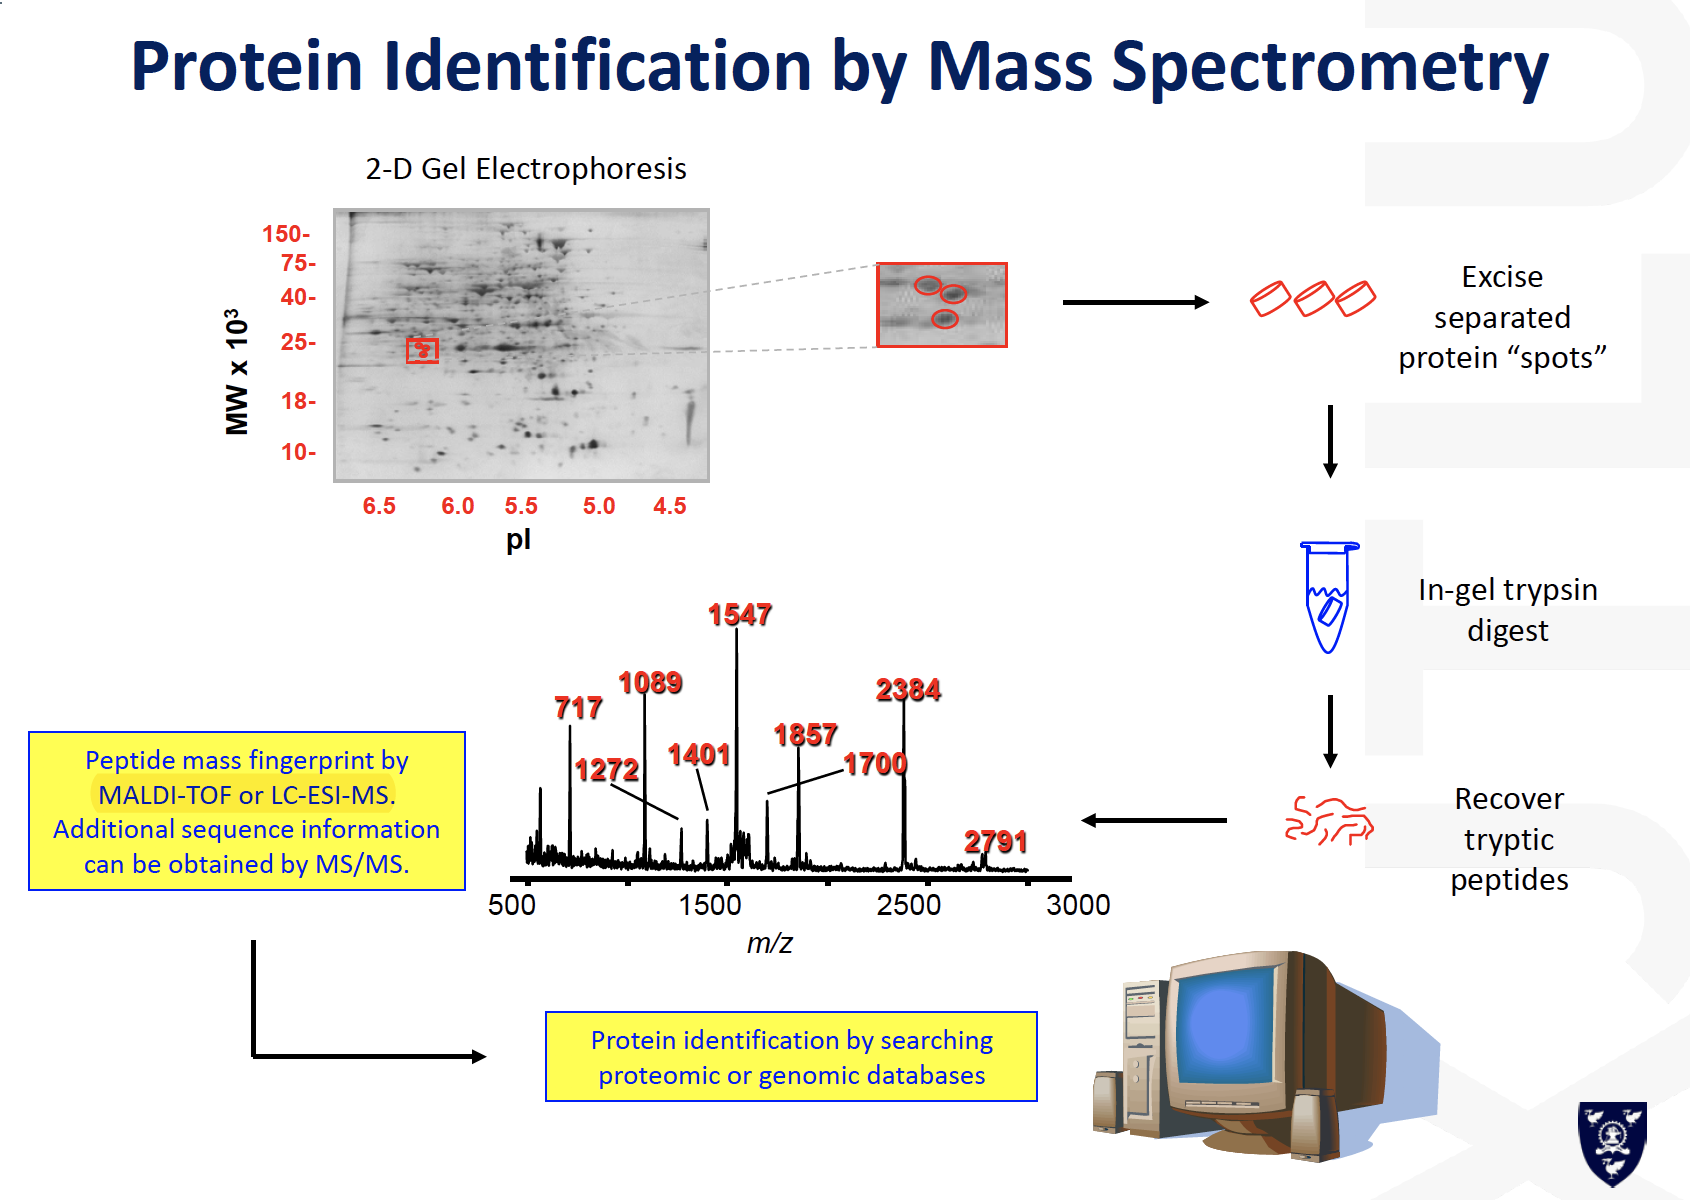
Protein Identification by Mass Spectrometry
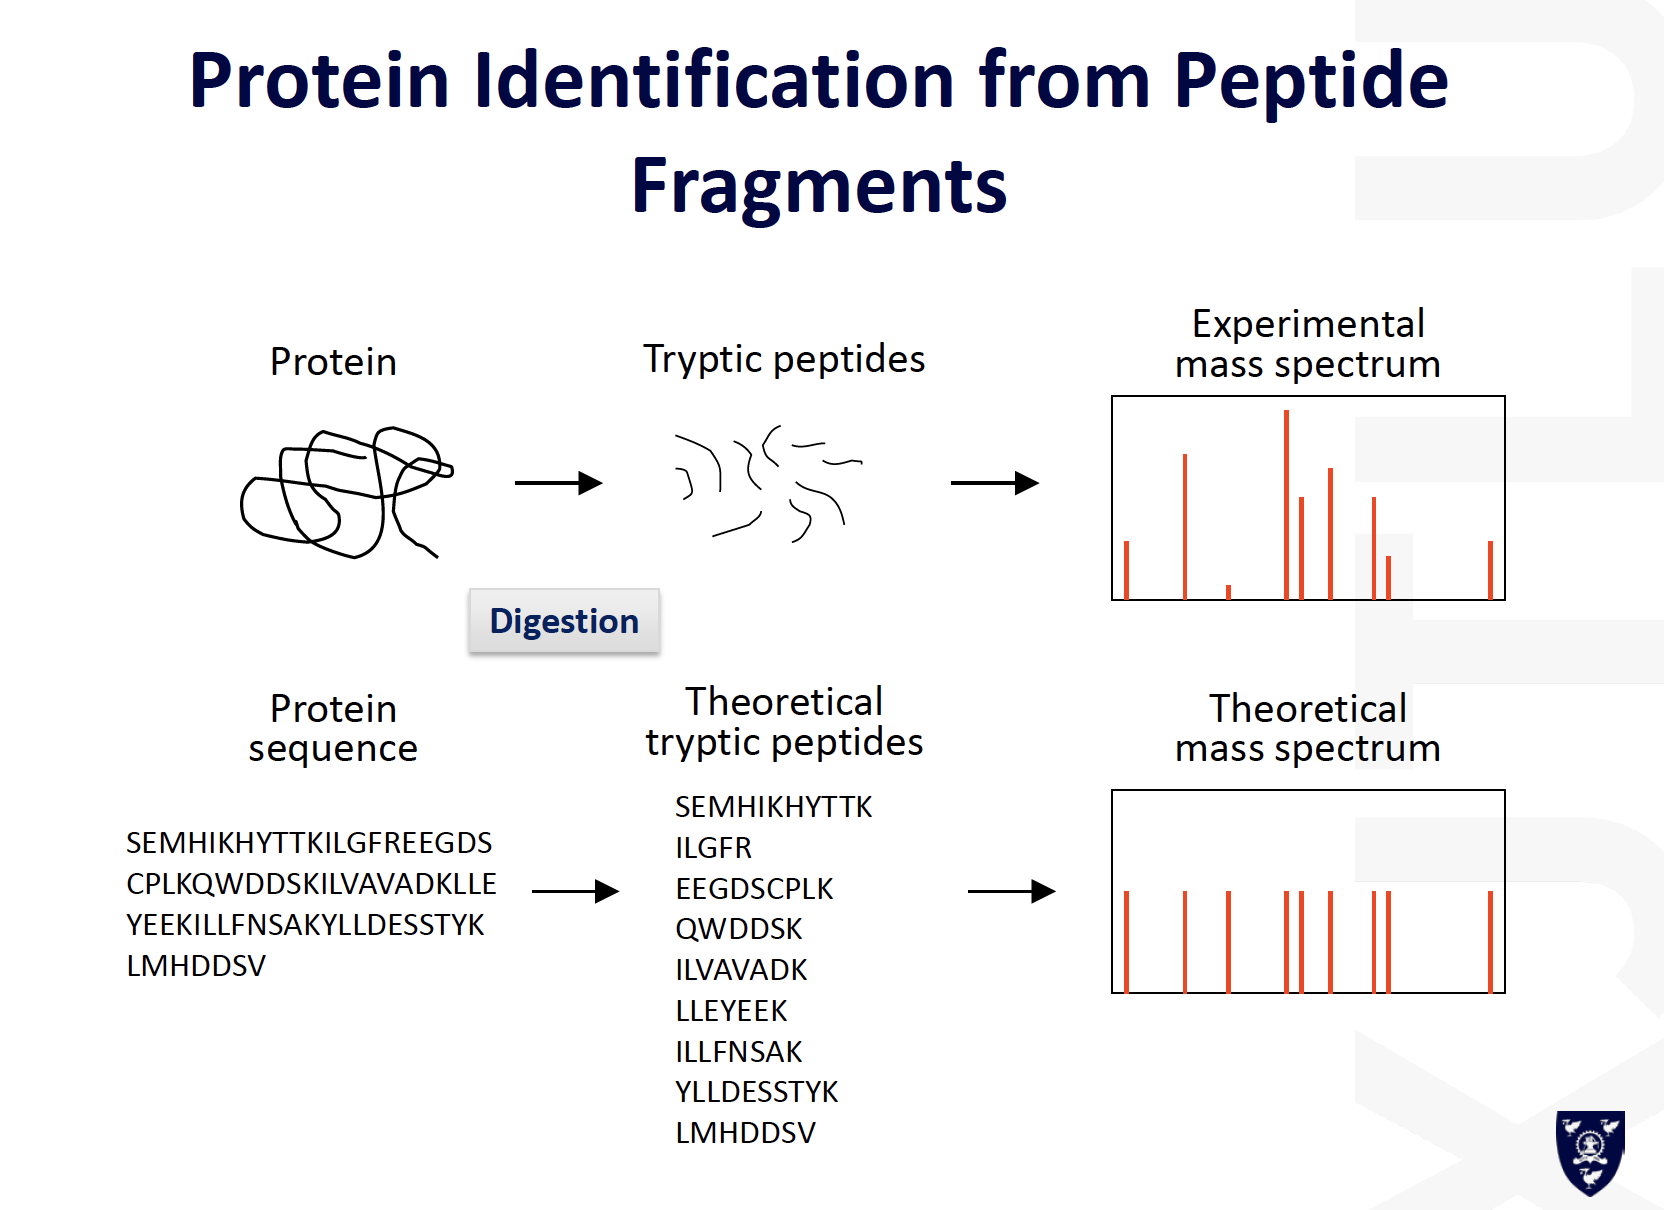
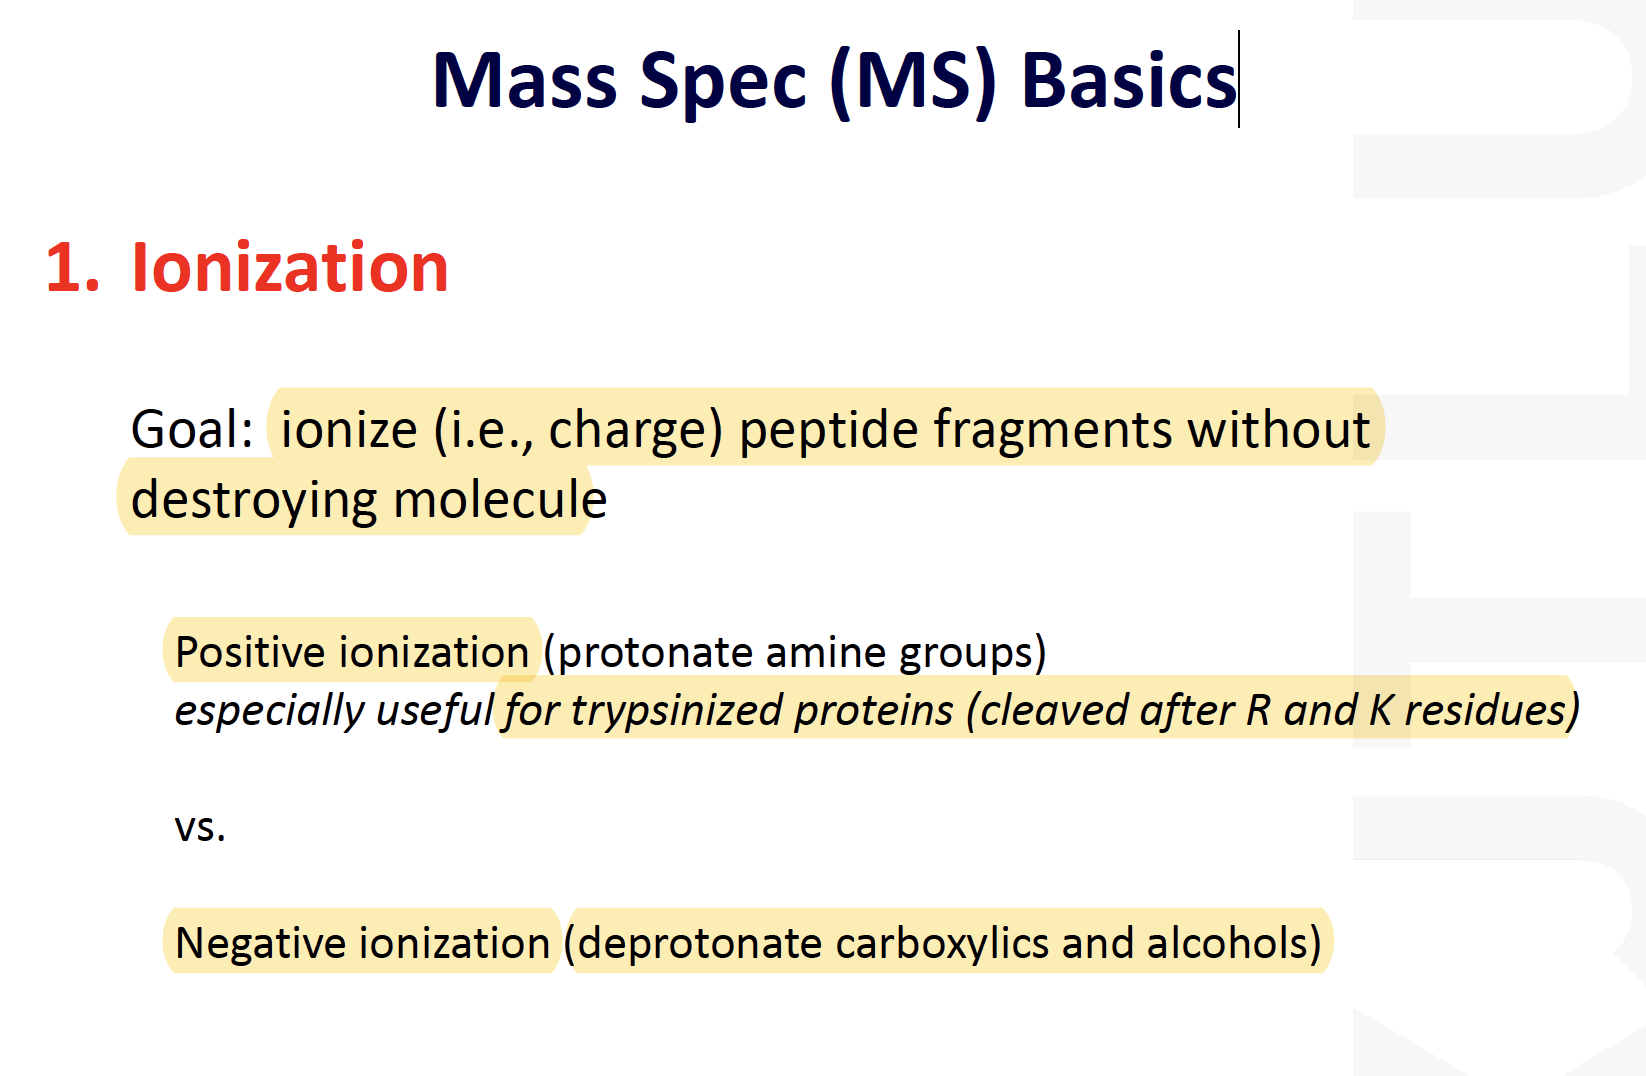
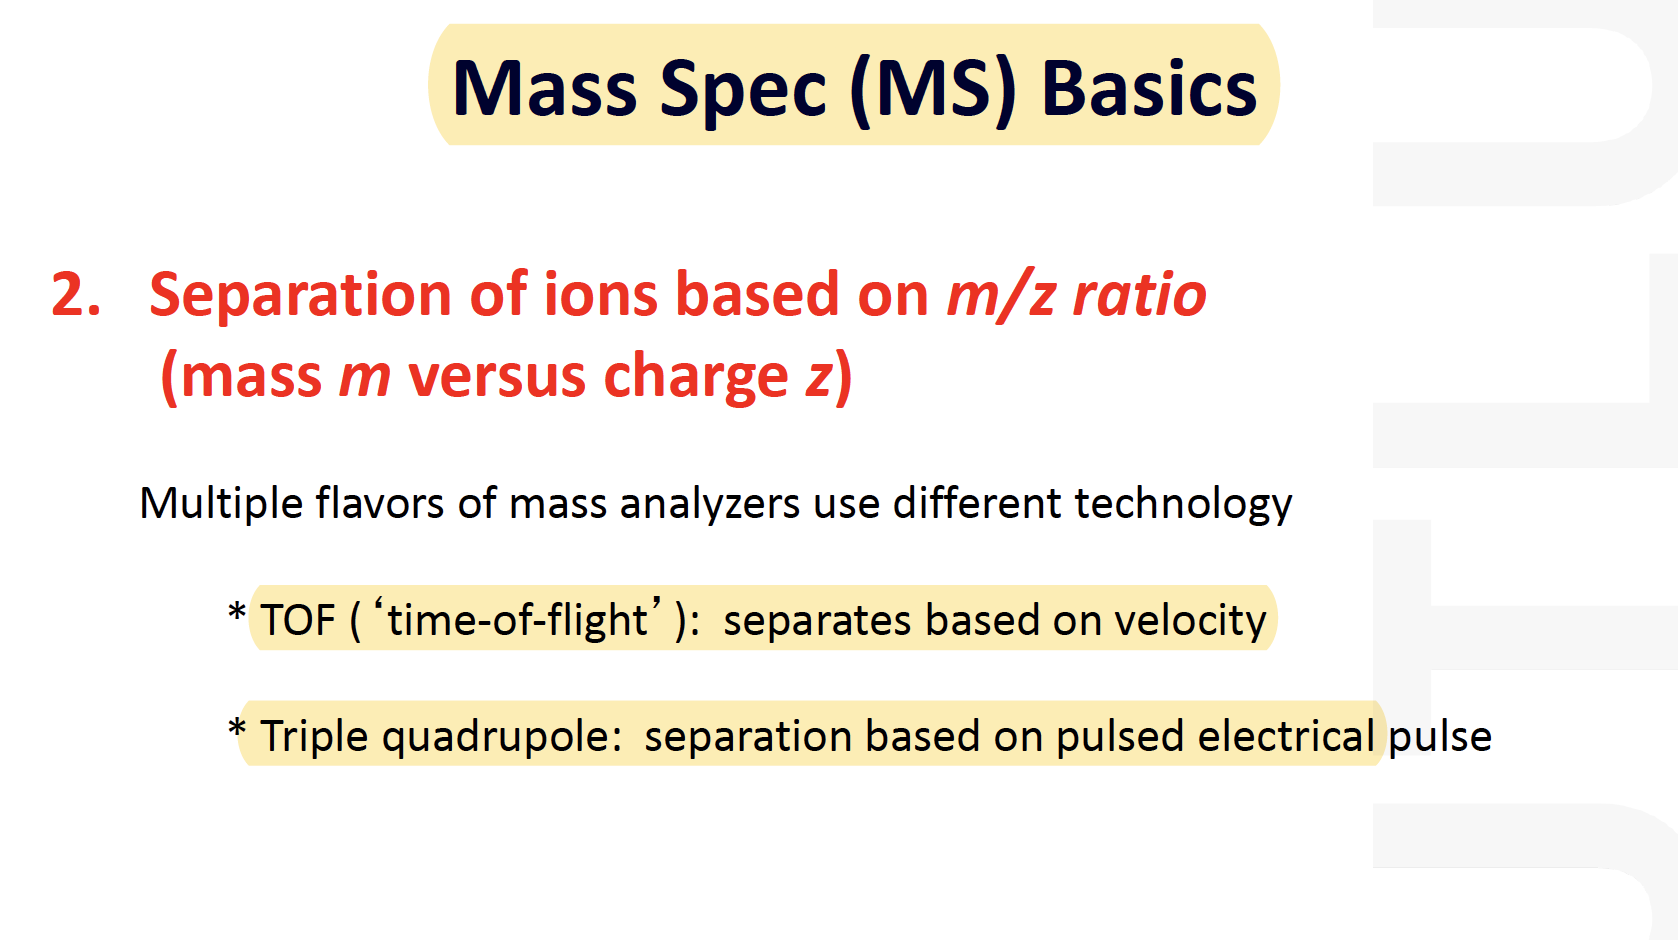
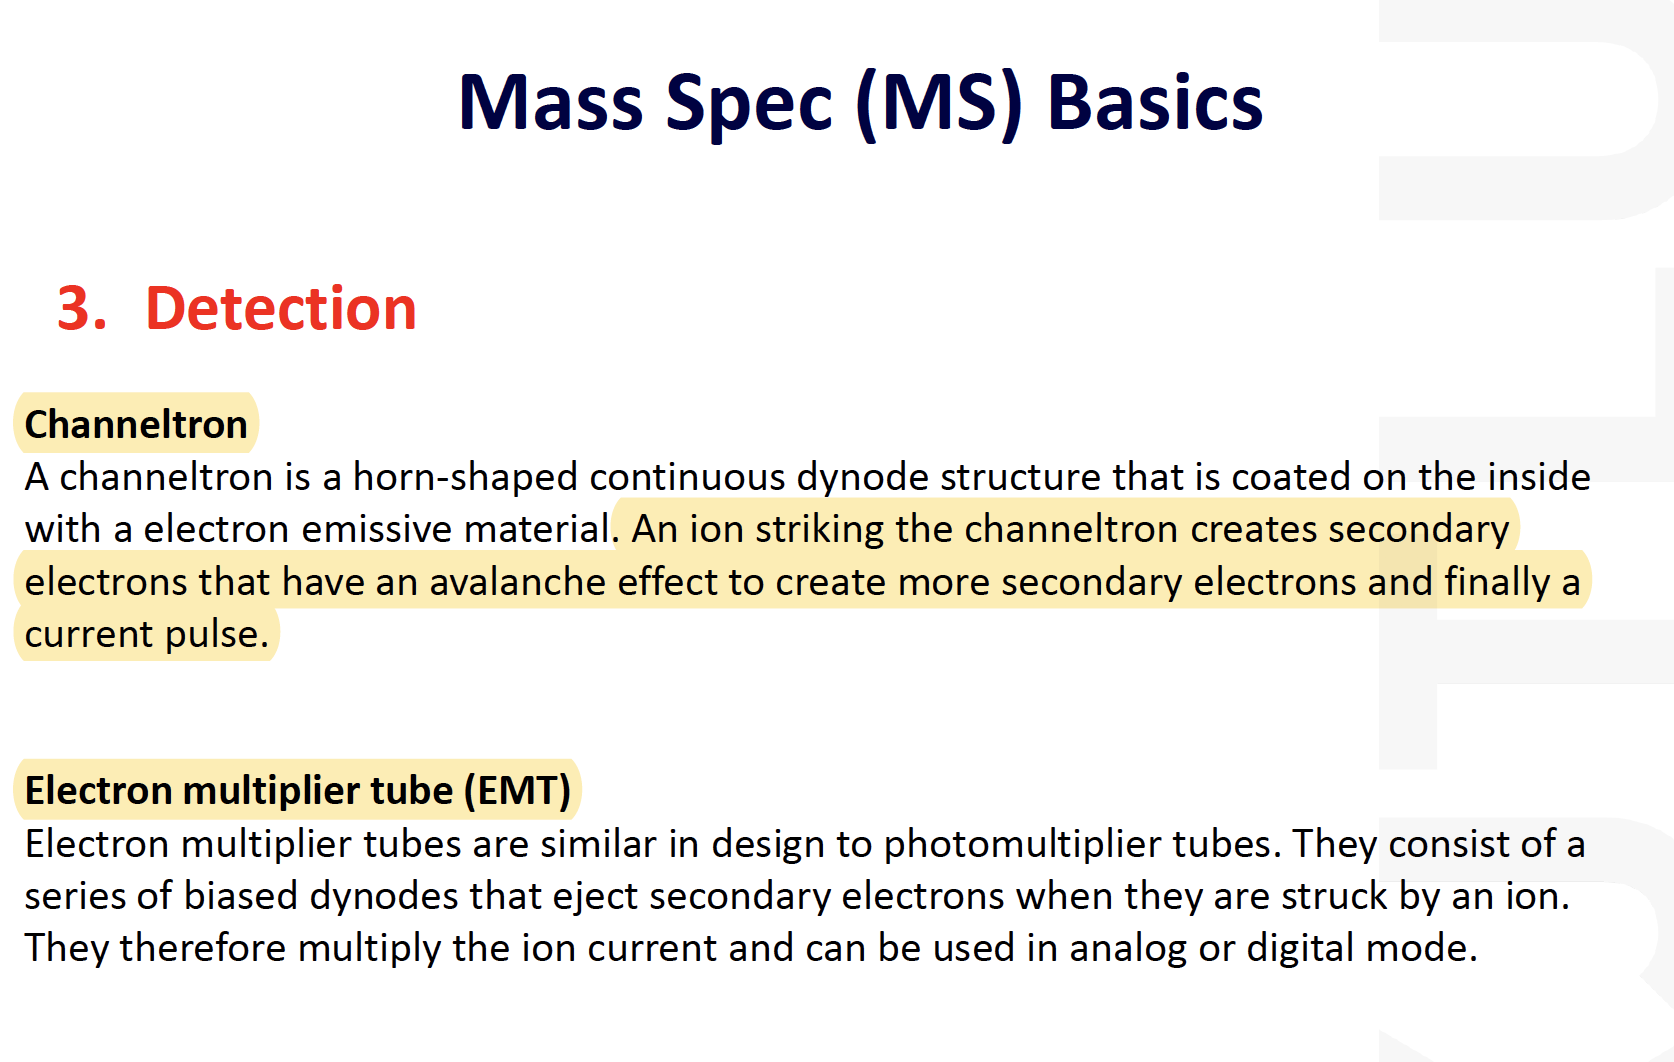
Mass Spec (MS) Basics
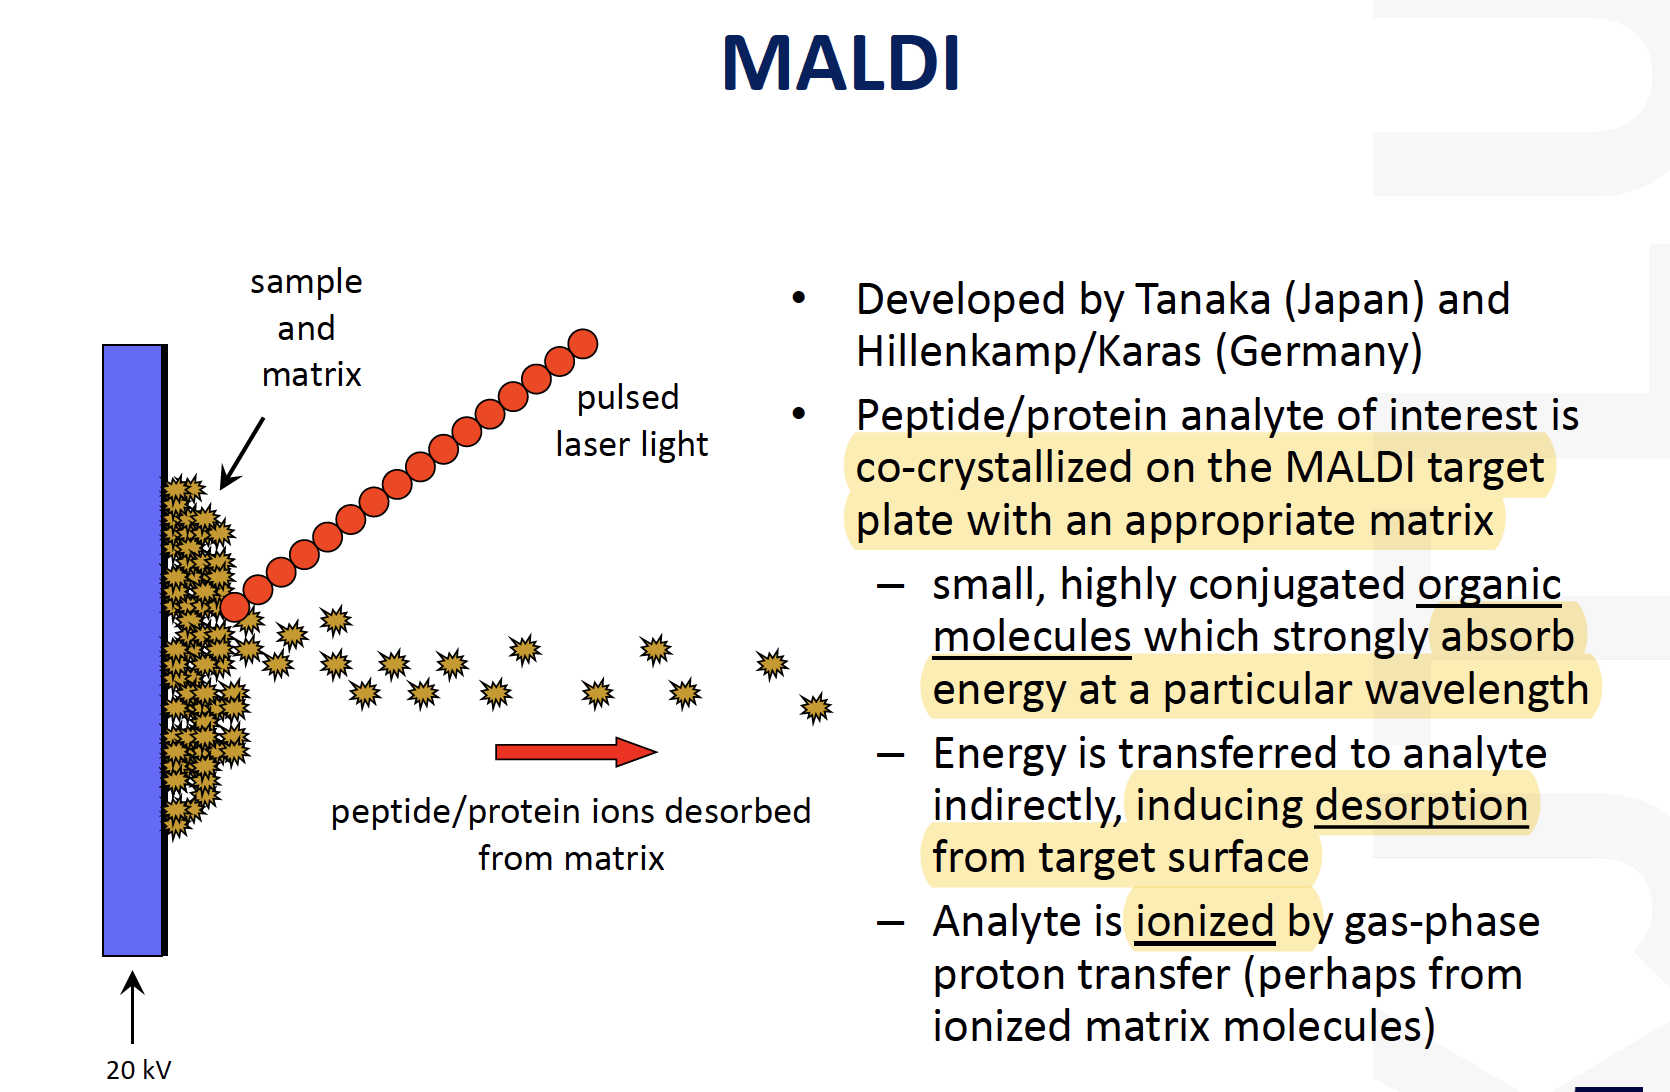
MALDI
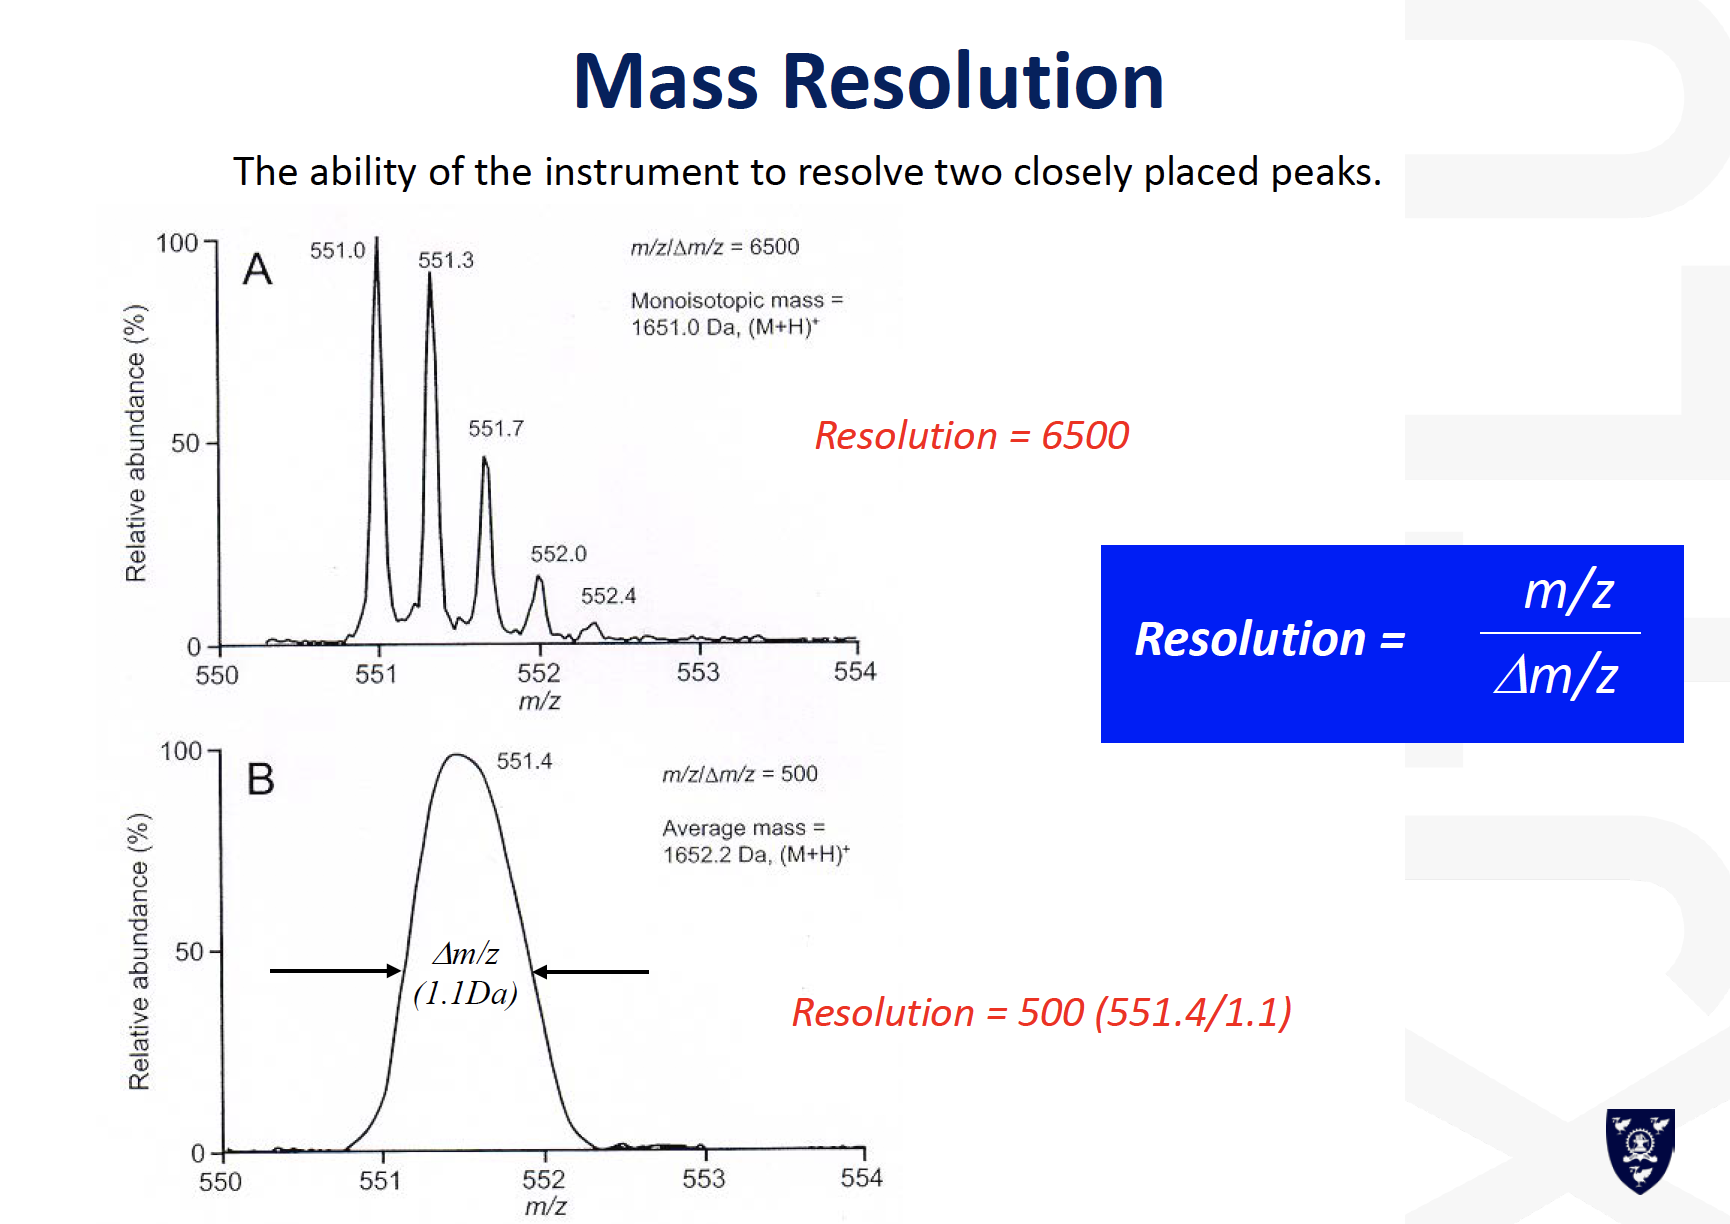
Mass resolution
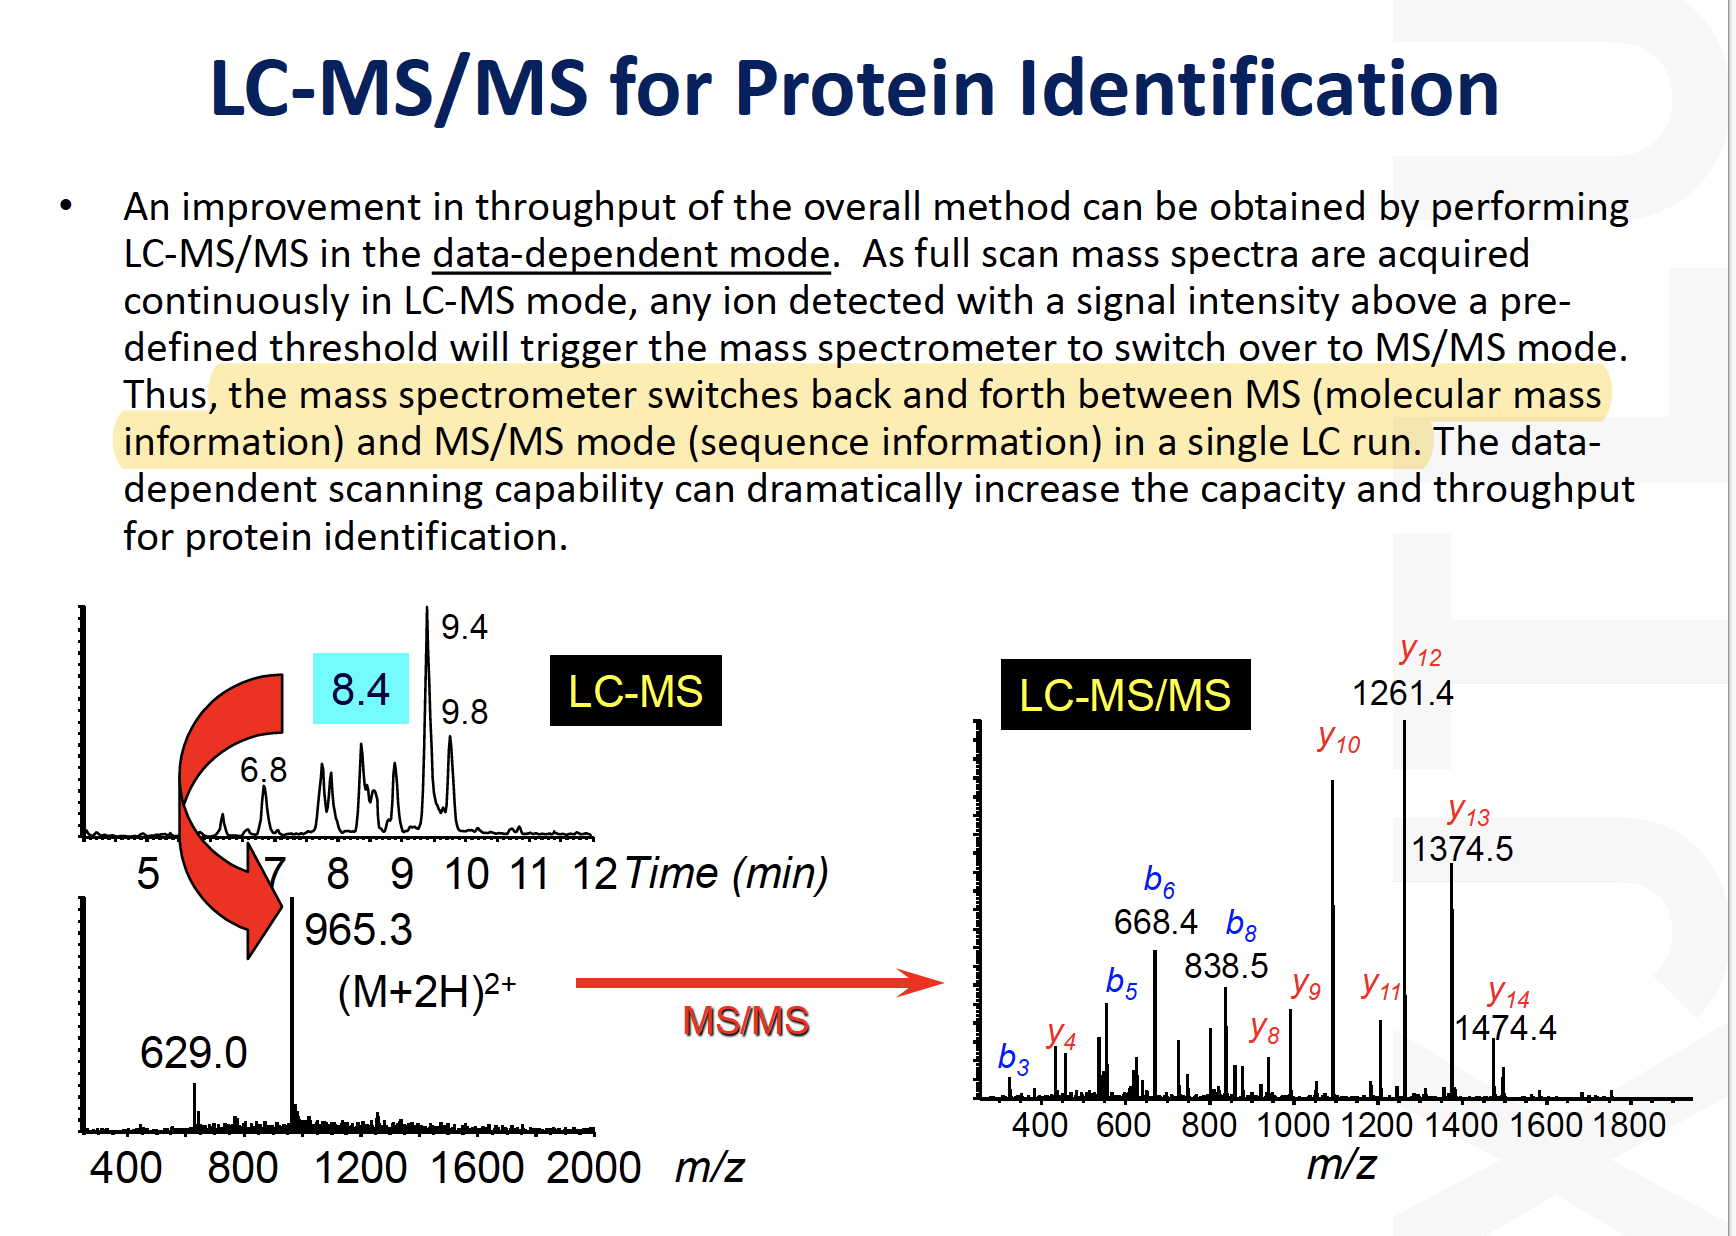
LC-MS/MS for protein identification
Mass spectrometer is always right
Advanced proteomic techniques
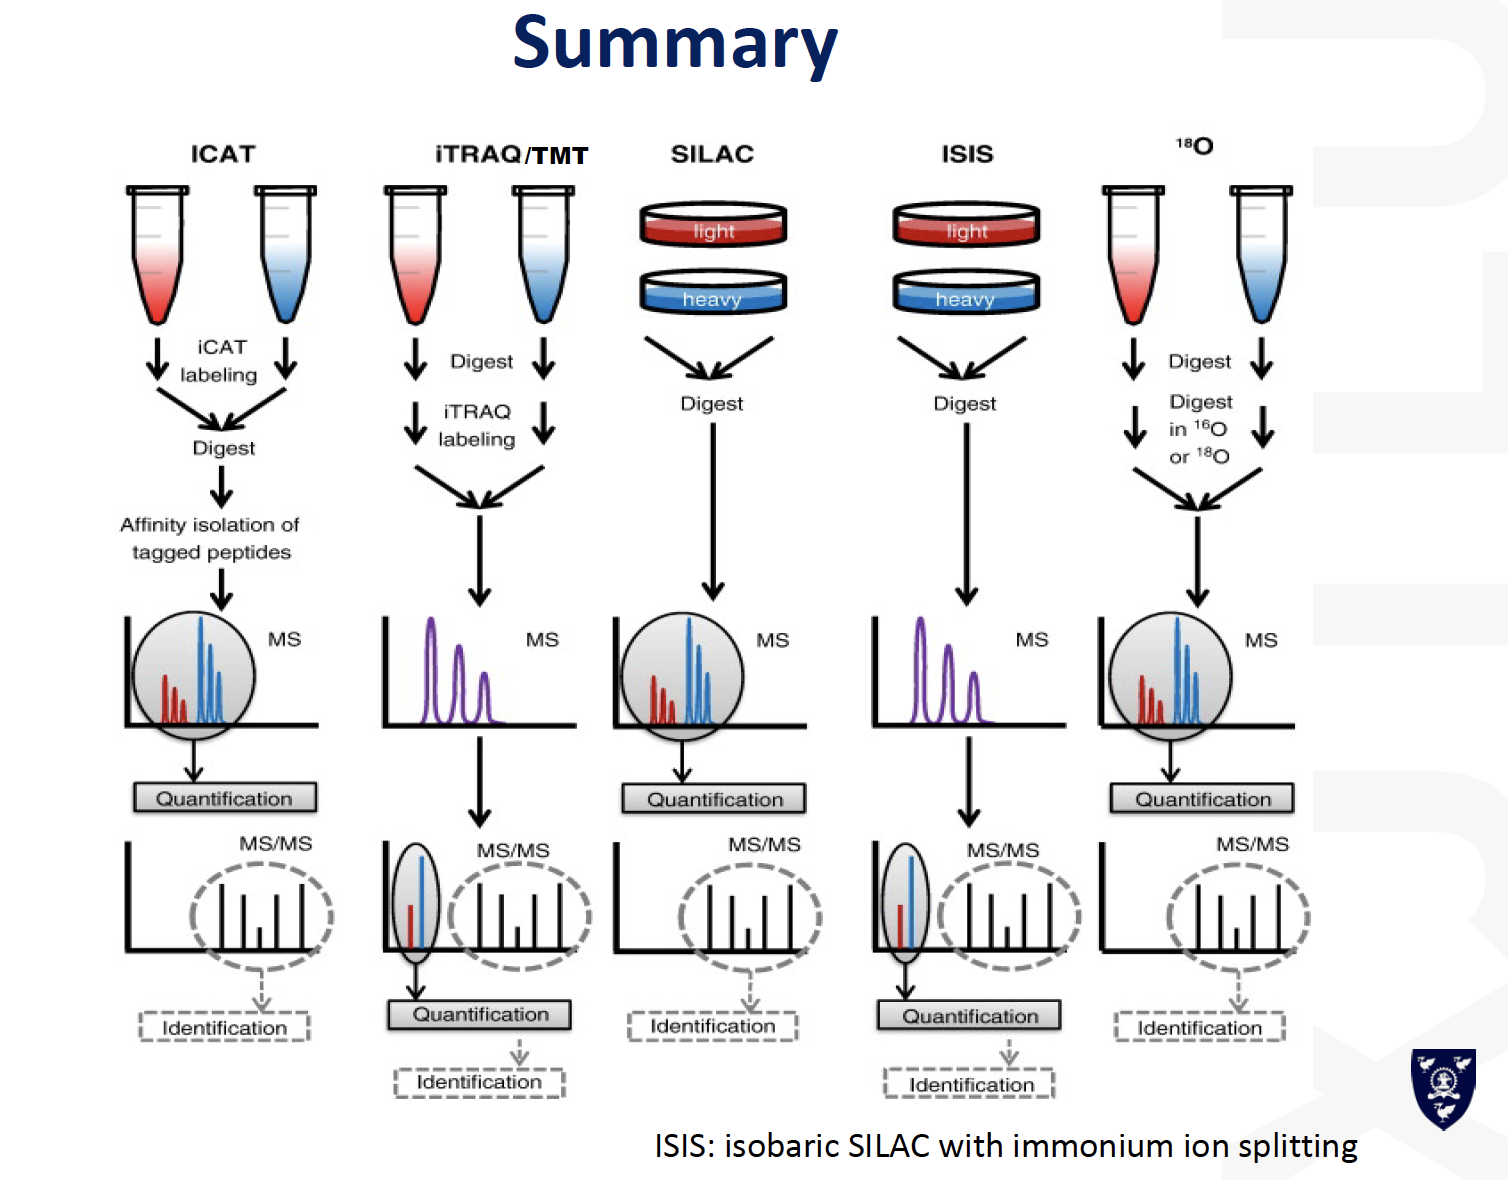
Summary of existing technology
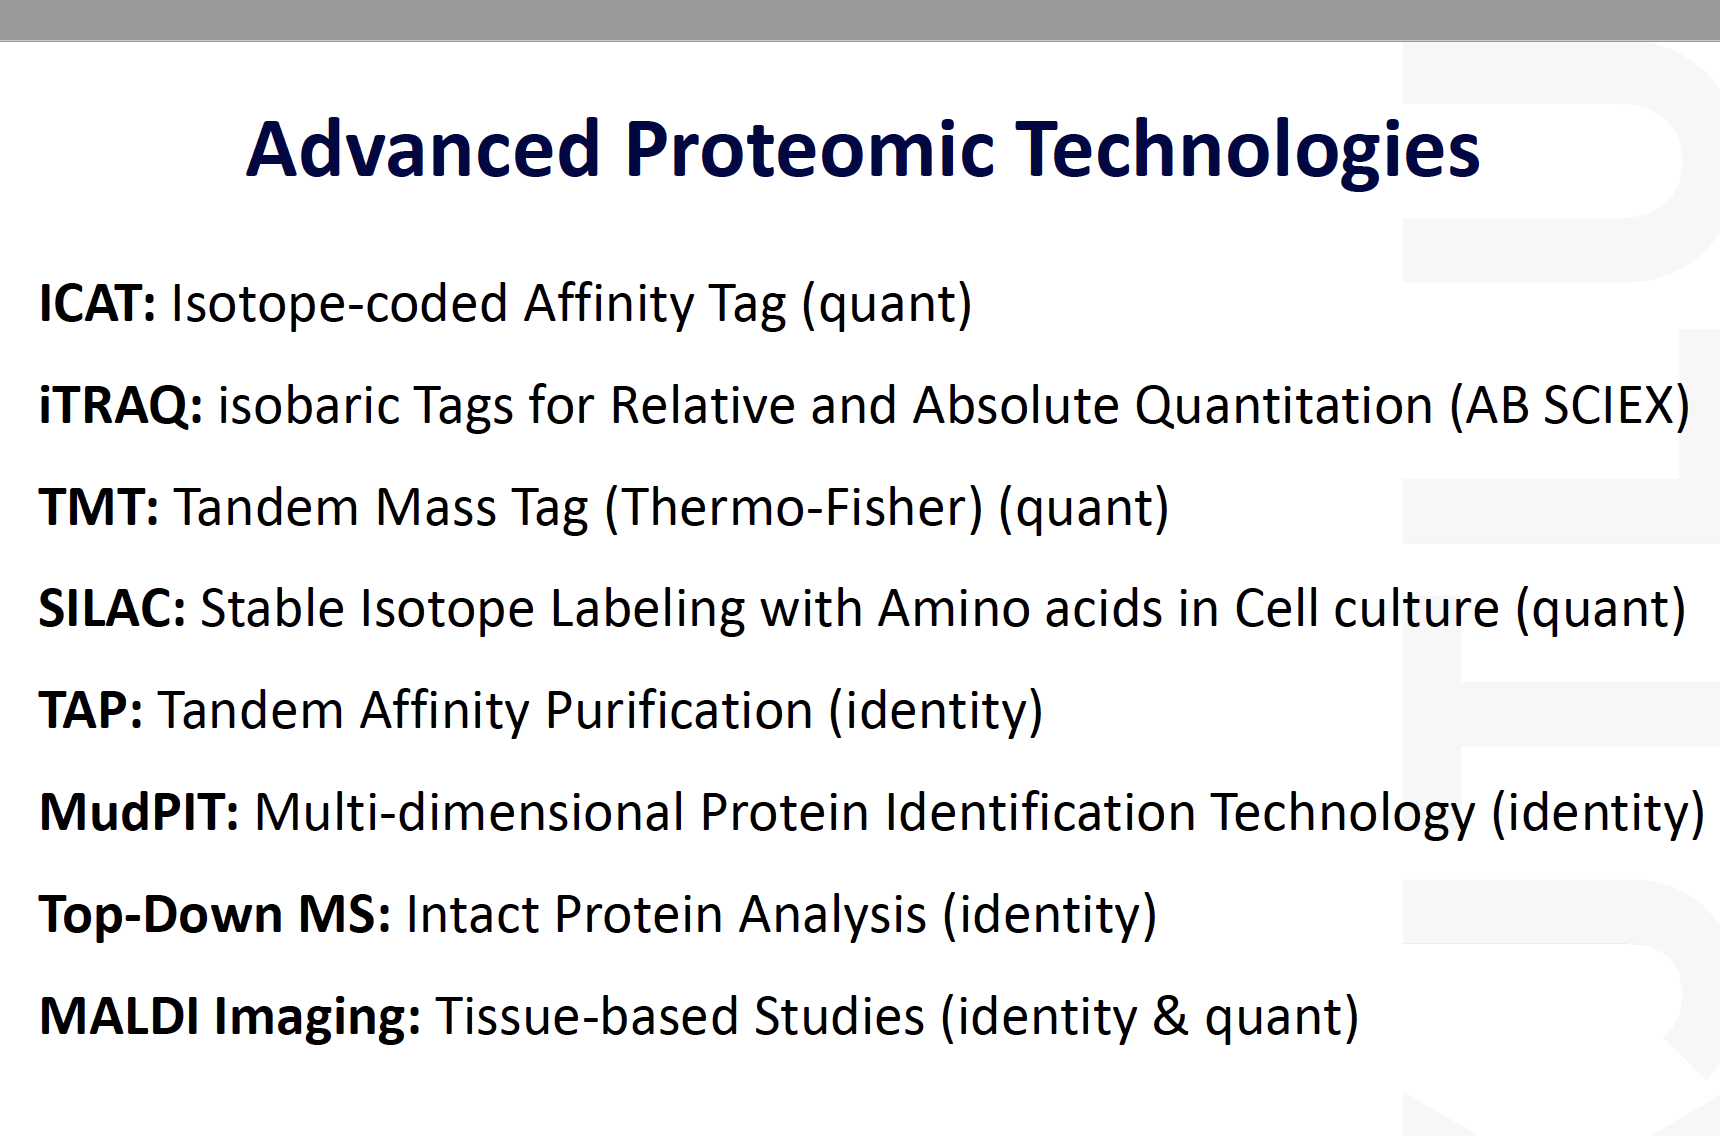
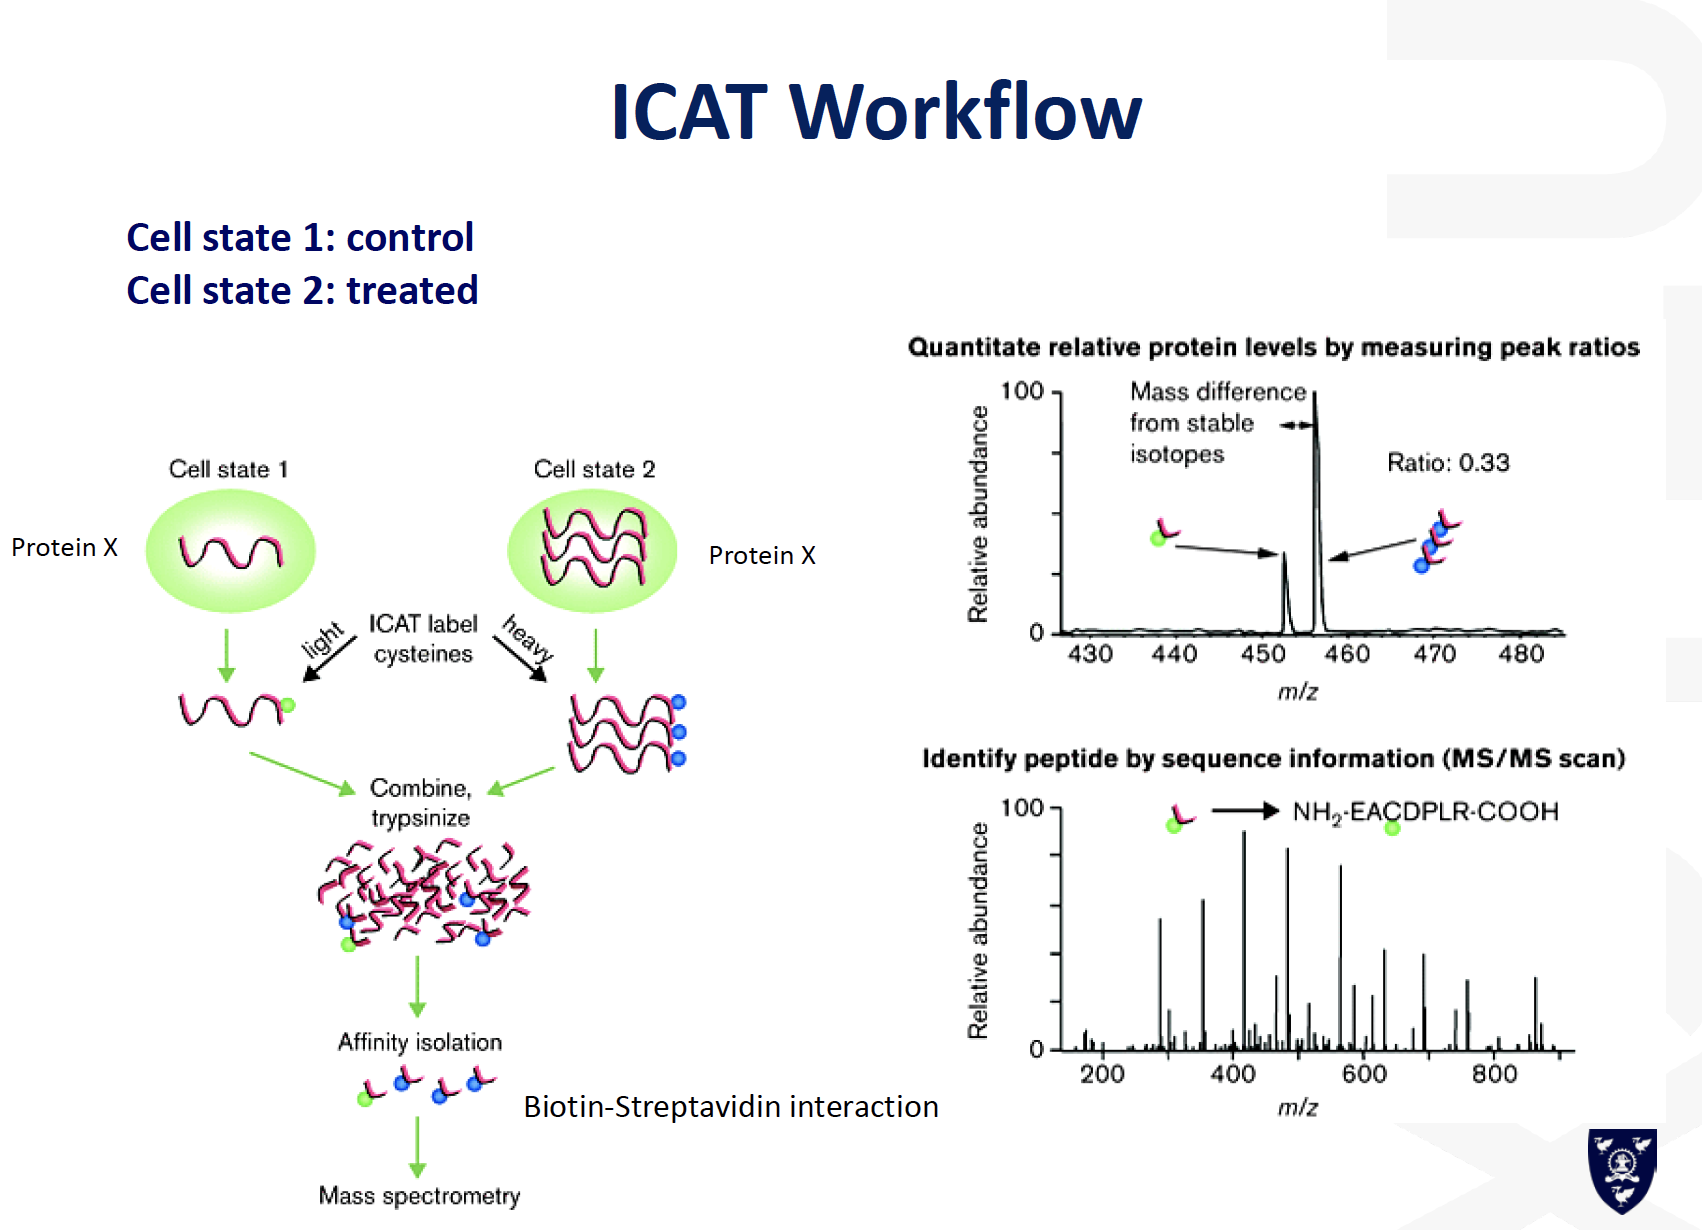
ICAT

Top-Down or Bottom-up analysis
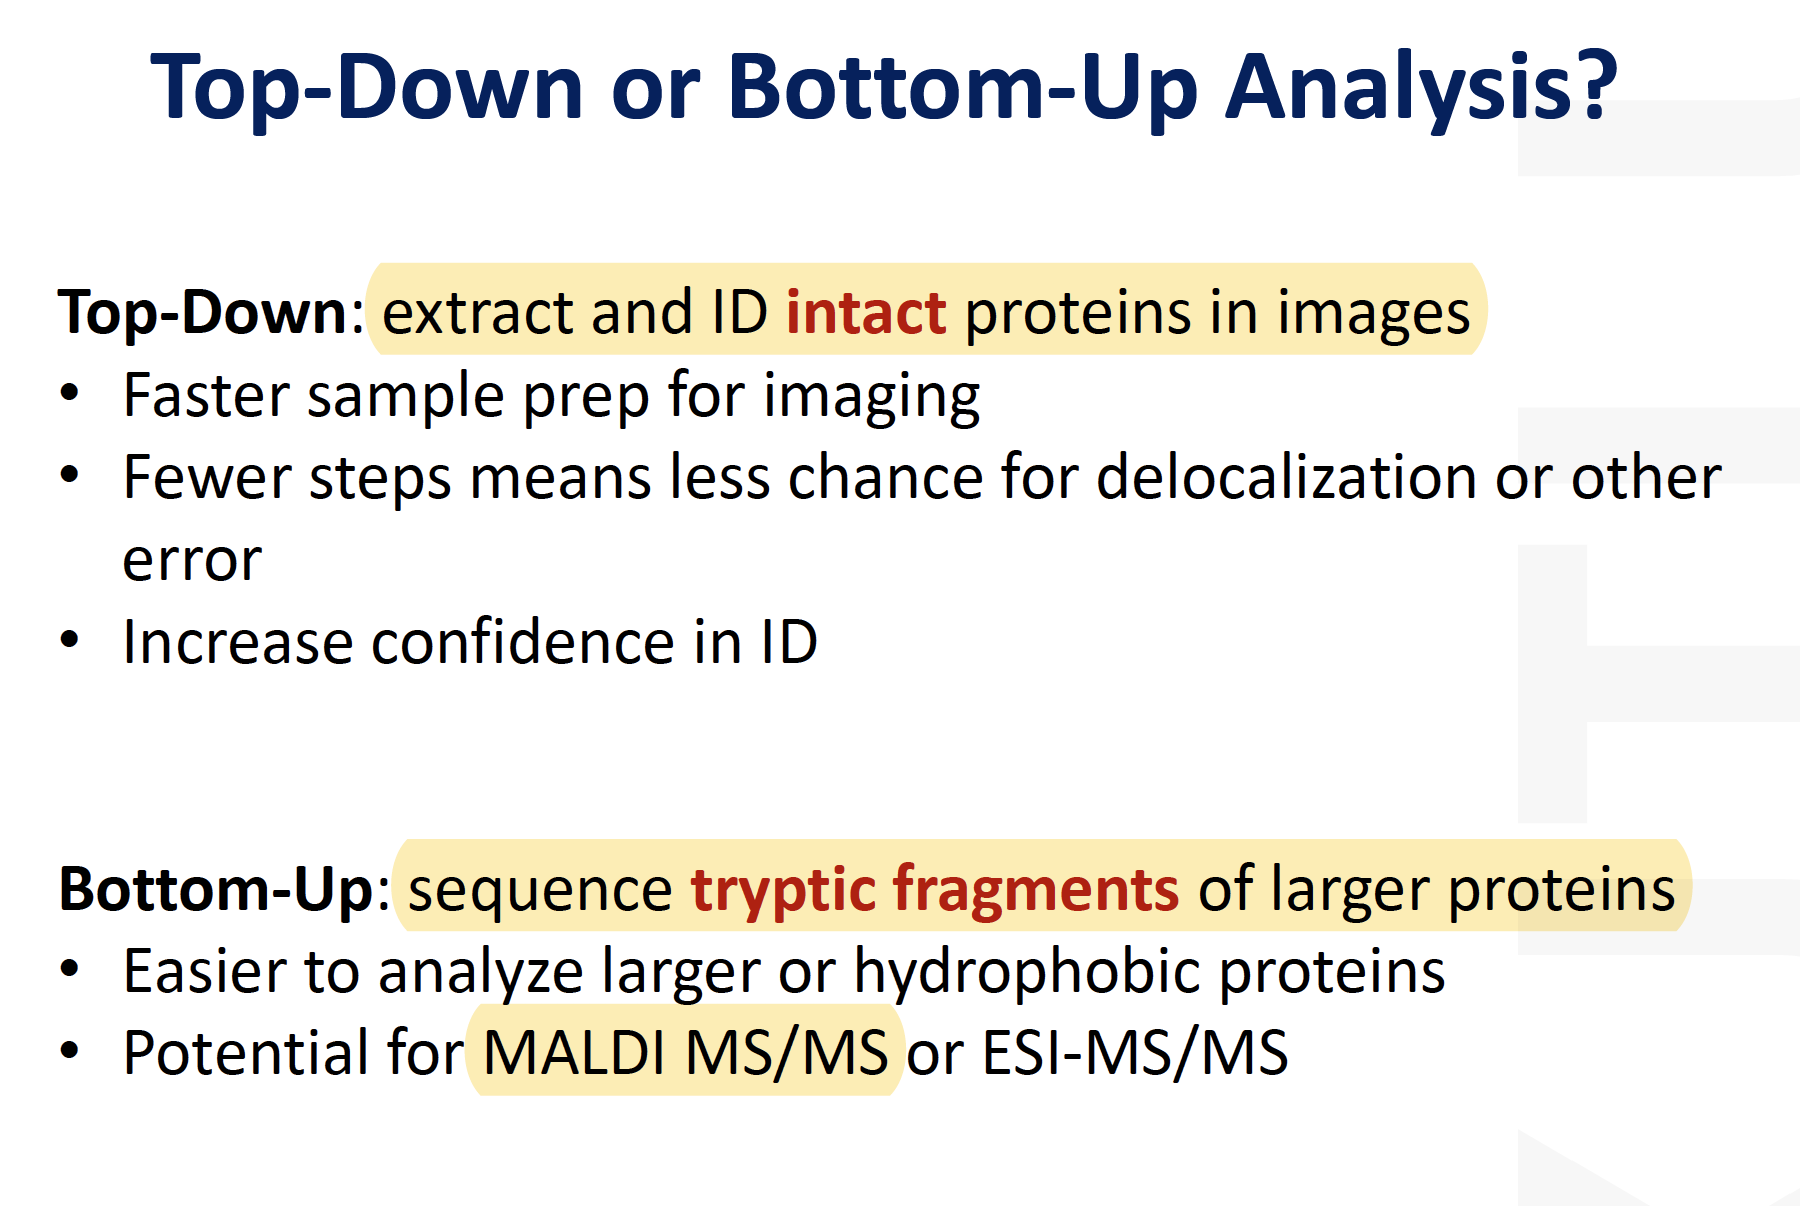
Top-down advantages
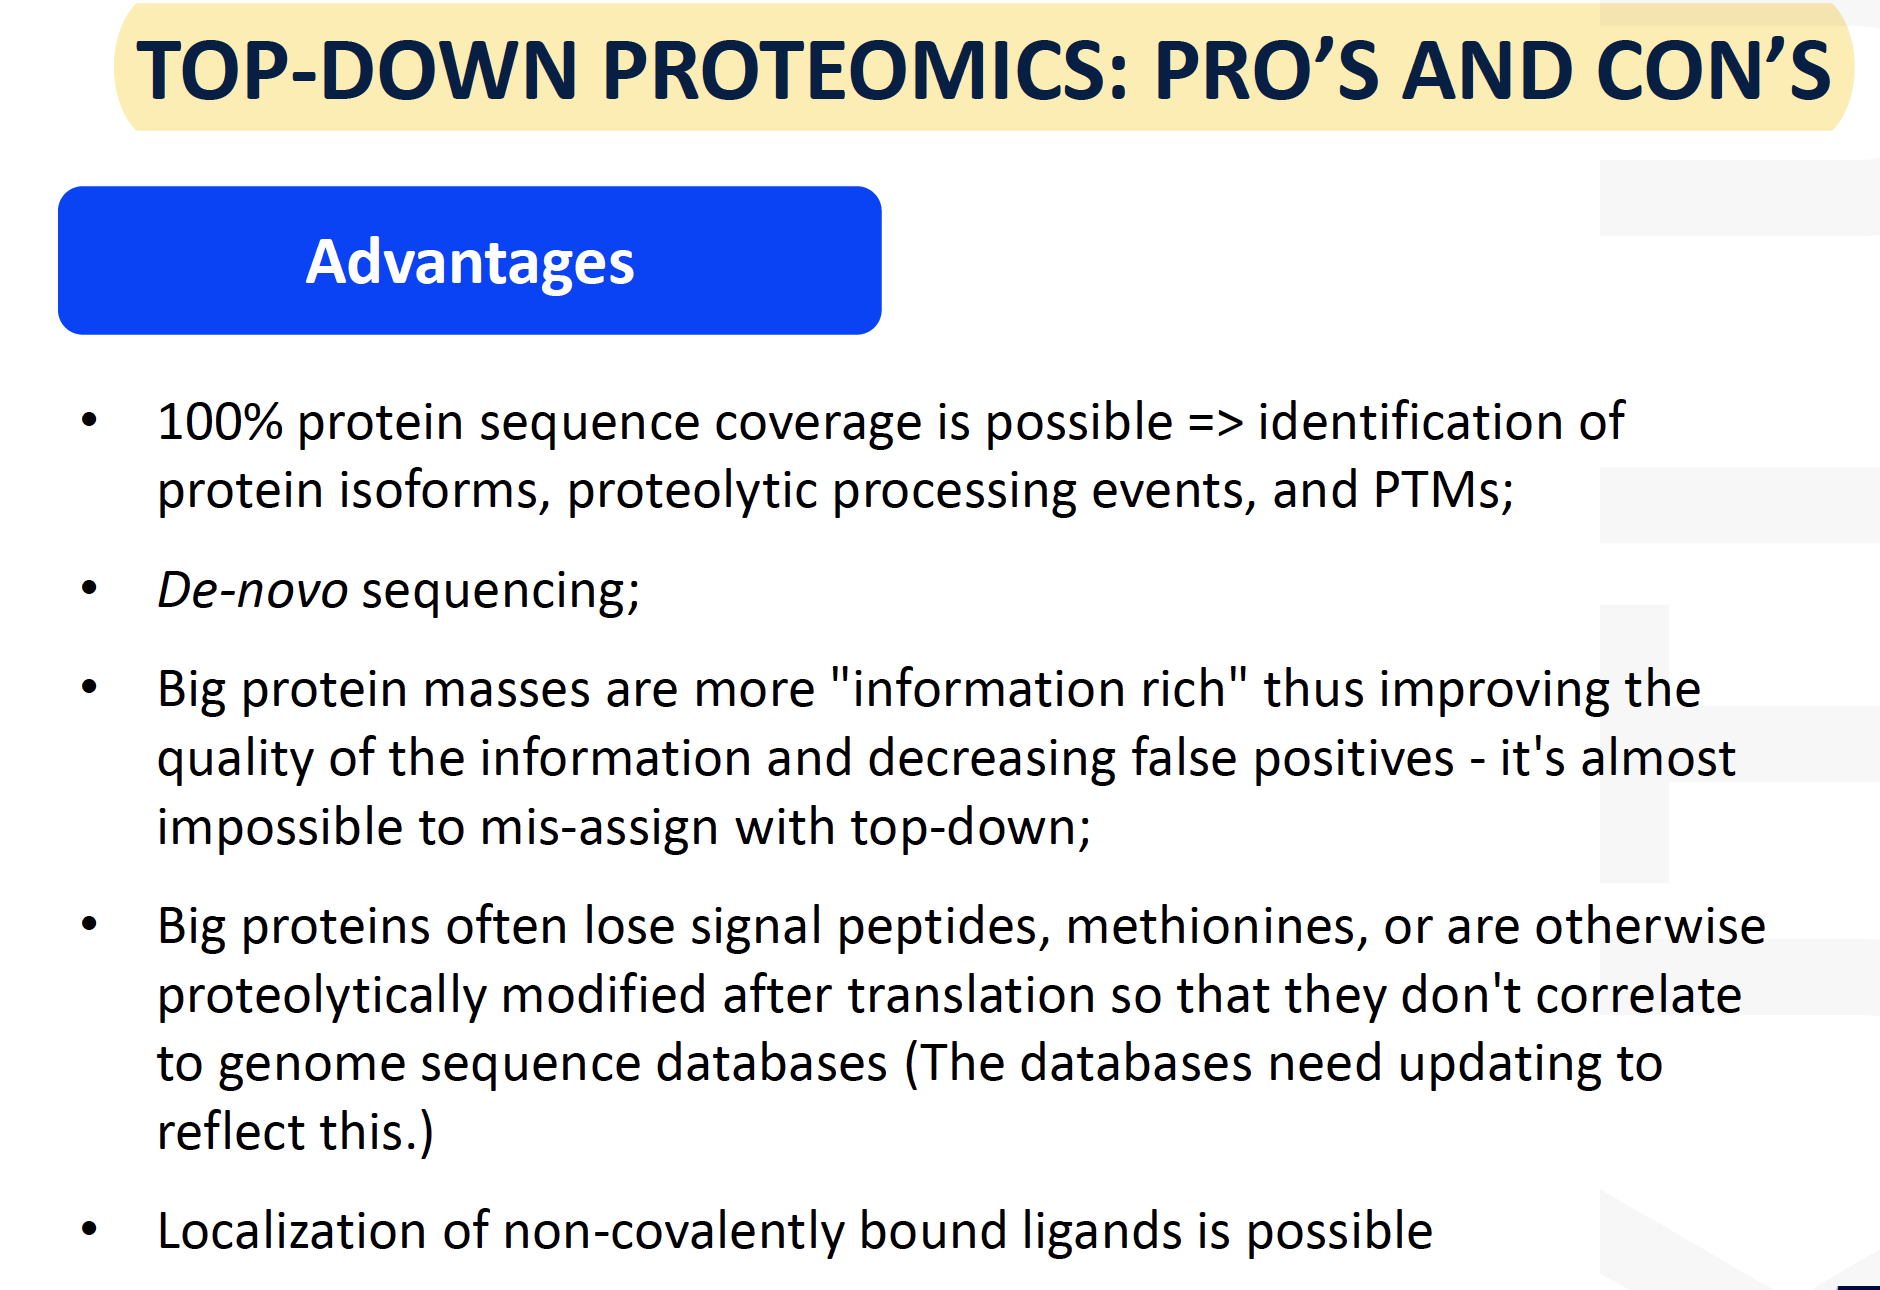
disadvantages for top-down
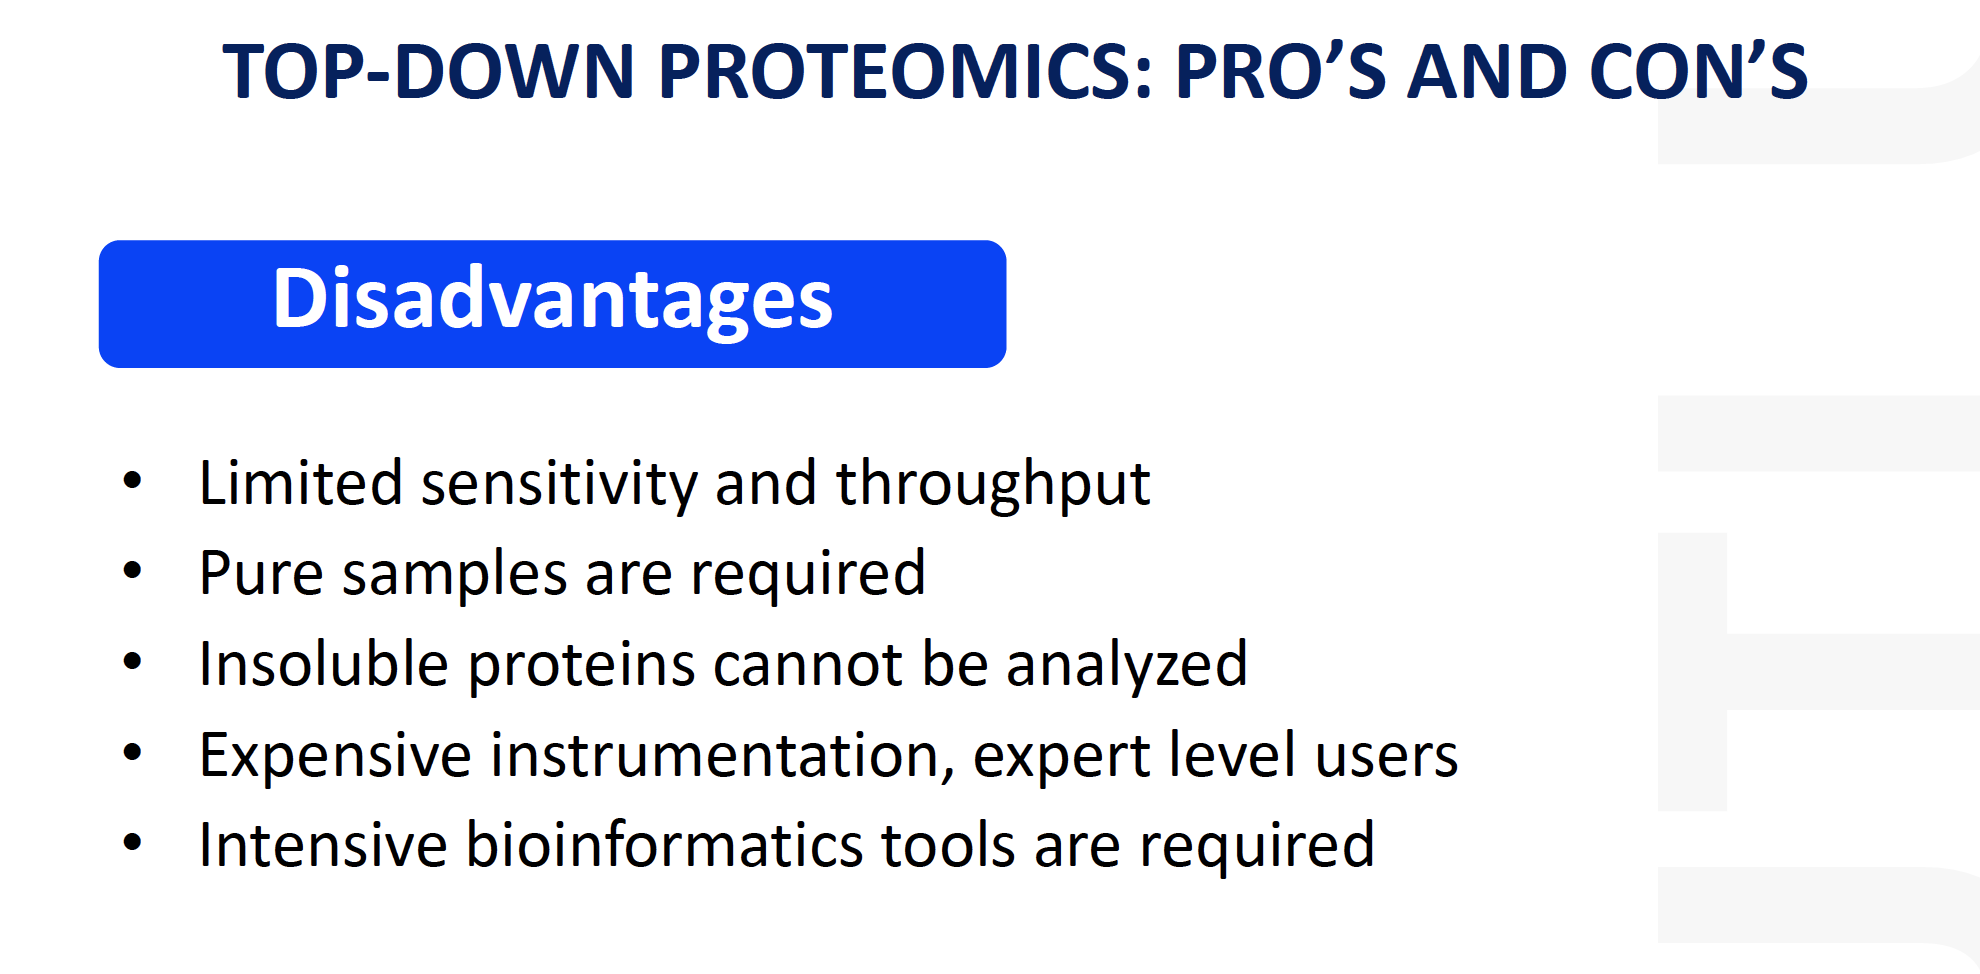
Quantitative Mass Spec-based Proteomics
Outline
Principles of quantitative proteomics
Gel vs. non-gel approaches
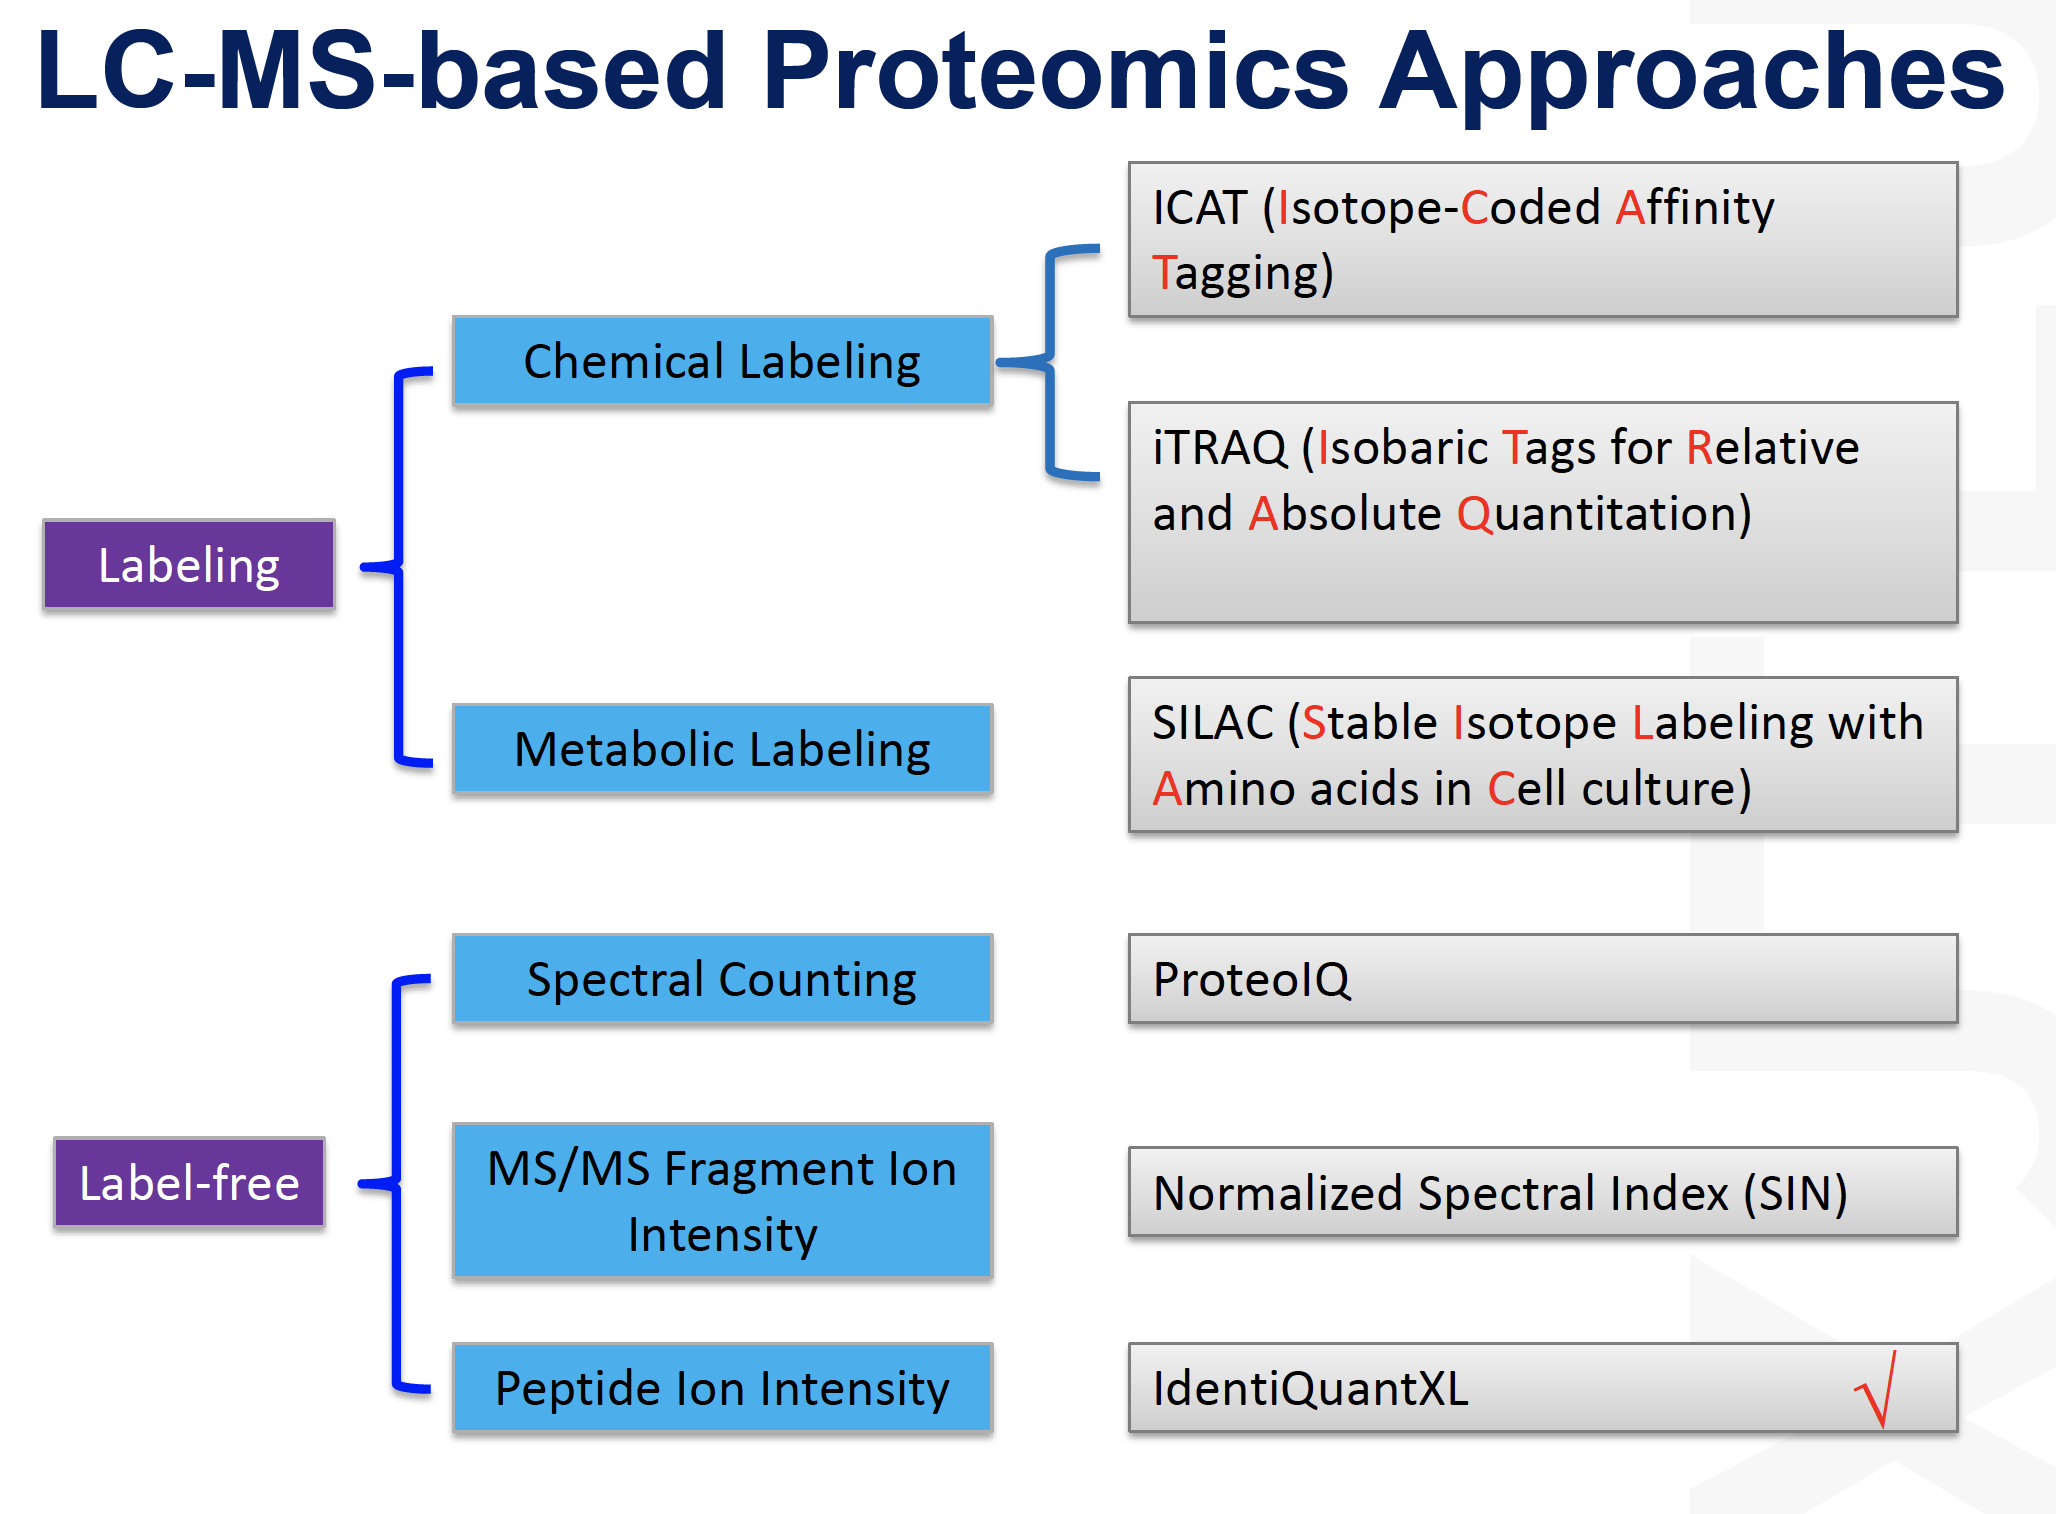
Labeling vs. non-labeling approaches
Case study: candidate biomarker generation using label-free approaches
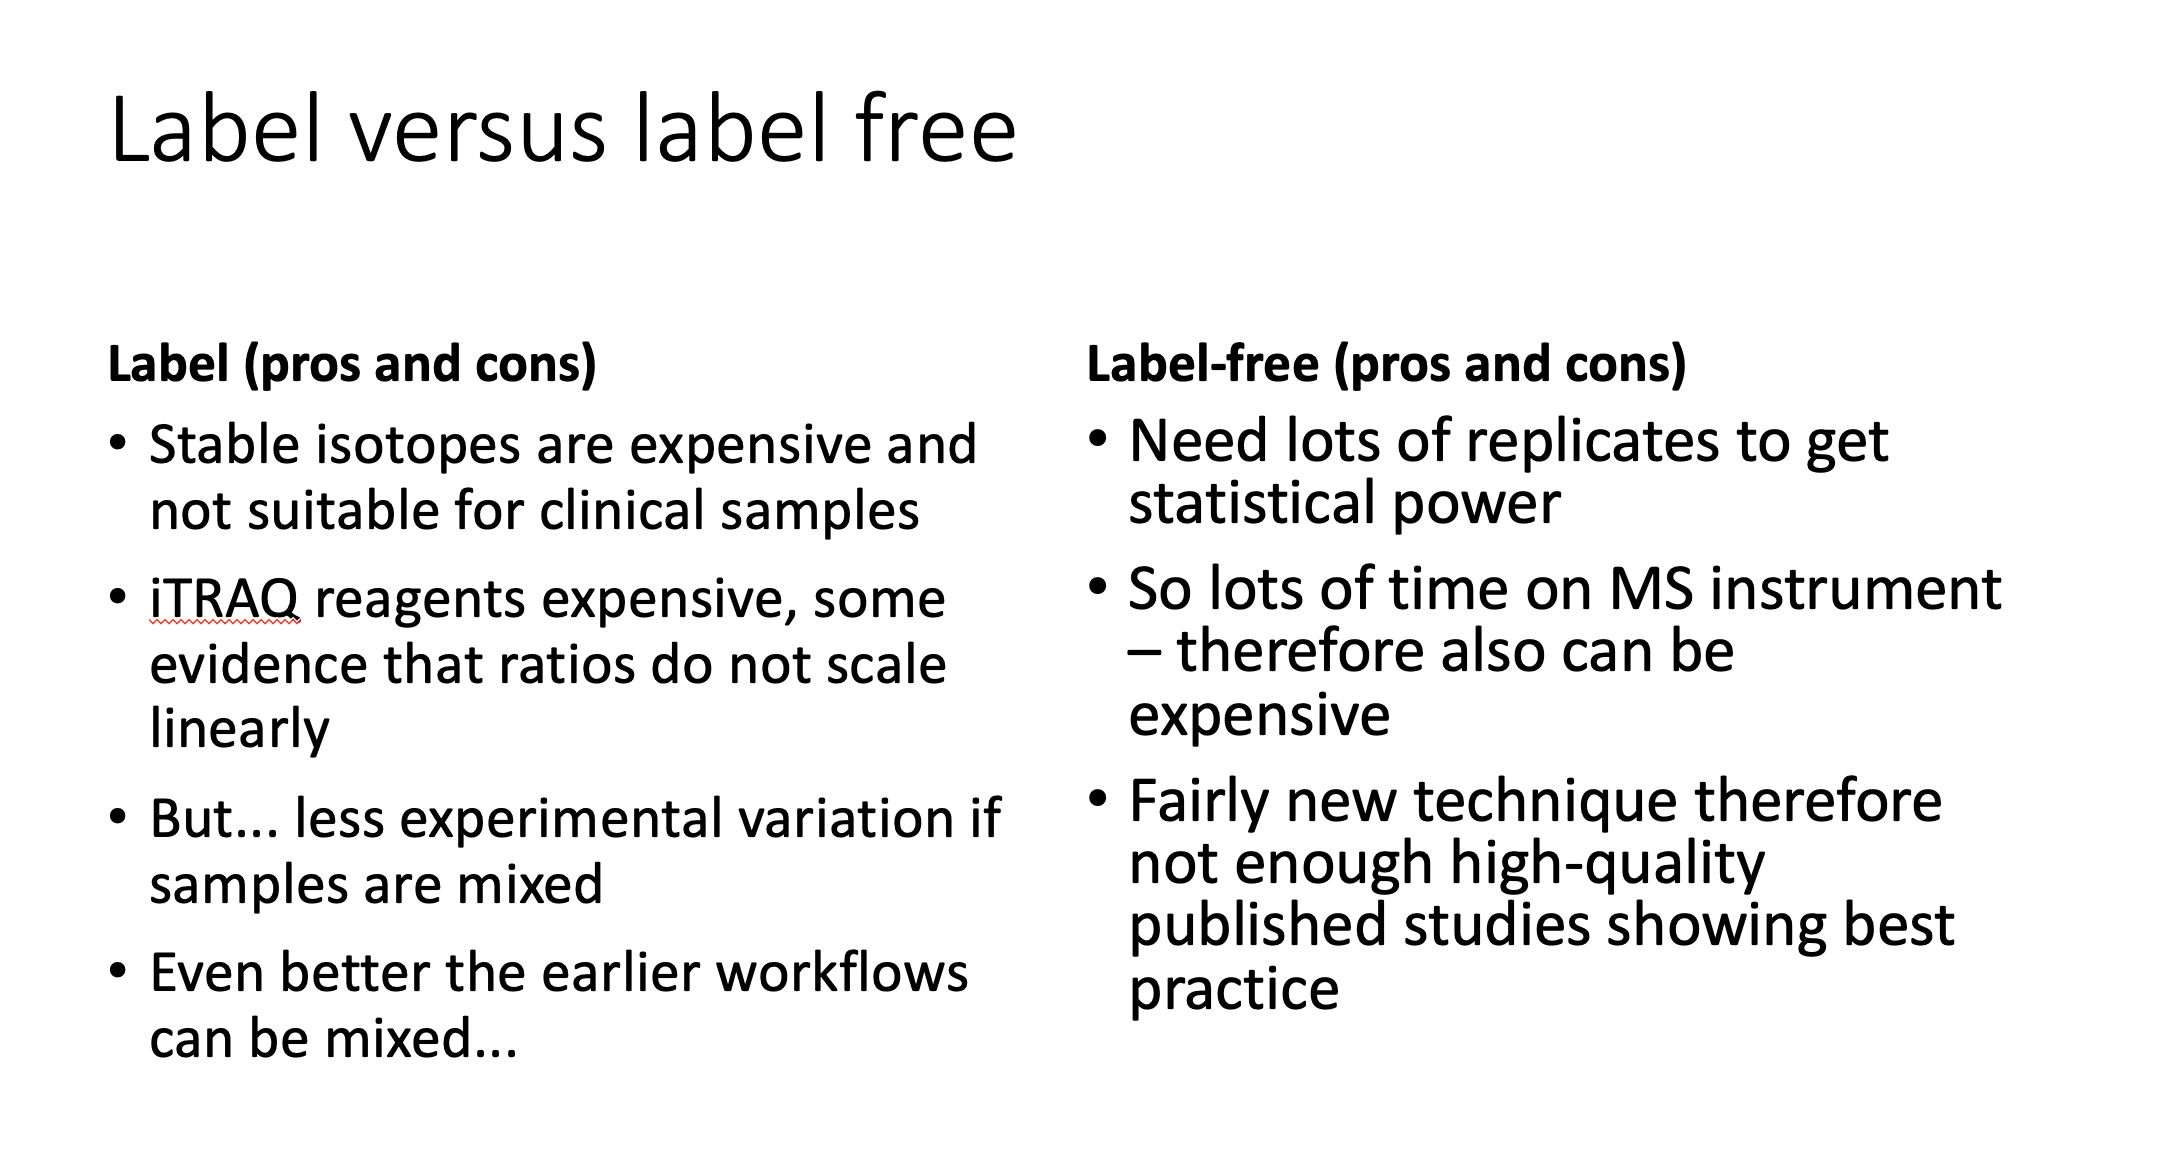
Summary of label methods
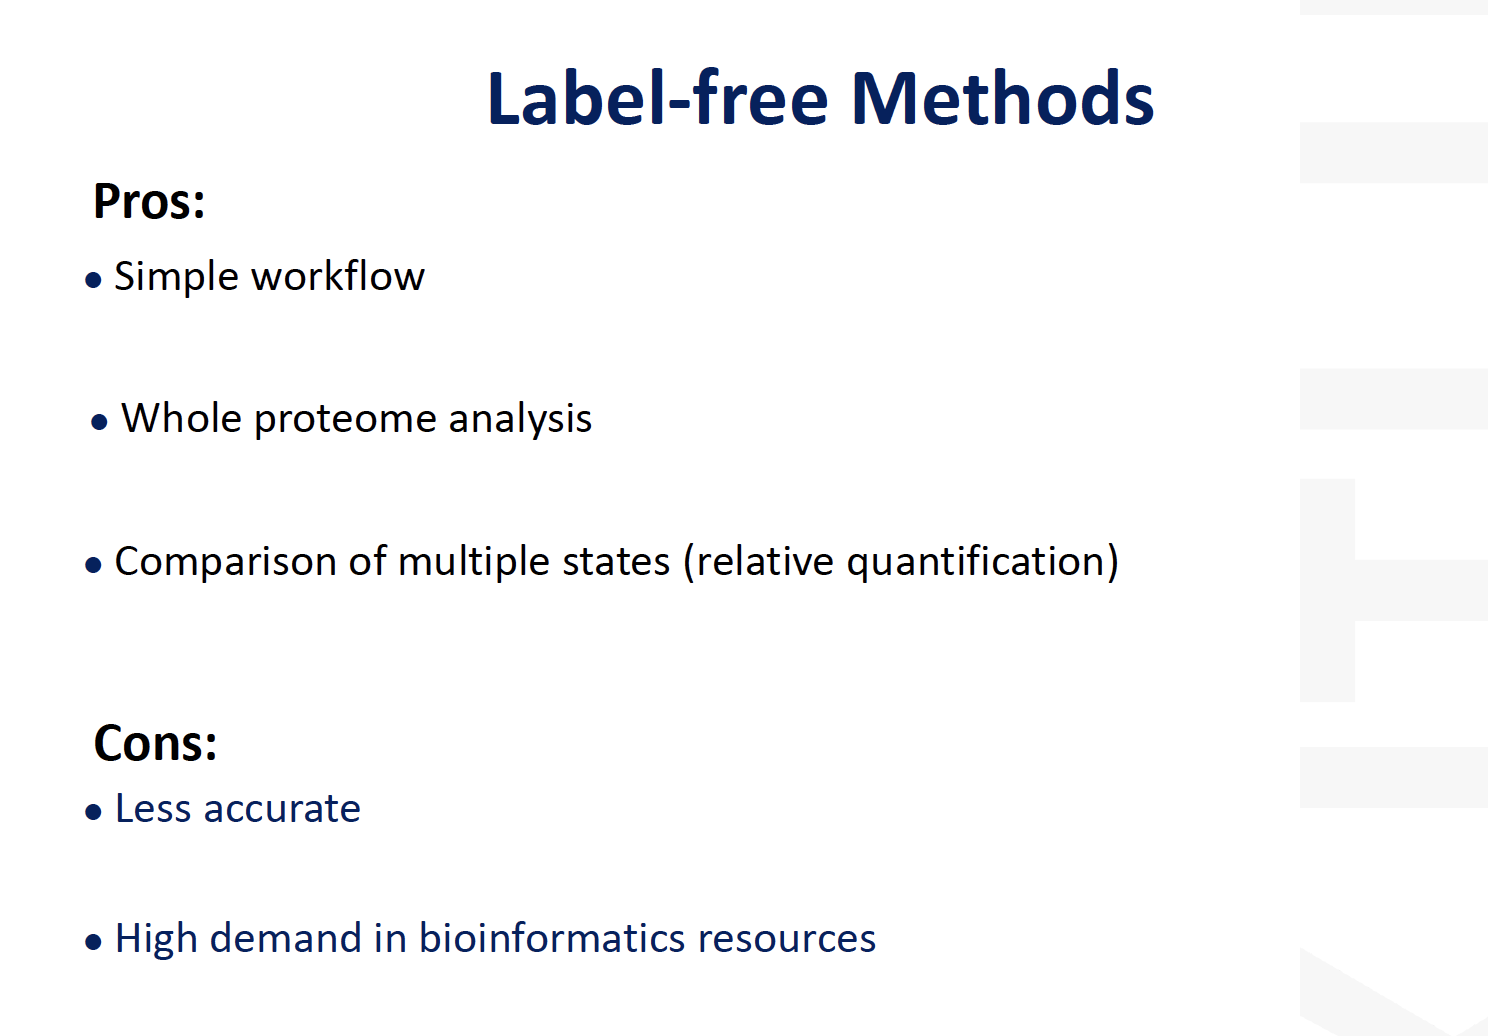
Pros and Cons for label-free methods
Methods
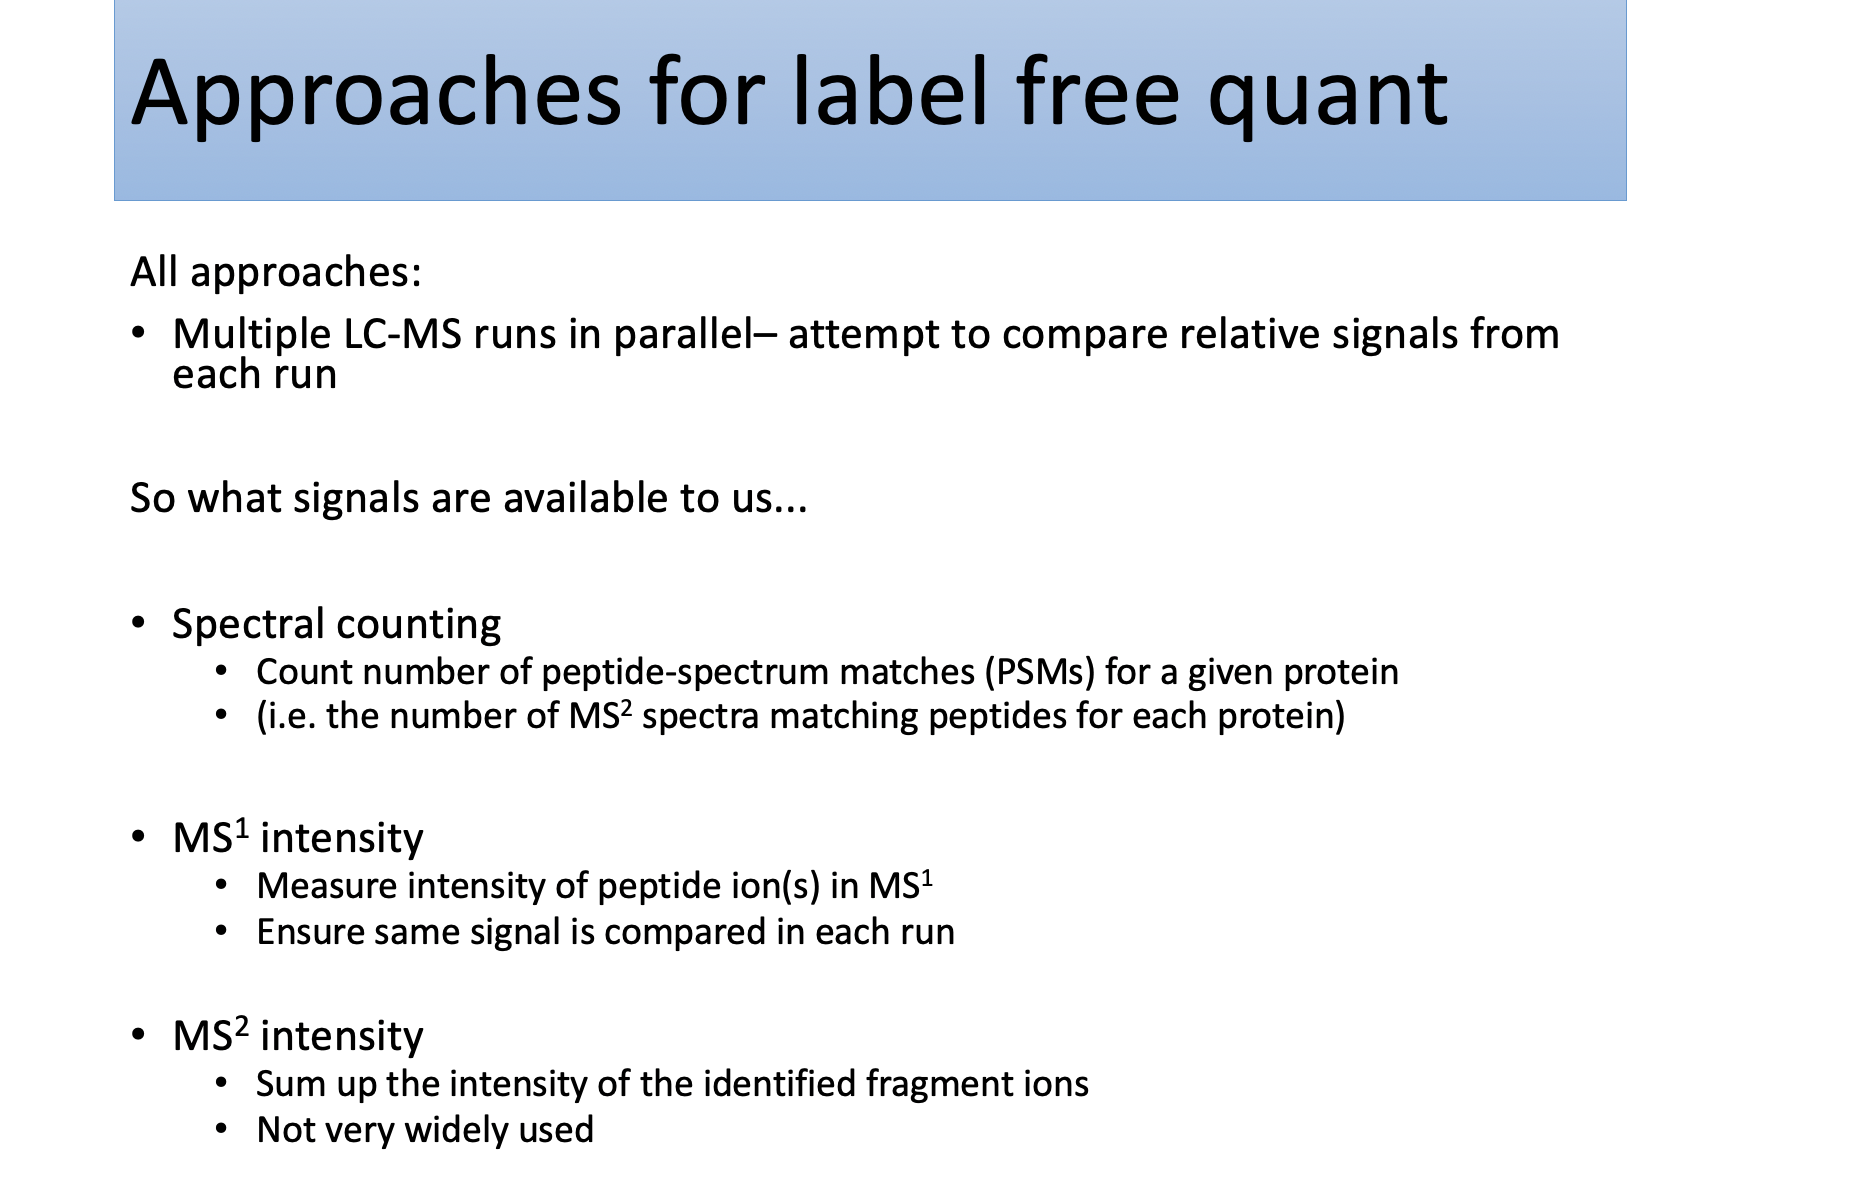
Spectral counting & Peak-intensity
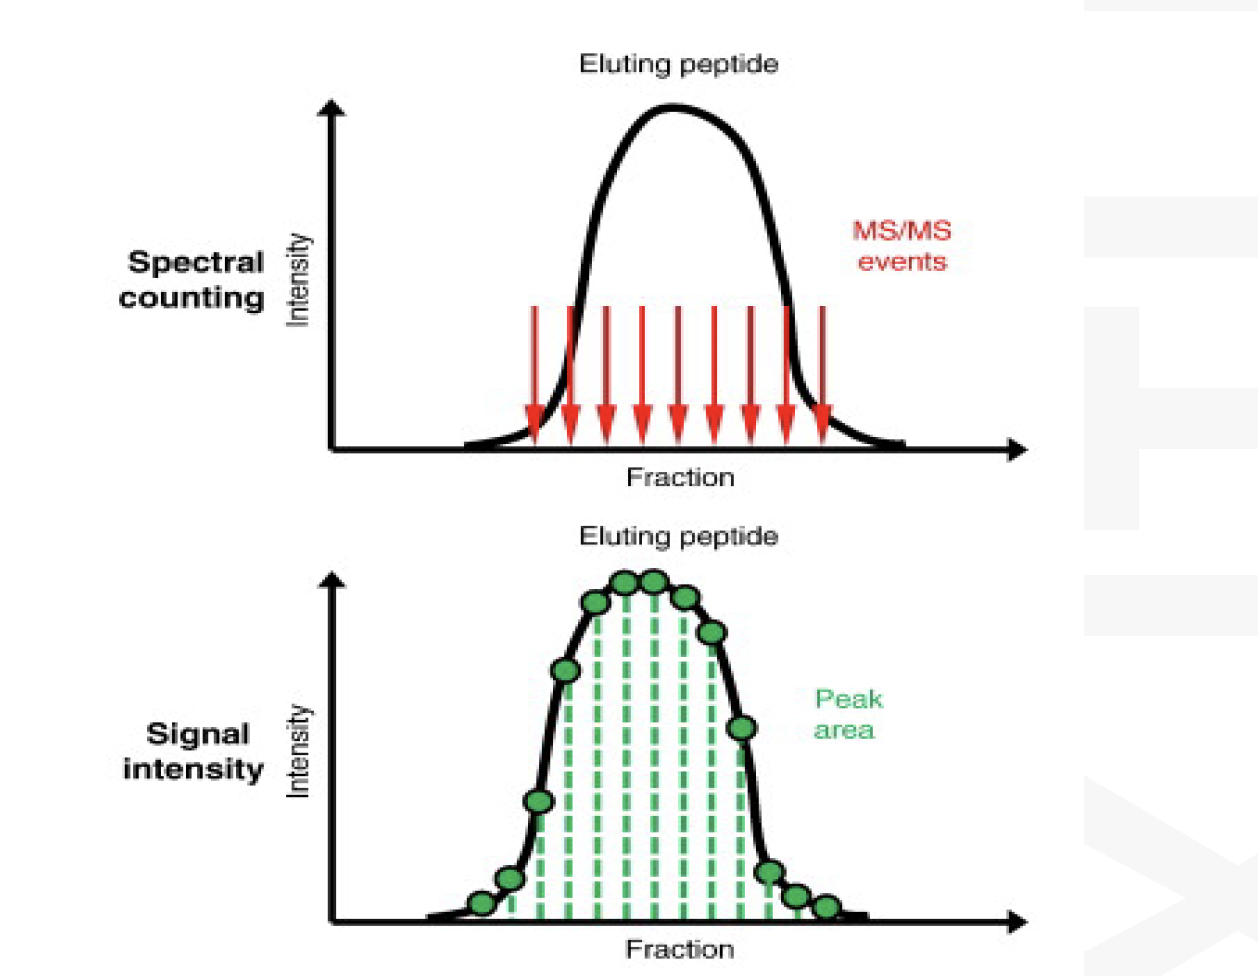
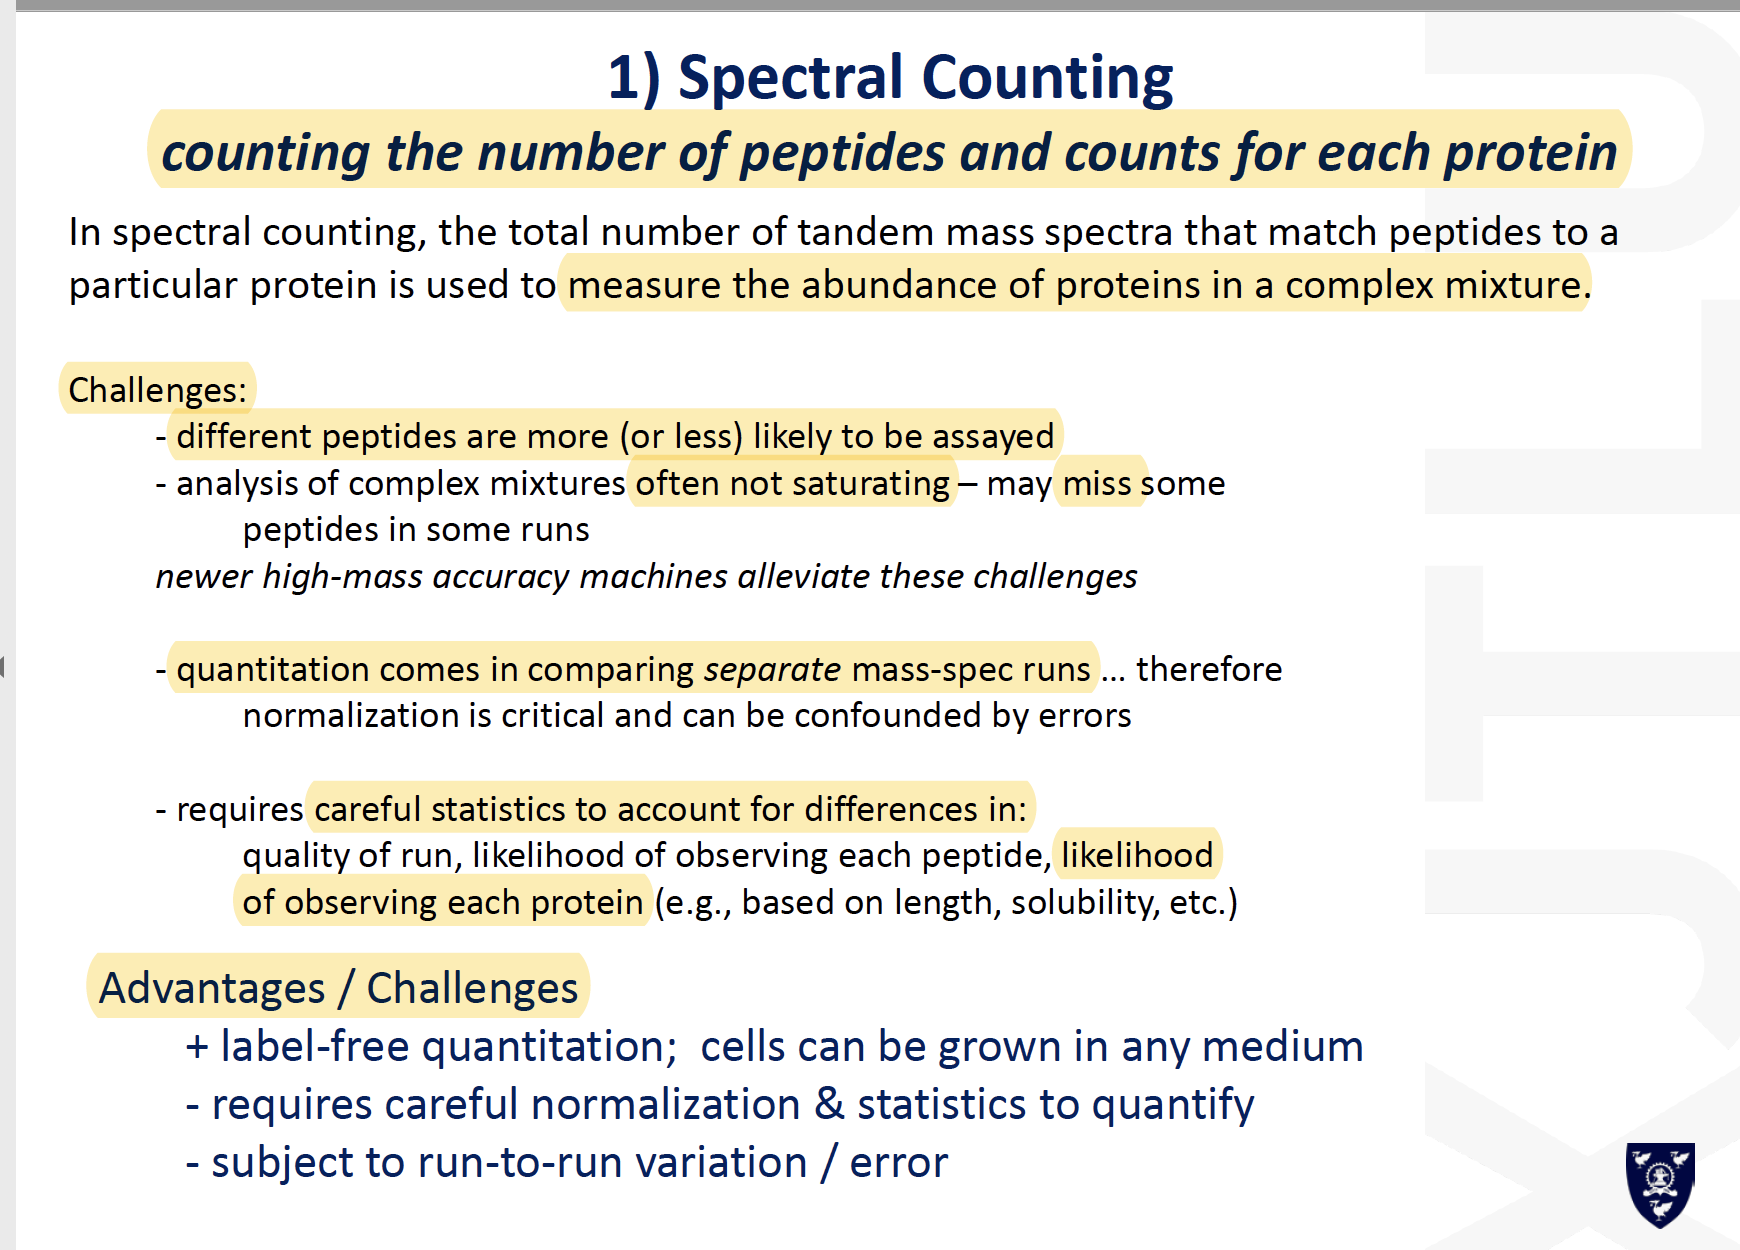
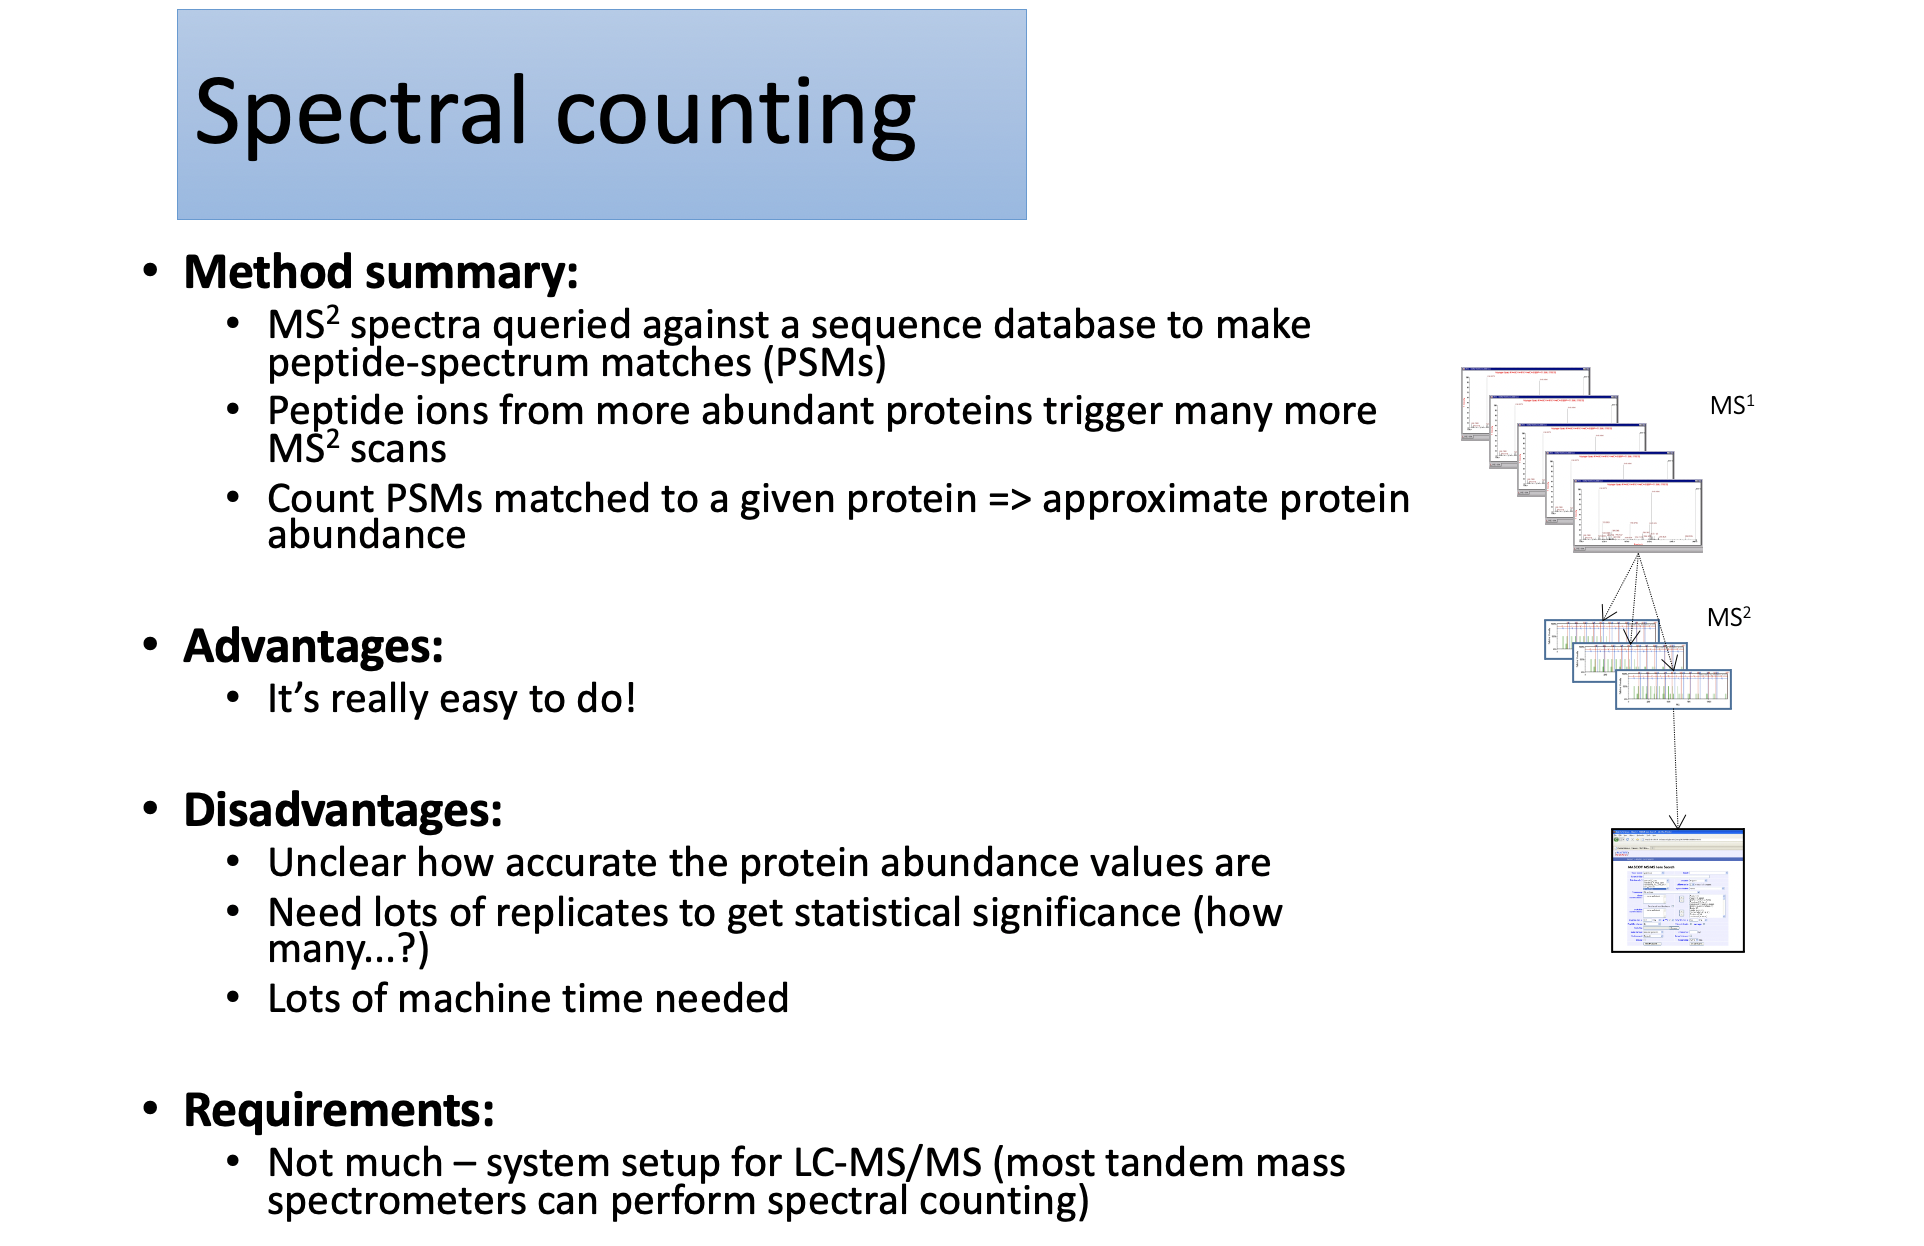
Spectral counting
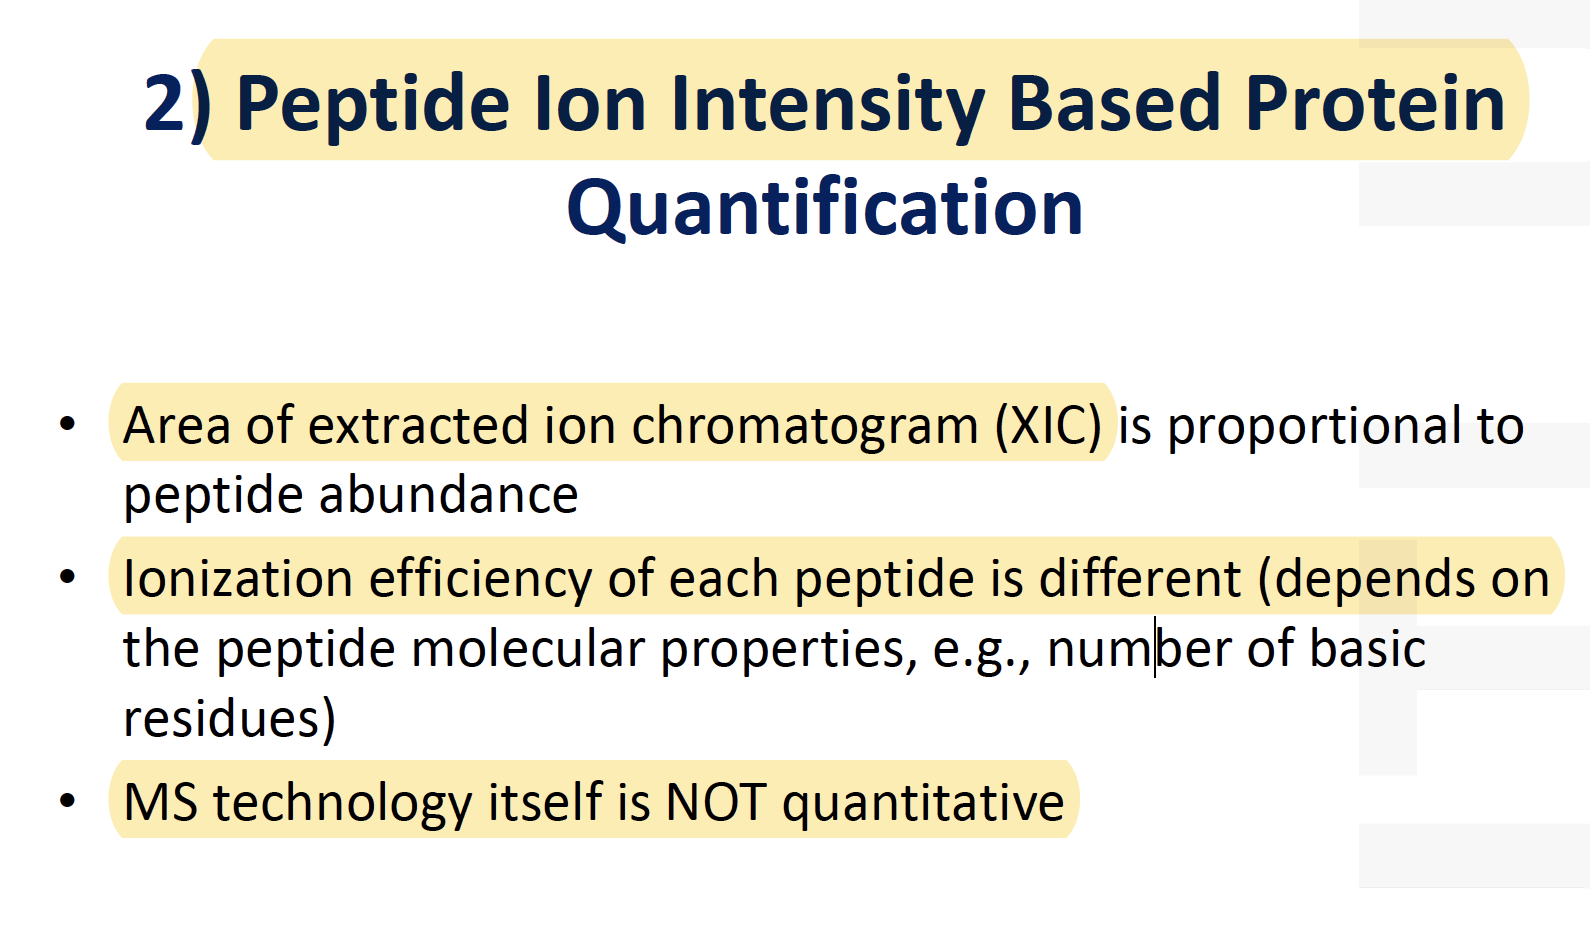
Peptide Ion Intensity Based Protein Quantification
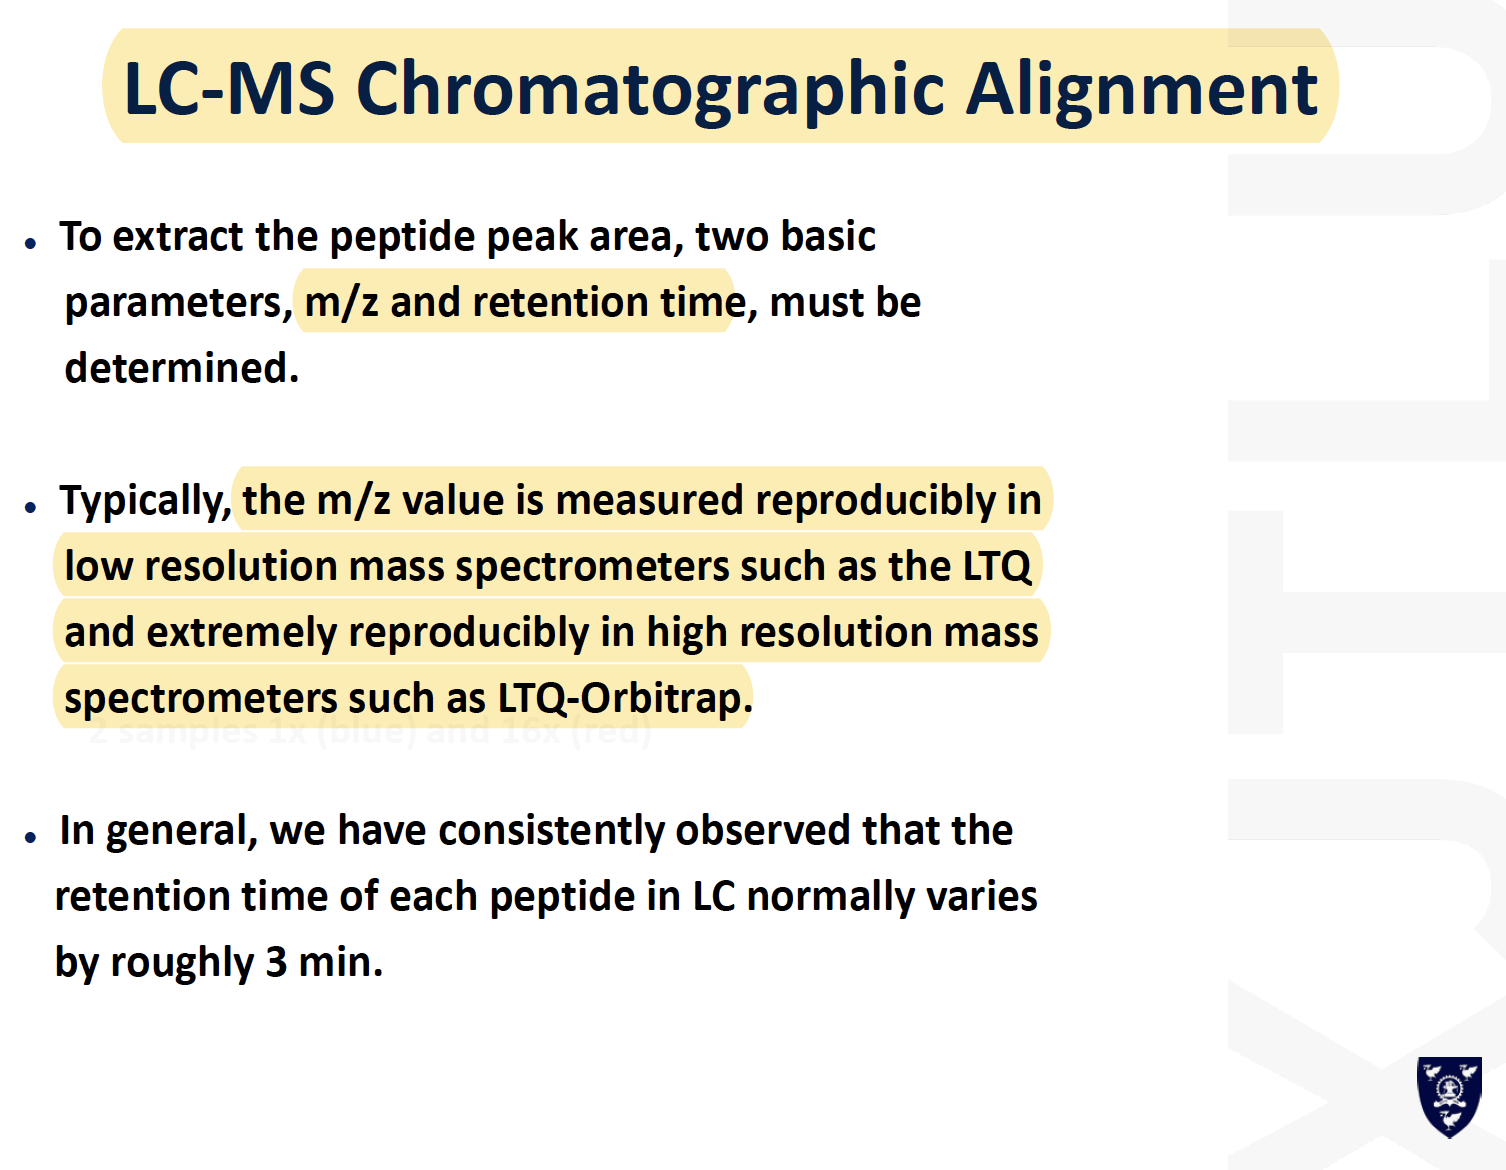
LC-MS Chromatographic Alignment
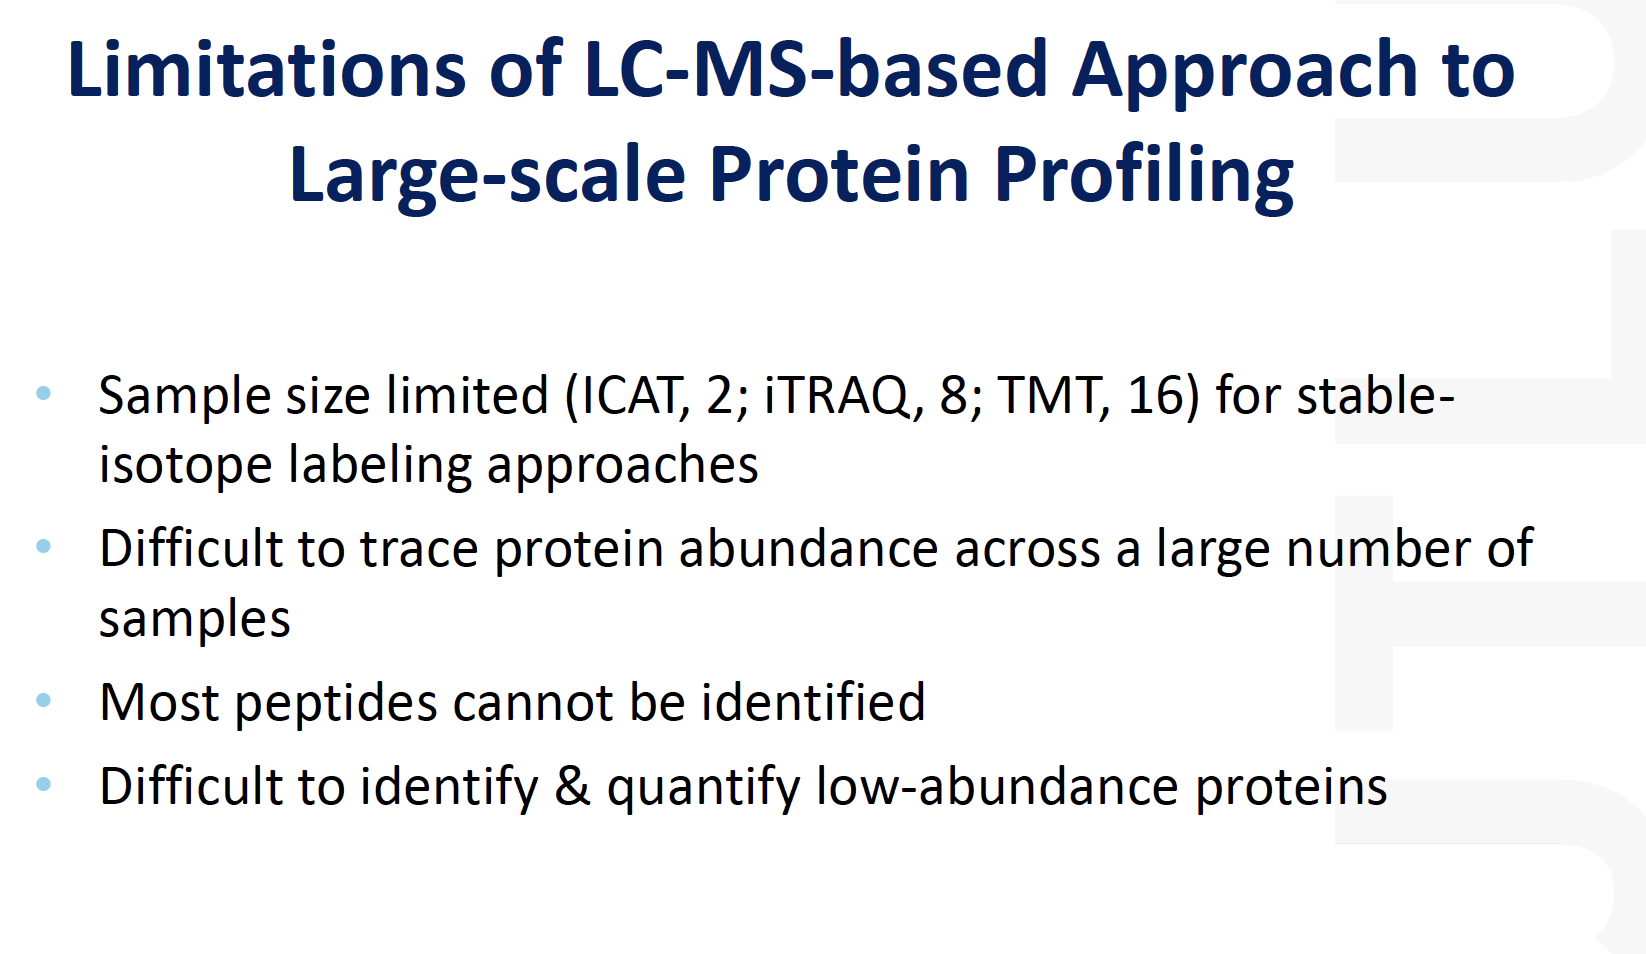
Limitations of LC-MS-based Approach to Large-scale Protein Profiling
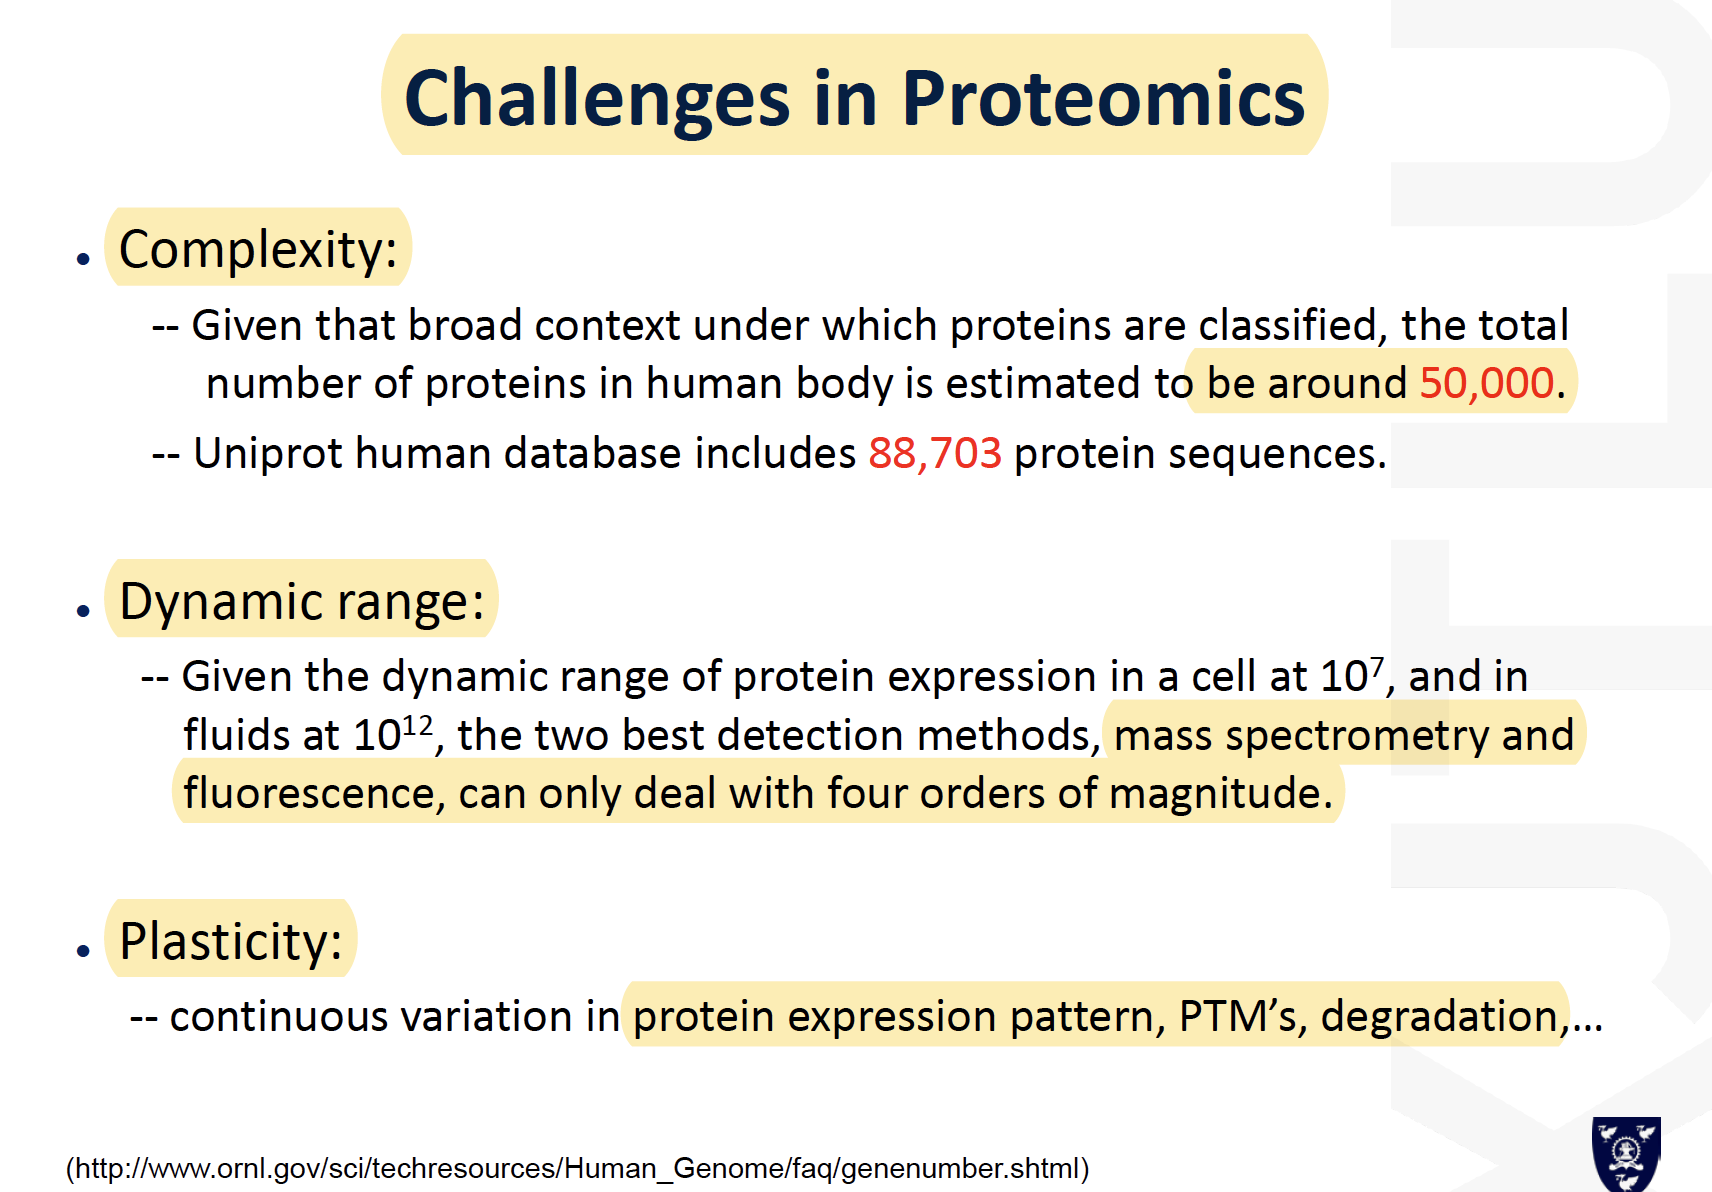
Challenges in proteomics
Tutorial 1
Proteomics workflow
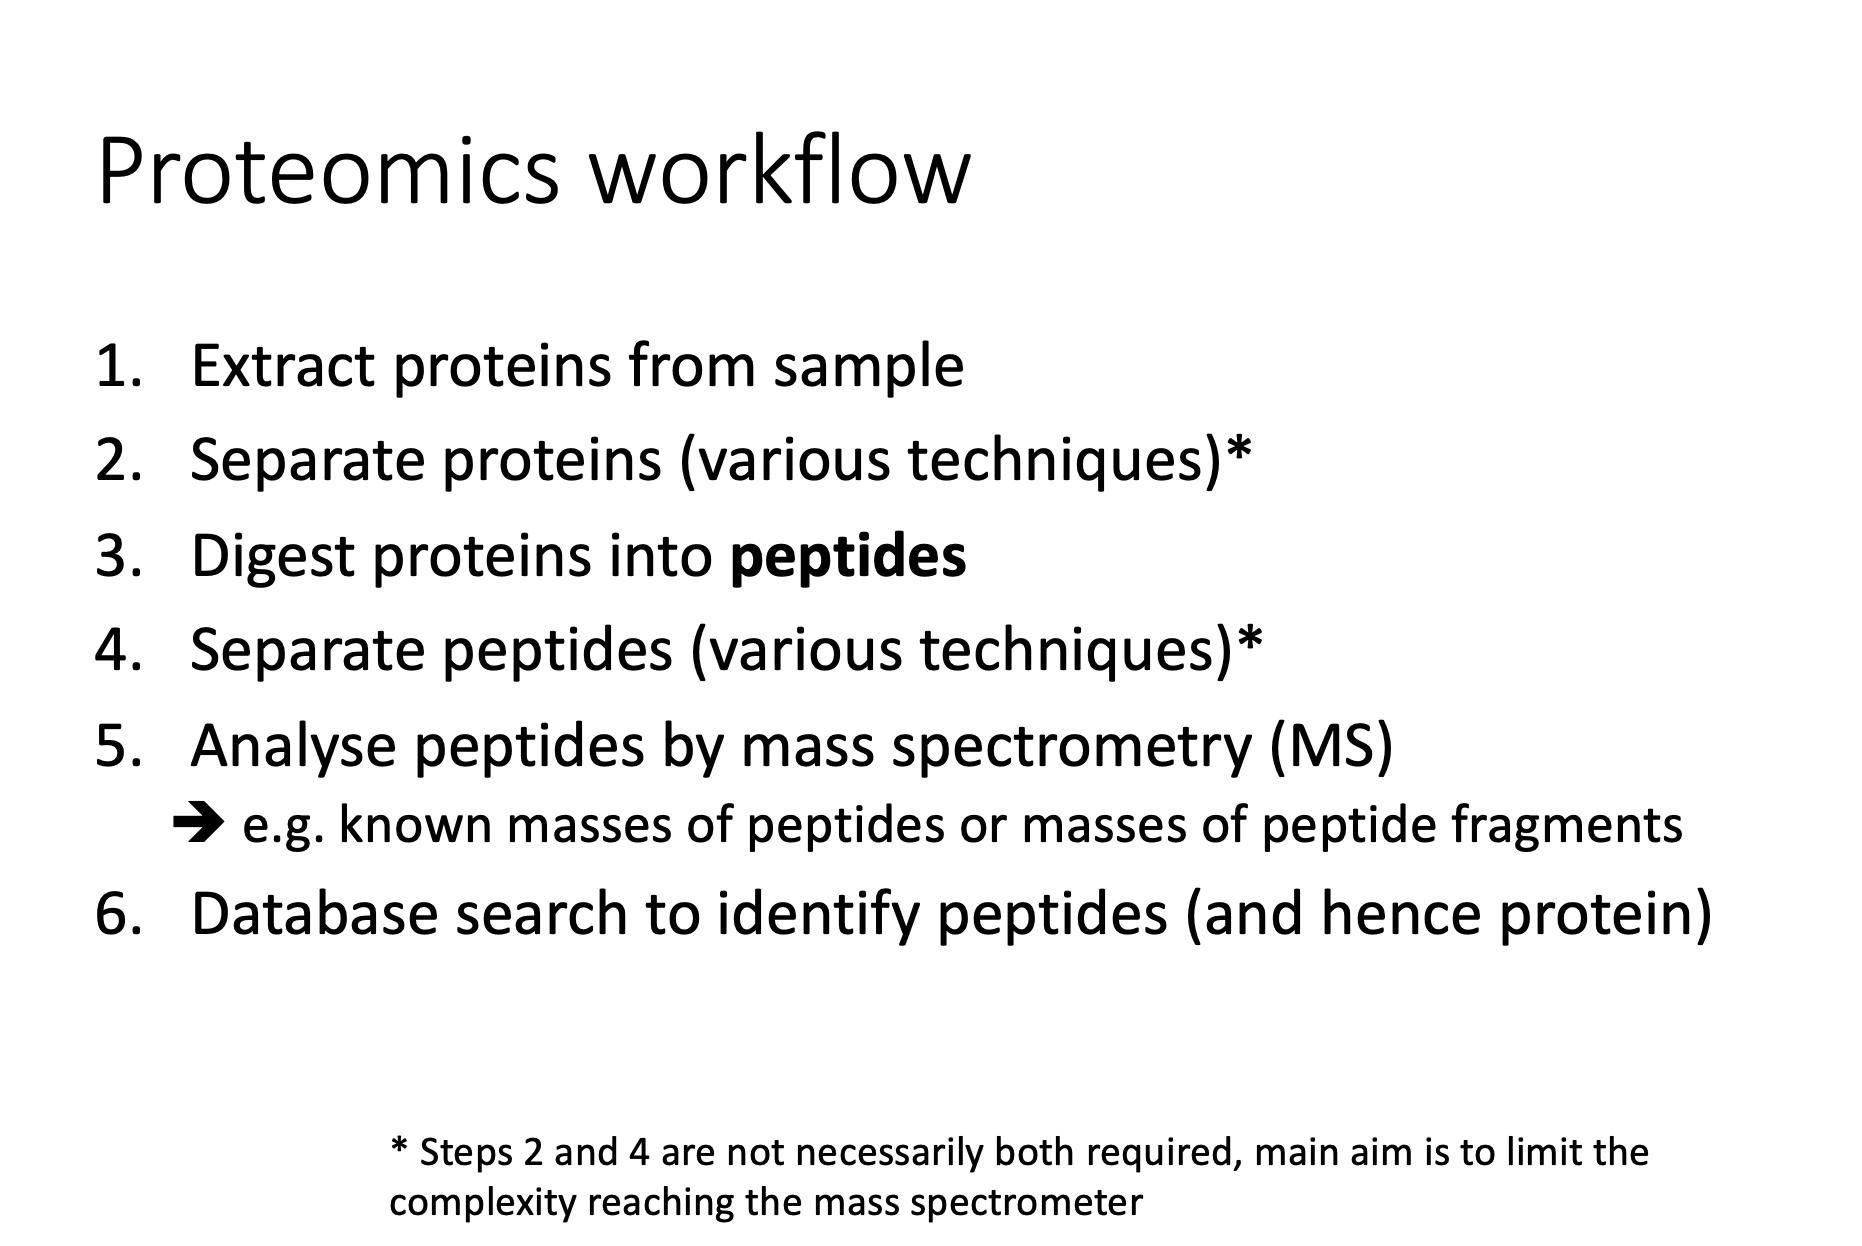
Separation technique
Mass spectrometry
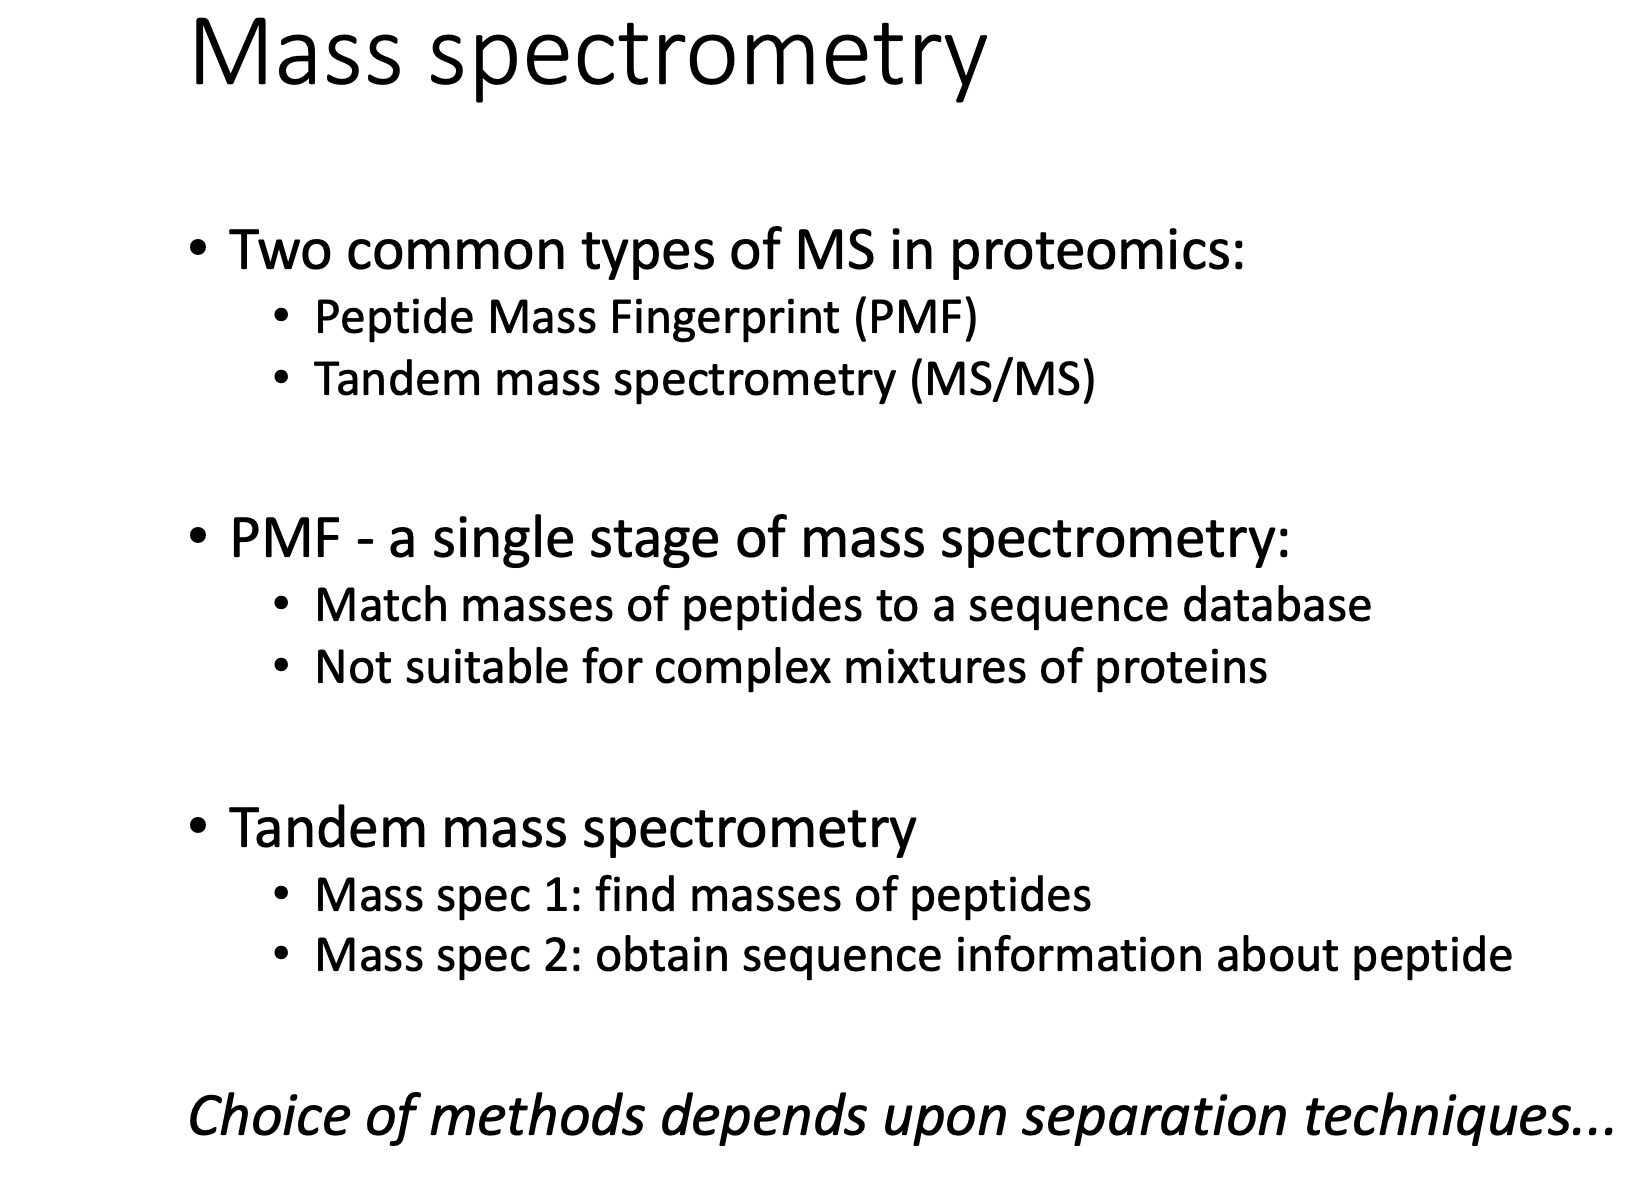
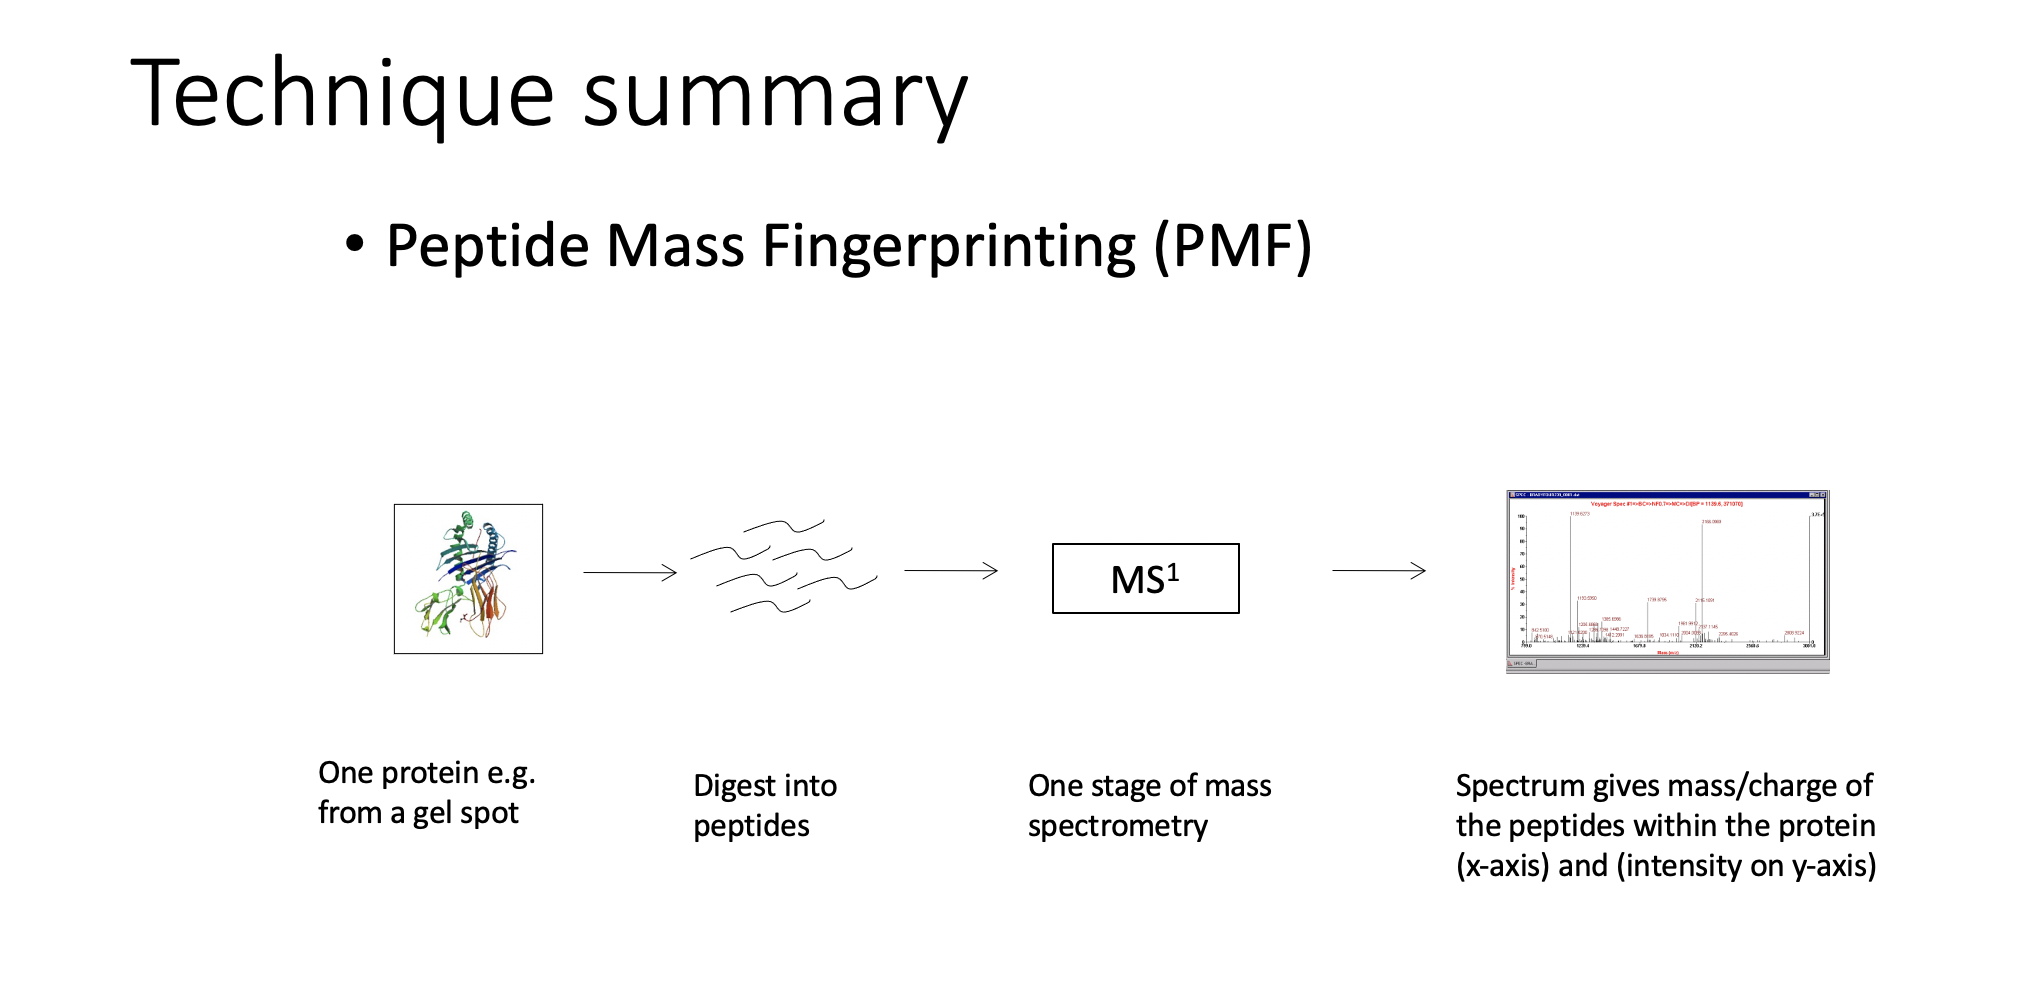
Technique summary
PMF
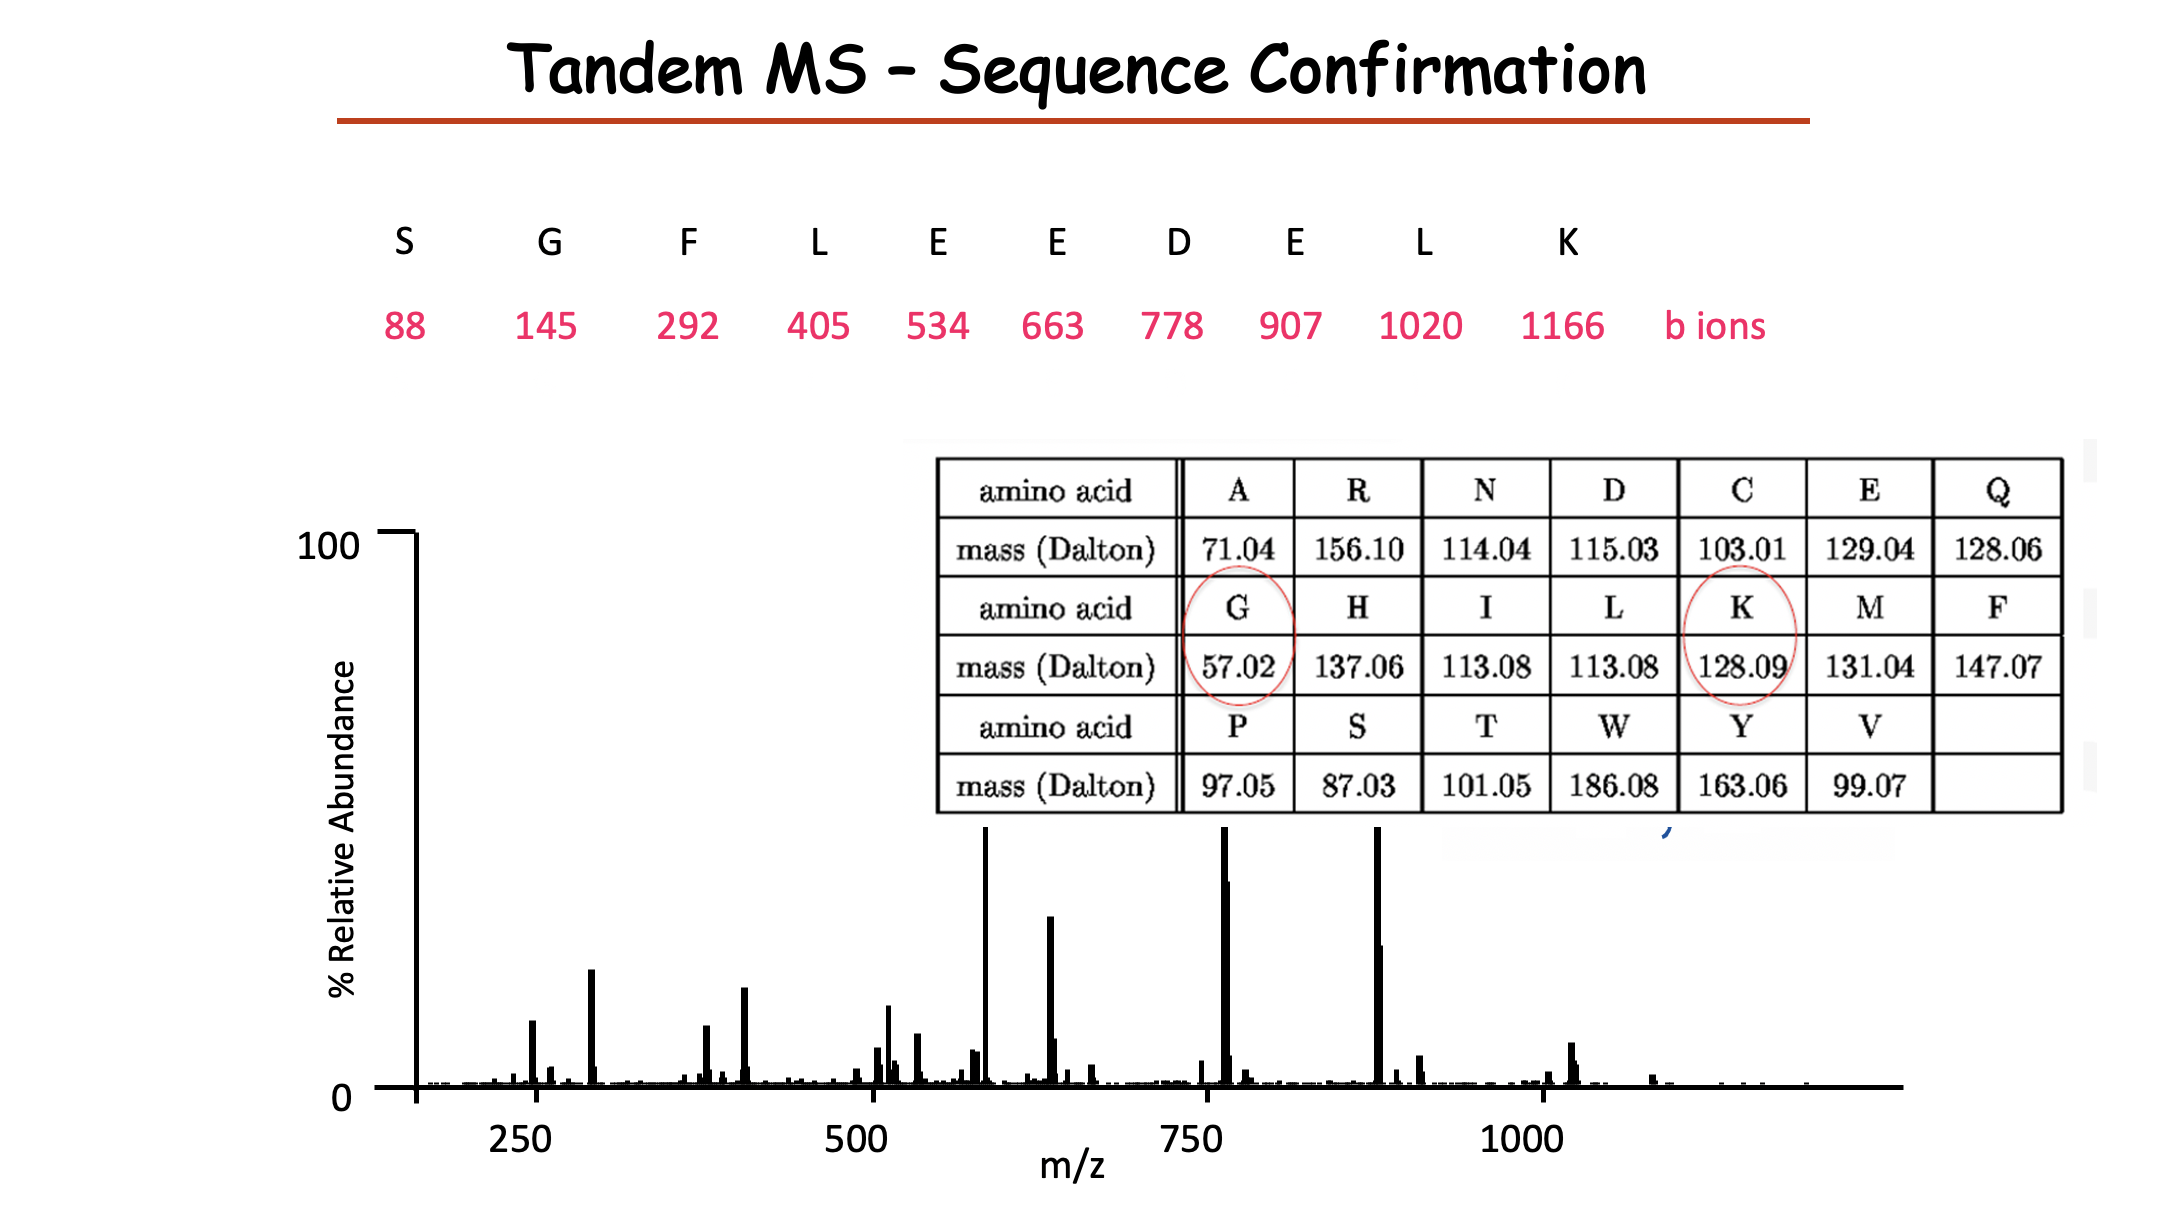
TMS
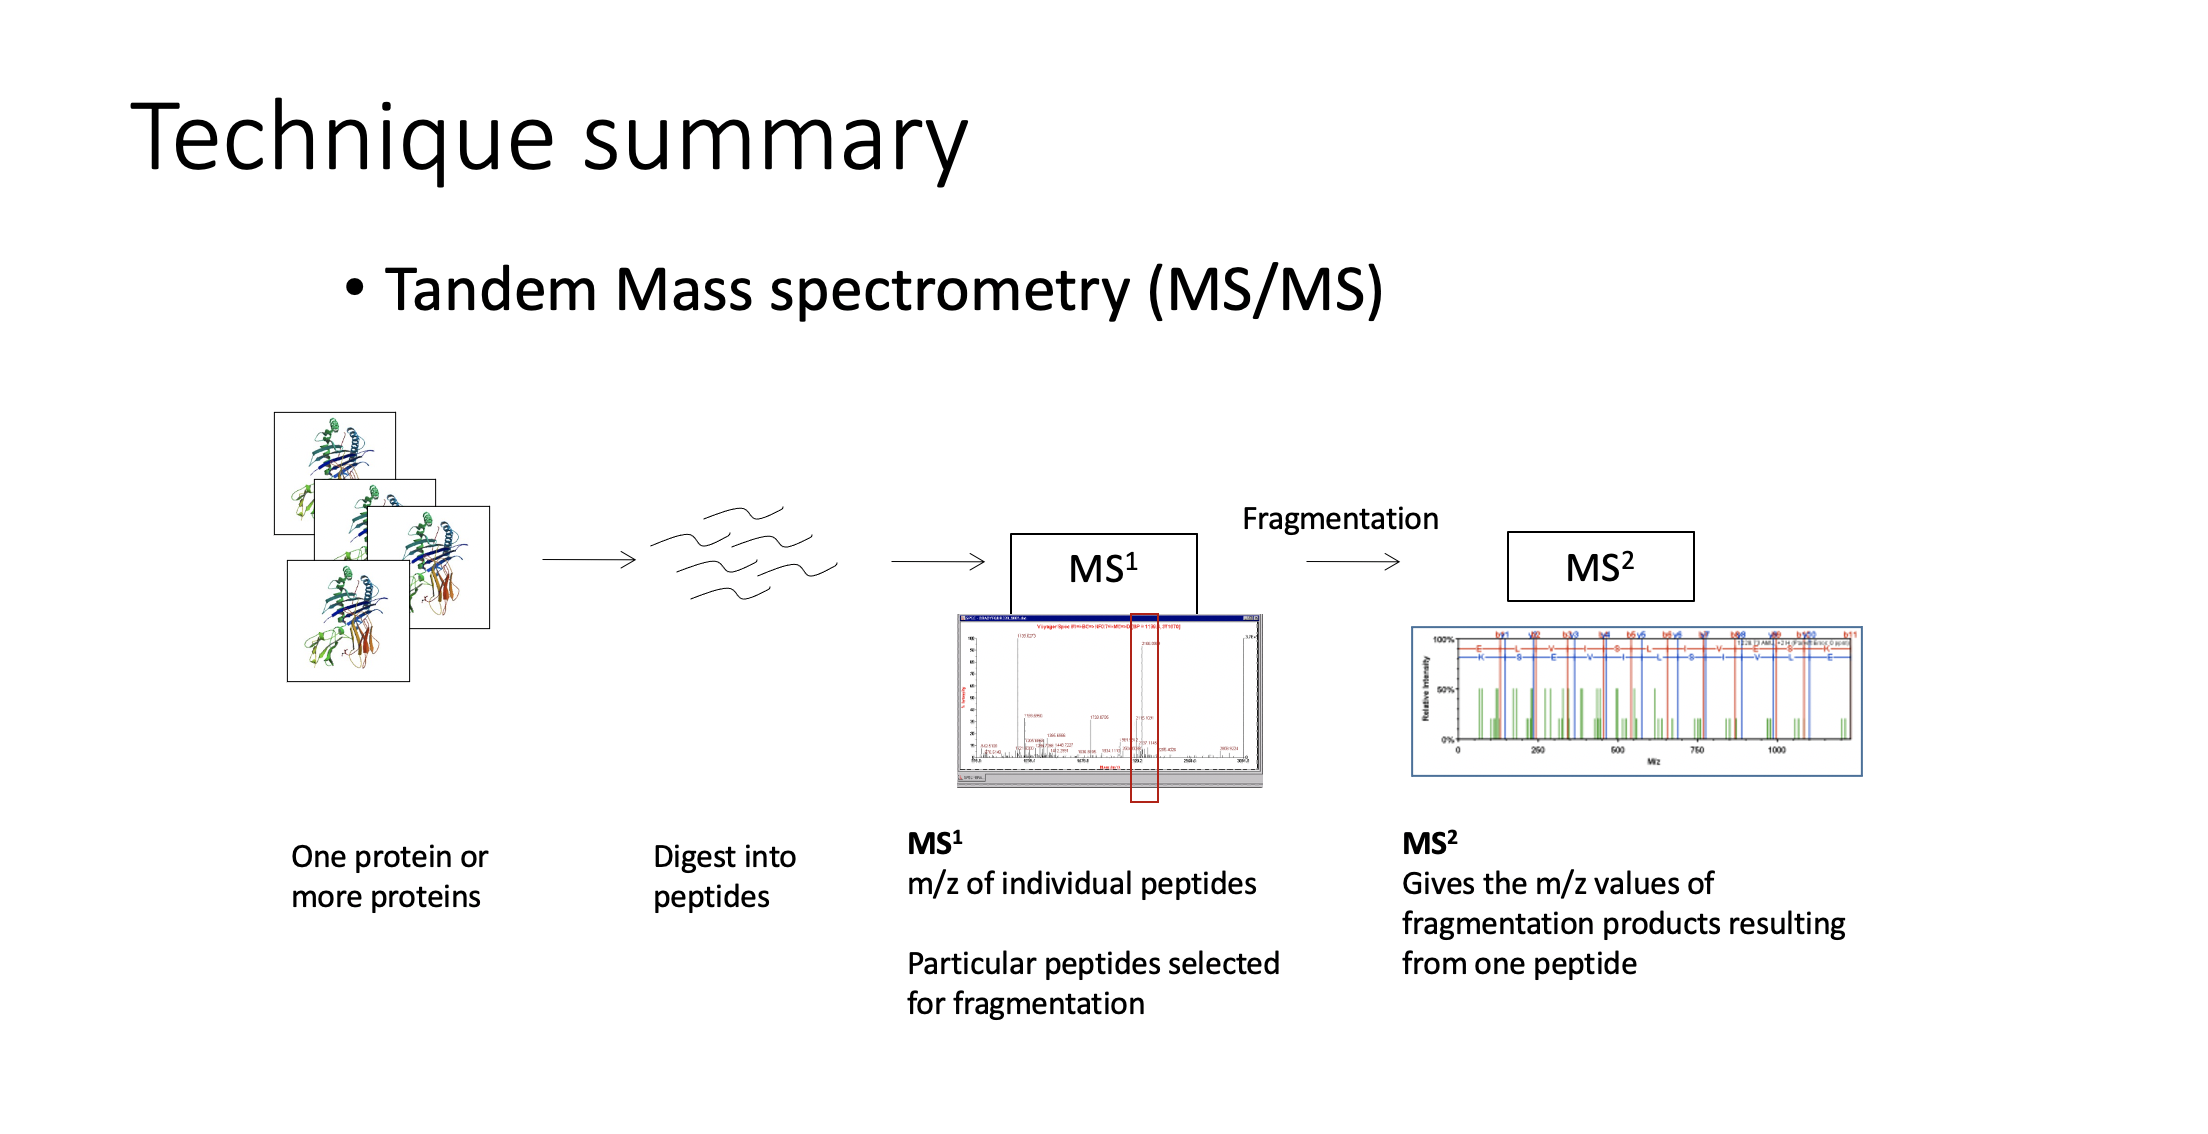
- 注意这儿是Tandem MS sequence confirmation
The principle of SDS-PAGE
Western plot
Tutorial 2
Labeling vs non-labeling
comparison between label & label free
Label free approaches
pros and cons of label free protein
Pros:
- Technically
simple- No complicated (or expensive) labelling or tagging protocol
- Can
avoid complex pre-separation- direct LC-MS is okay
- Technically
Cons:
- Still can be
expensive- Need plenty of replicates to get statistical power (machine time!)
- Need good data analysis software
- Not straightforward to validate results from big data sets
Low abundance proteinshard to measure accurately
- Still can be
Why does MS1 intensity not tell us peptide abundance directly?
- Peptide sequences
ionise to different extents- based on the biophysical properties of a given sequence
- Thus, measured ion intensity
only weakly correlates to the abundanceof the peptide (and hence) protein in the proteome Not simple to extract the total ion abundancefor a given peptide in different runsDifficultto ensure that you arecomparing the same signal in parallel runs
Spectral counting
The normalization of spectral counts

Intensity based label free
Method summary:
- Compare MS1 peptide ion abundance across replicates runs;
- Specialist software must align different parallel LC-MS runs
- Calculate ratios from aligned MS1 data
- Requires good software (e.g.: Mascot distiller; Progenesis; MaxQuant; OpenMS; ProteomeDiscoverer; PLGS, many others…)
Advantages:
- In theory, should be more accurate than spectral counting – uses real intensity data
- No complicated labelling protocols
Disadvantages:
- Data processing is fairly CPU intensive
- Only works well if experimental system has high technical and biological reproducibility
Requirements:
- Very good LC delivery system (must be reproducible)
- High resolution mass spec (Orbitrap, Synapt etc…)
- Good PC for running software
Labelling quantification
Two approaches
Chemical (in vitro) labeling
- ICAT (isotope coded affinity tag)
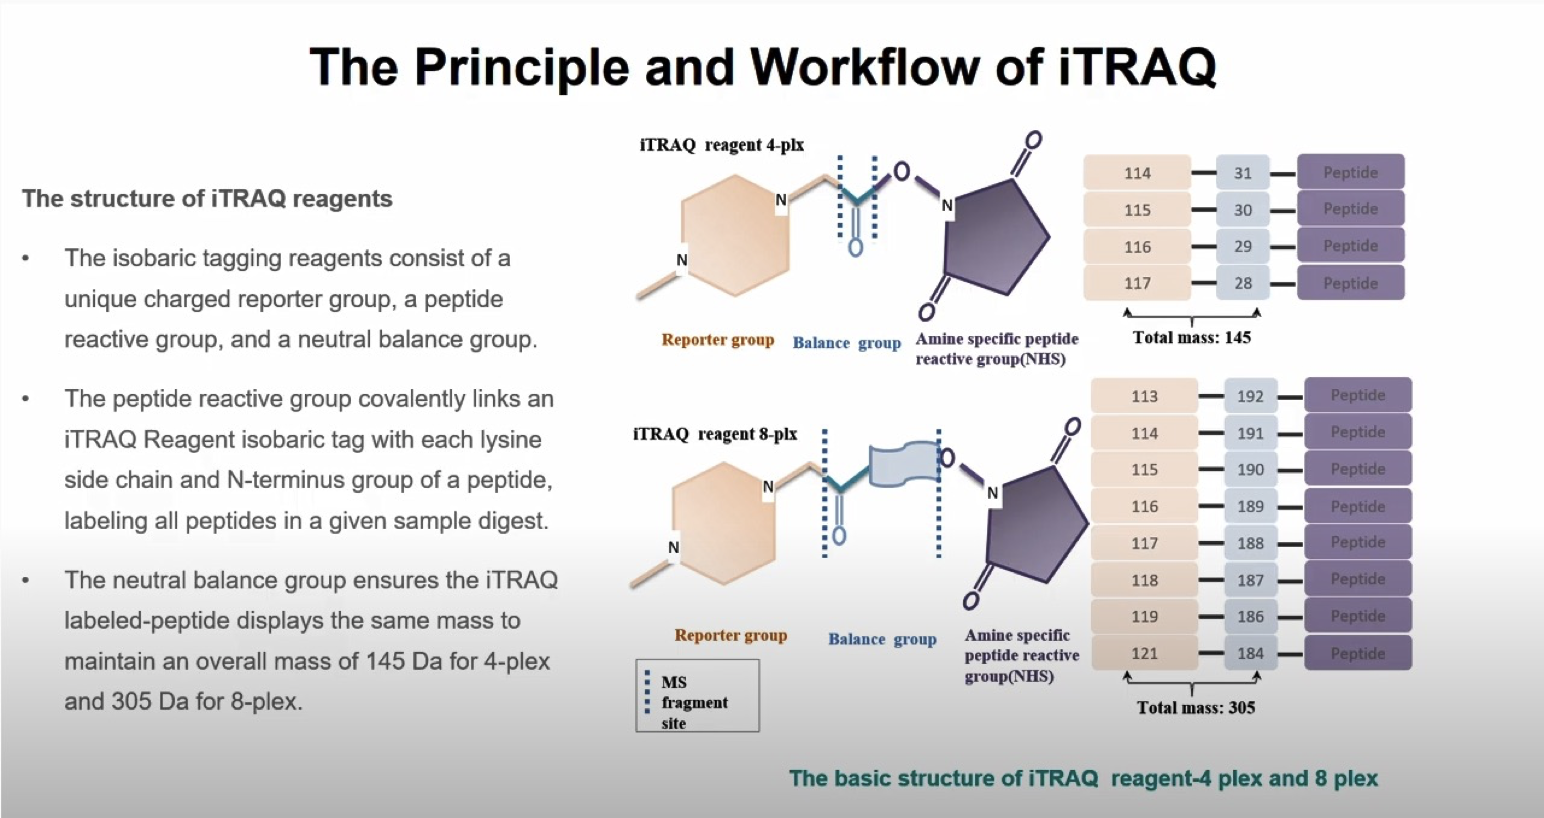
- iTRAQ (isobaric tag for relative and absolute quantification)
Metabolic [or in vivo] labelling
- SILAC [stable isotope labelling by amino acids in culture]
- Requires a cell culture, therefore cannot be used for experiments from other kinds of samples e.g. clinical samples
- SILAC [stable isotope labelling by amino acids in culture]
Lecture 5_Post-translational modifications
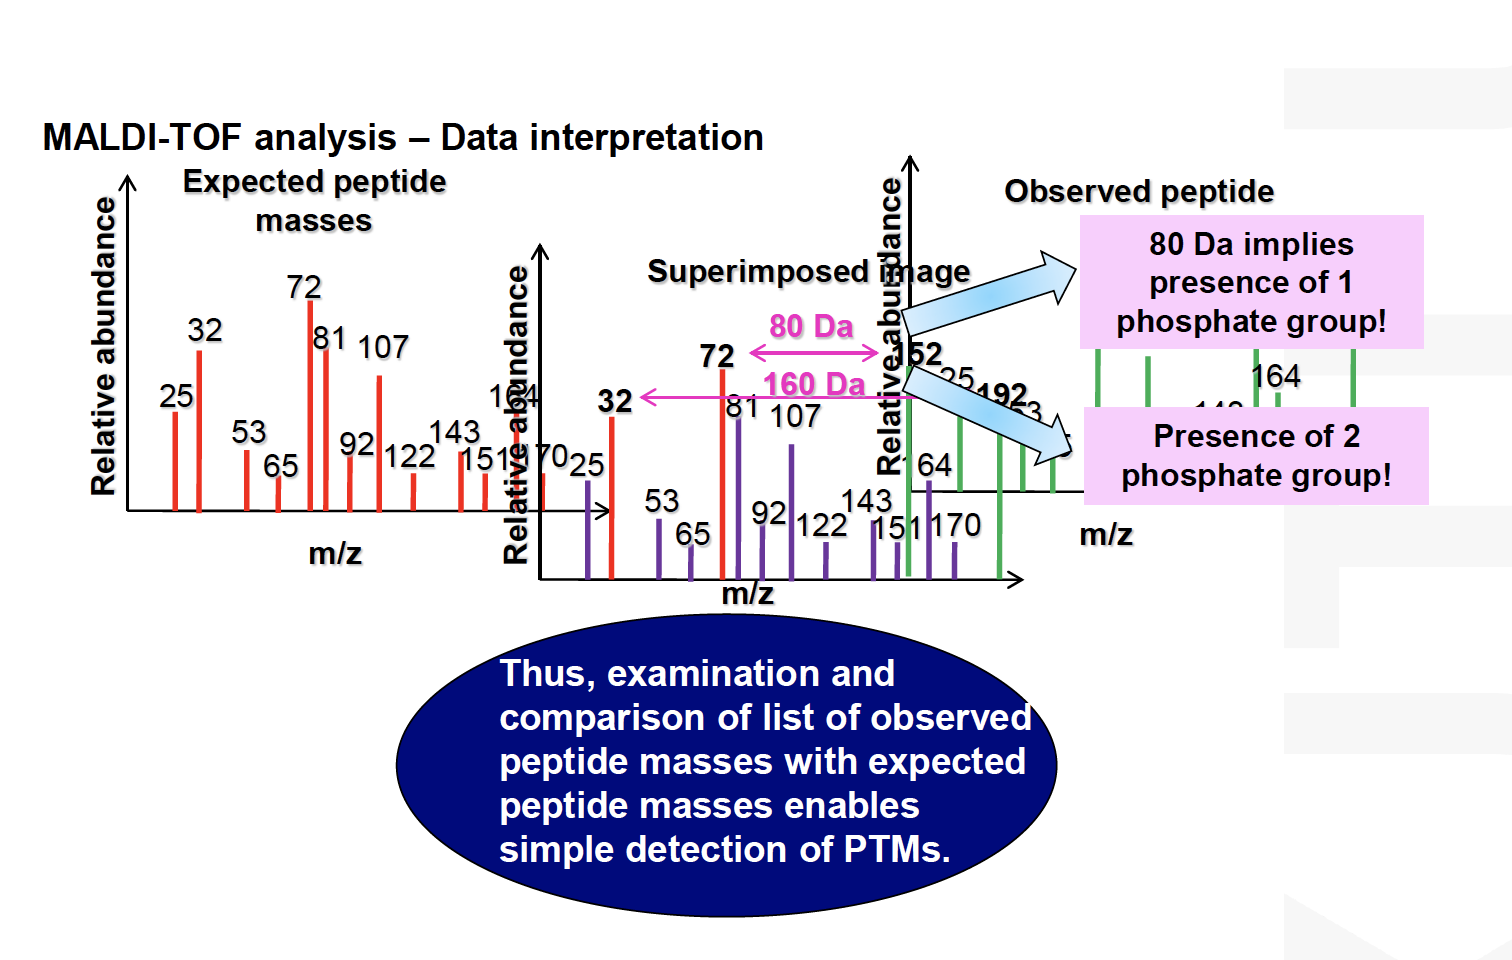
Proteomic Analysis for PTMs
Key issue in PTM analysis: modified proteins/peptides often have low abundance
**
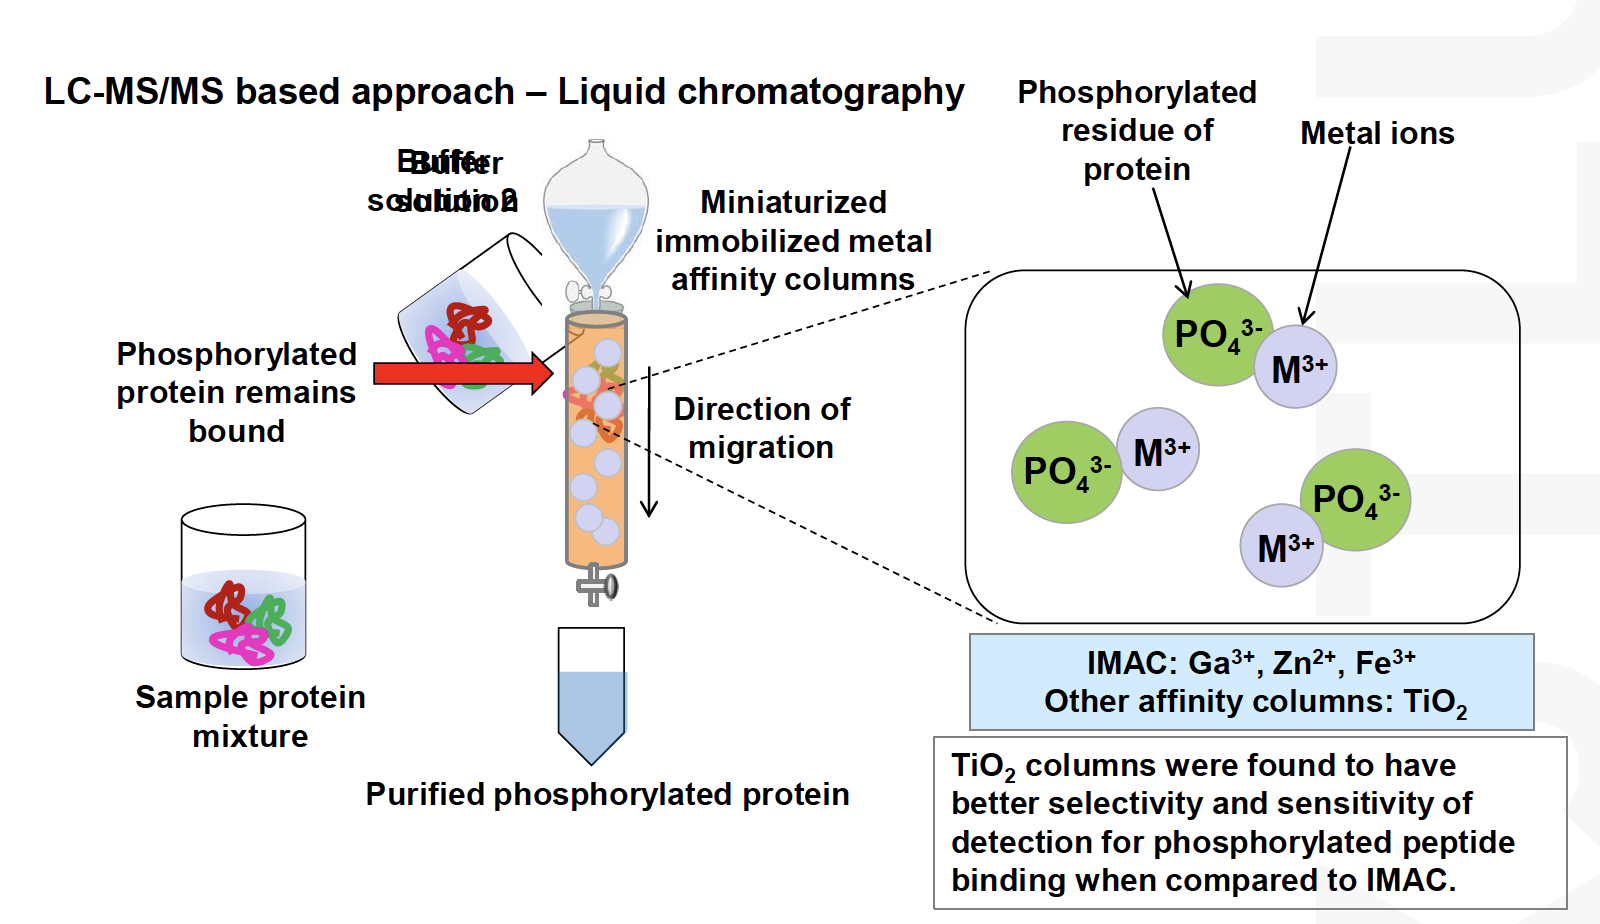
Enrichment**can be used to increase their concentration in the sampleThe most established methodology is phosphoproteomics
Development of phosphoproteomicshas been driven by the deep interest in signalling research (pharmaapplications)
Phosphopeptides are relatively easy to enrich and mass spectrometric methods have been well established, however, the enrichment outcomes are often
sample-dependentThe field is currently moving to high-throughput of profiling methods of other PTMs and the analysis of several PTMs in parallel
MS for Phosphopeptides
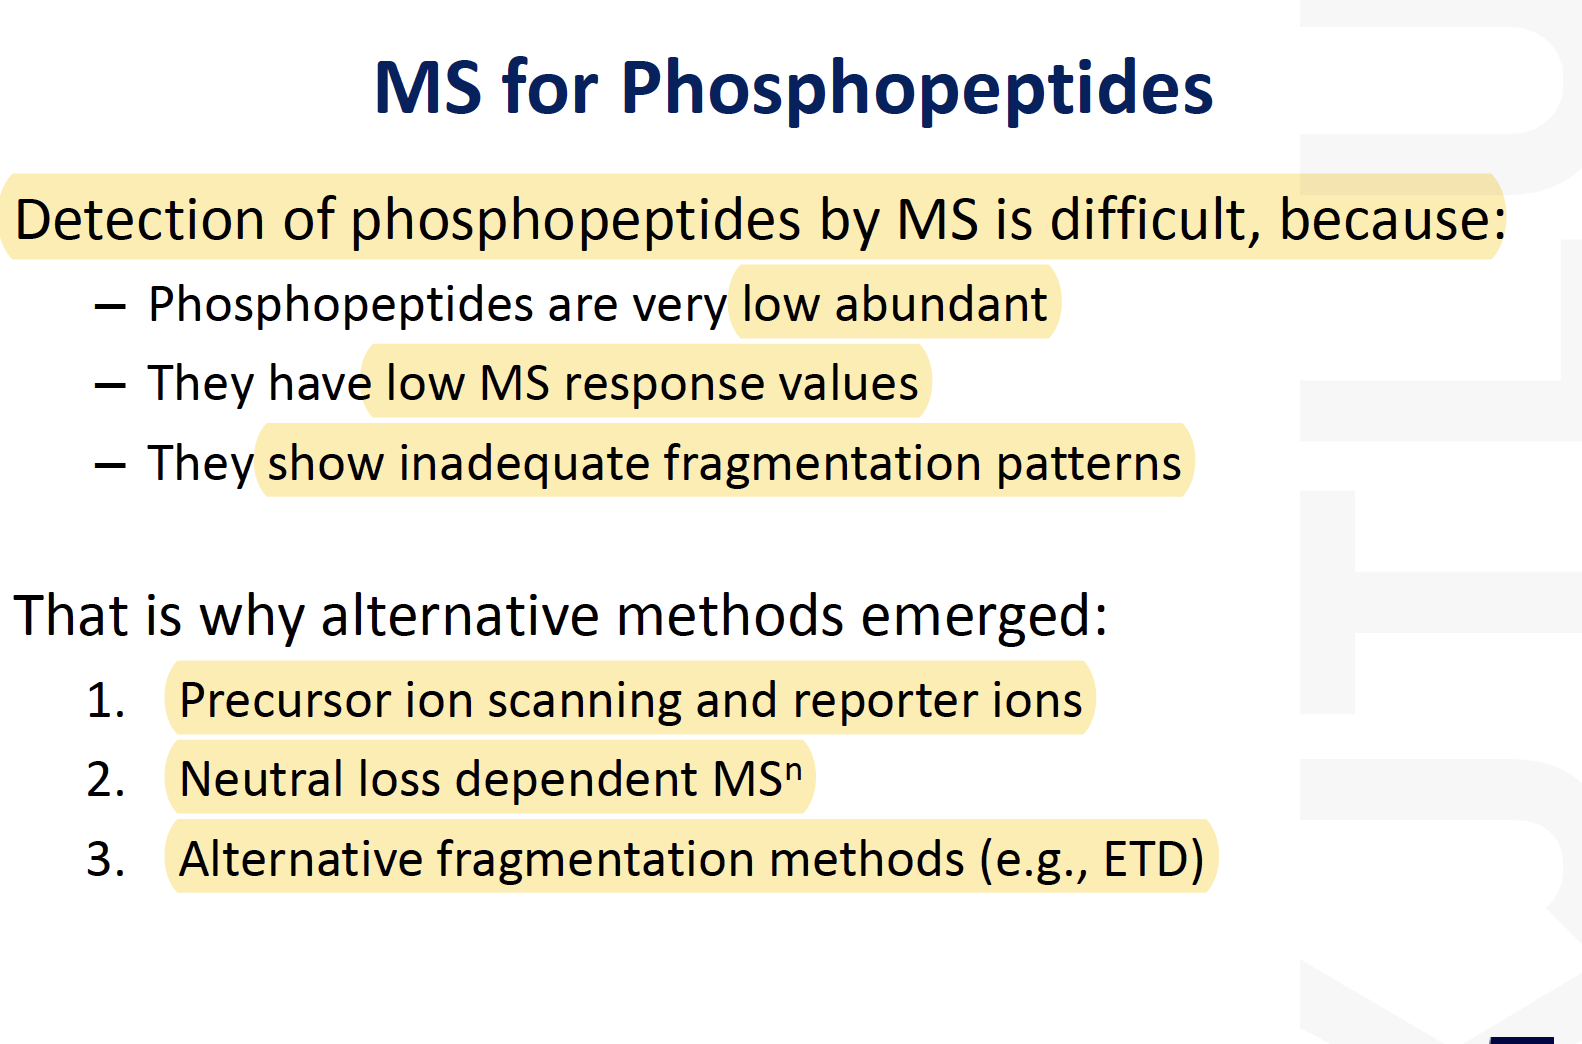
- Precursor/ Reporter ion scanning
- Neutral-Loss-Dependent

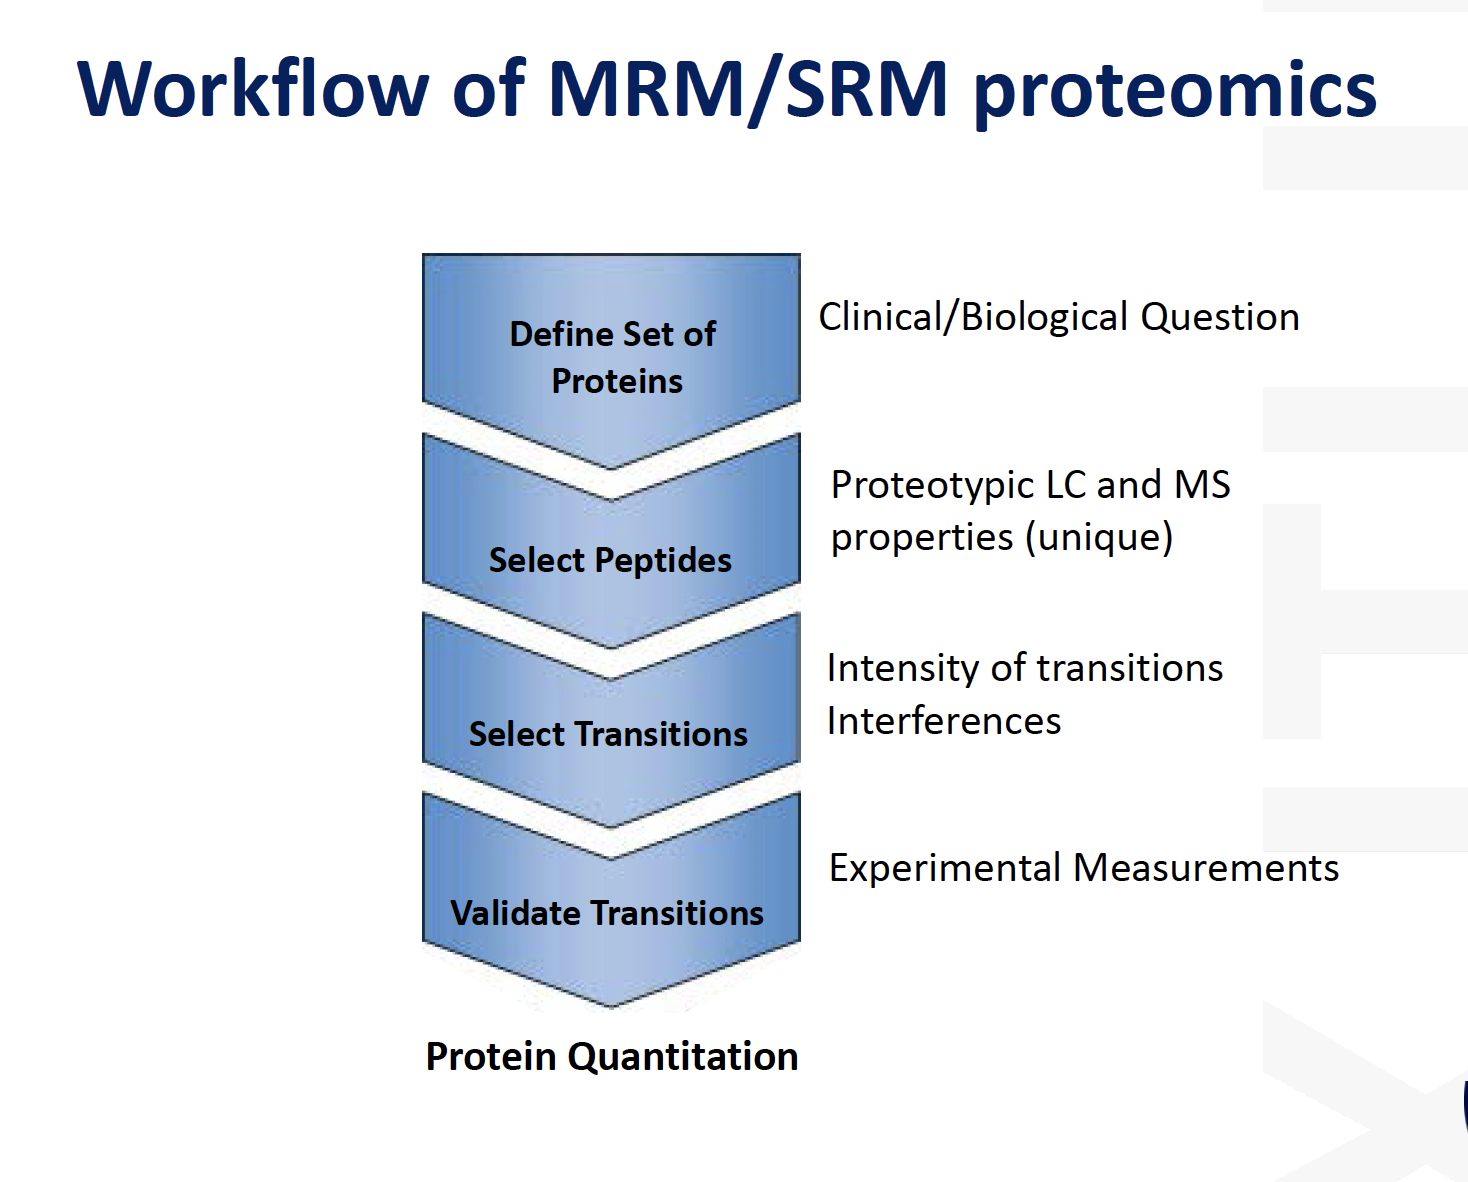
Targeted Proteomics
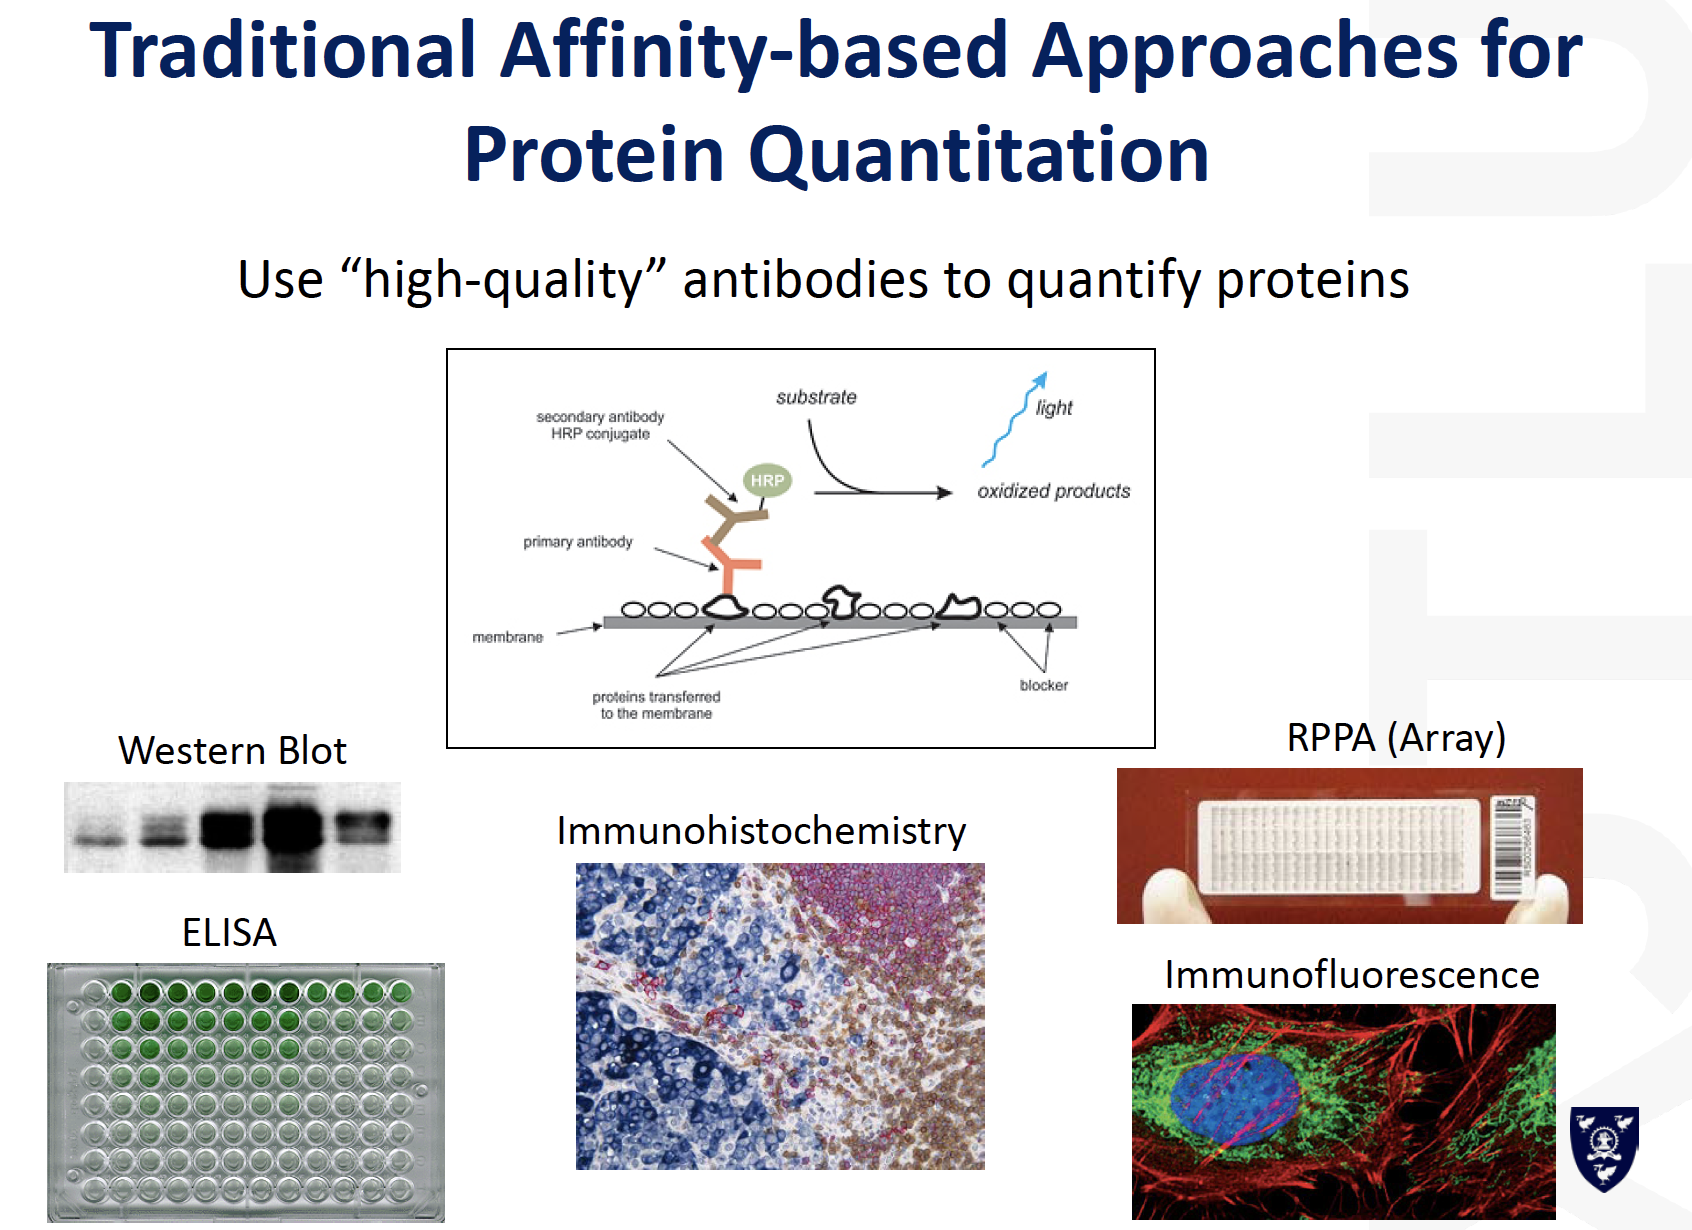
Comparison between traditional and MS based protein quantification
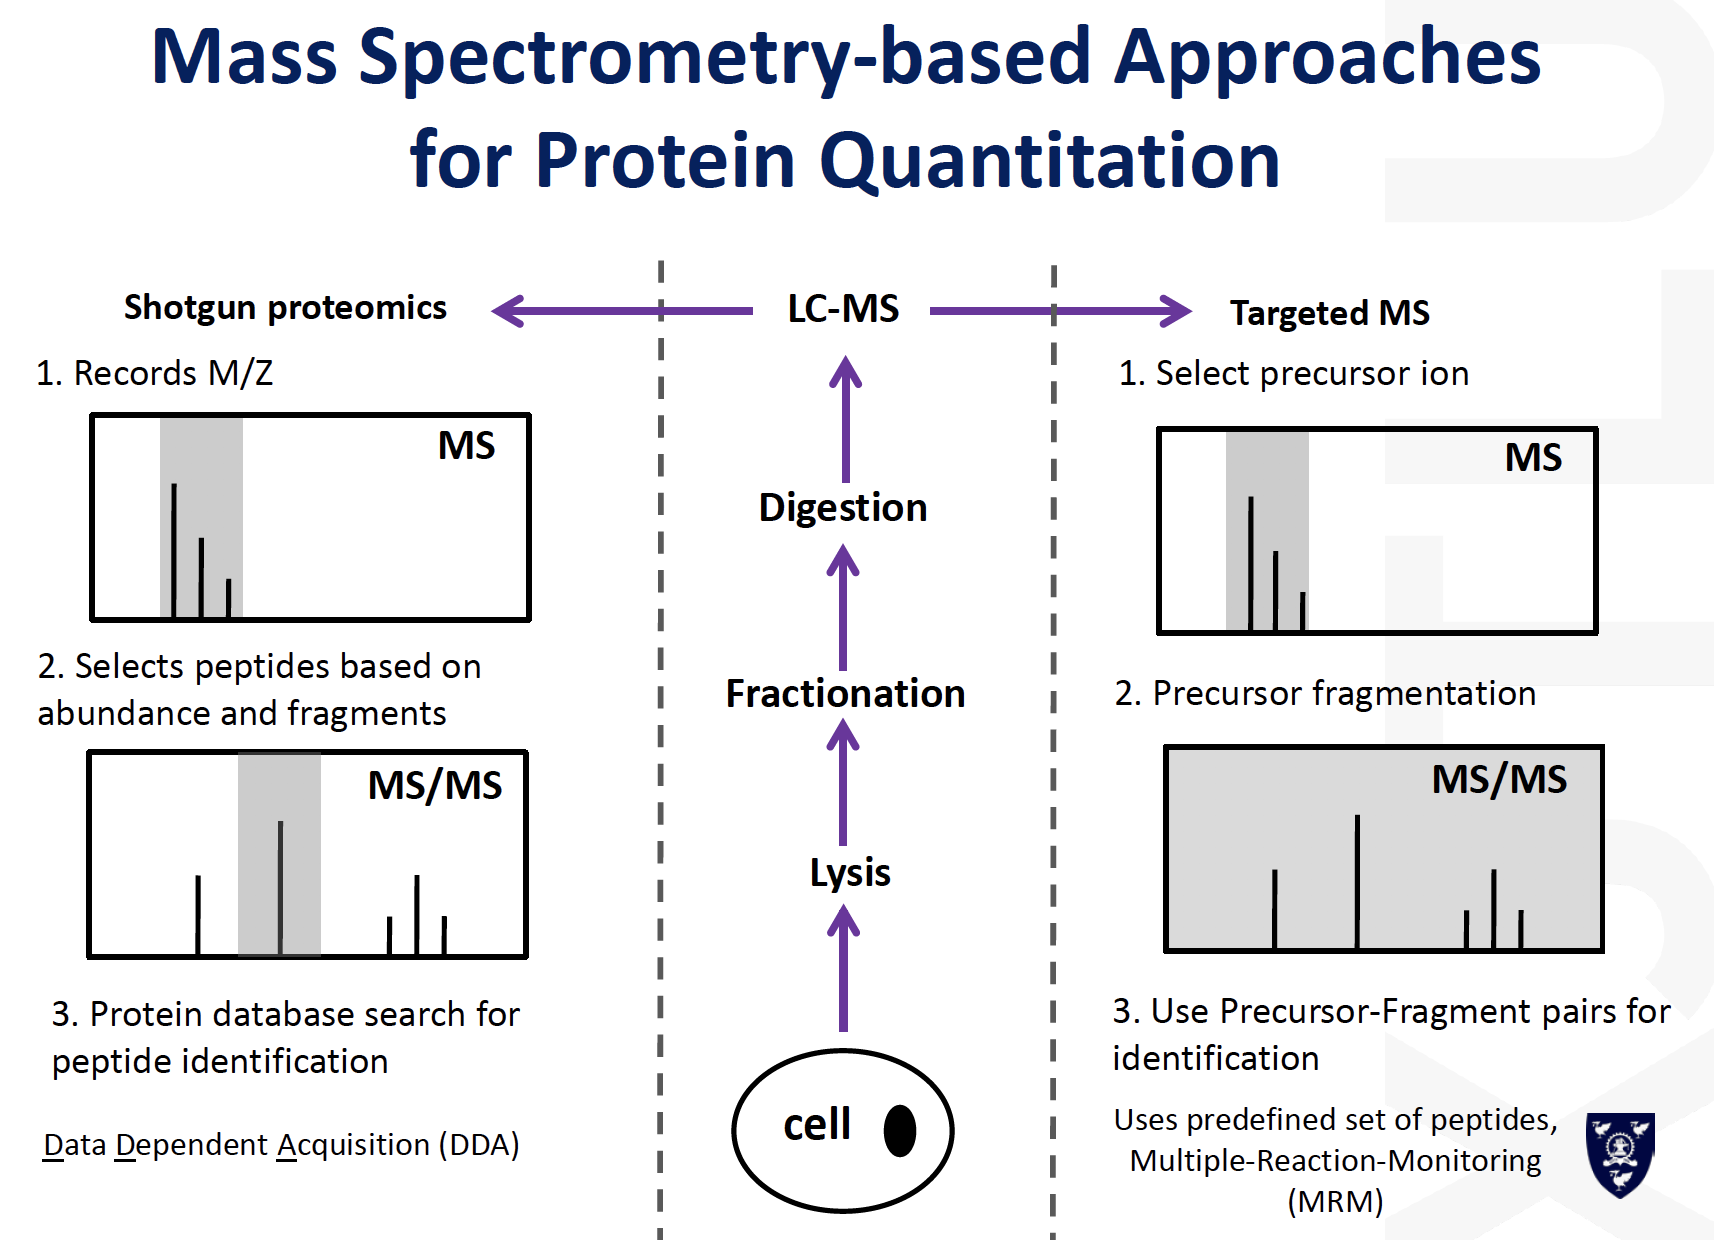
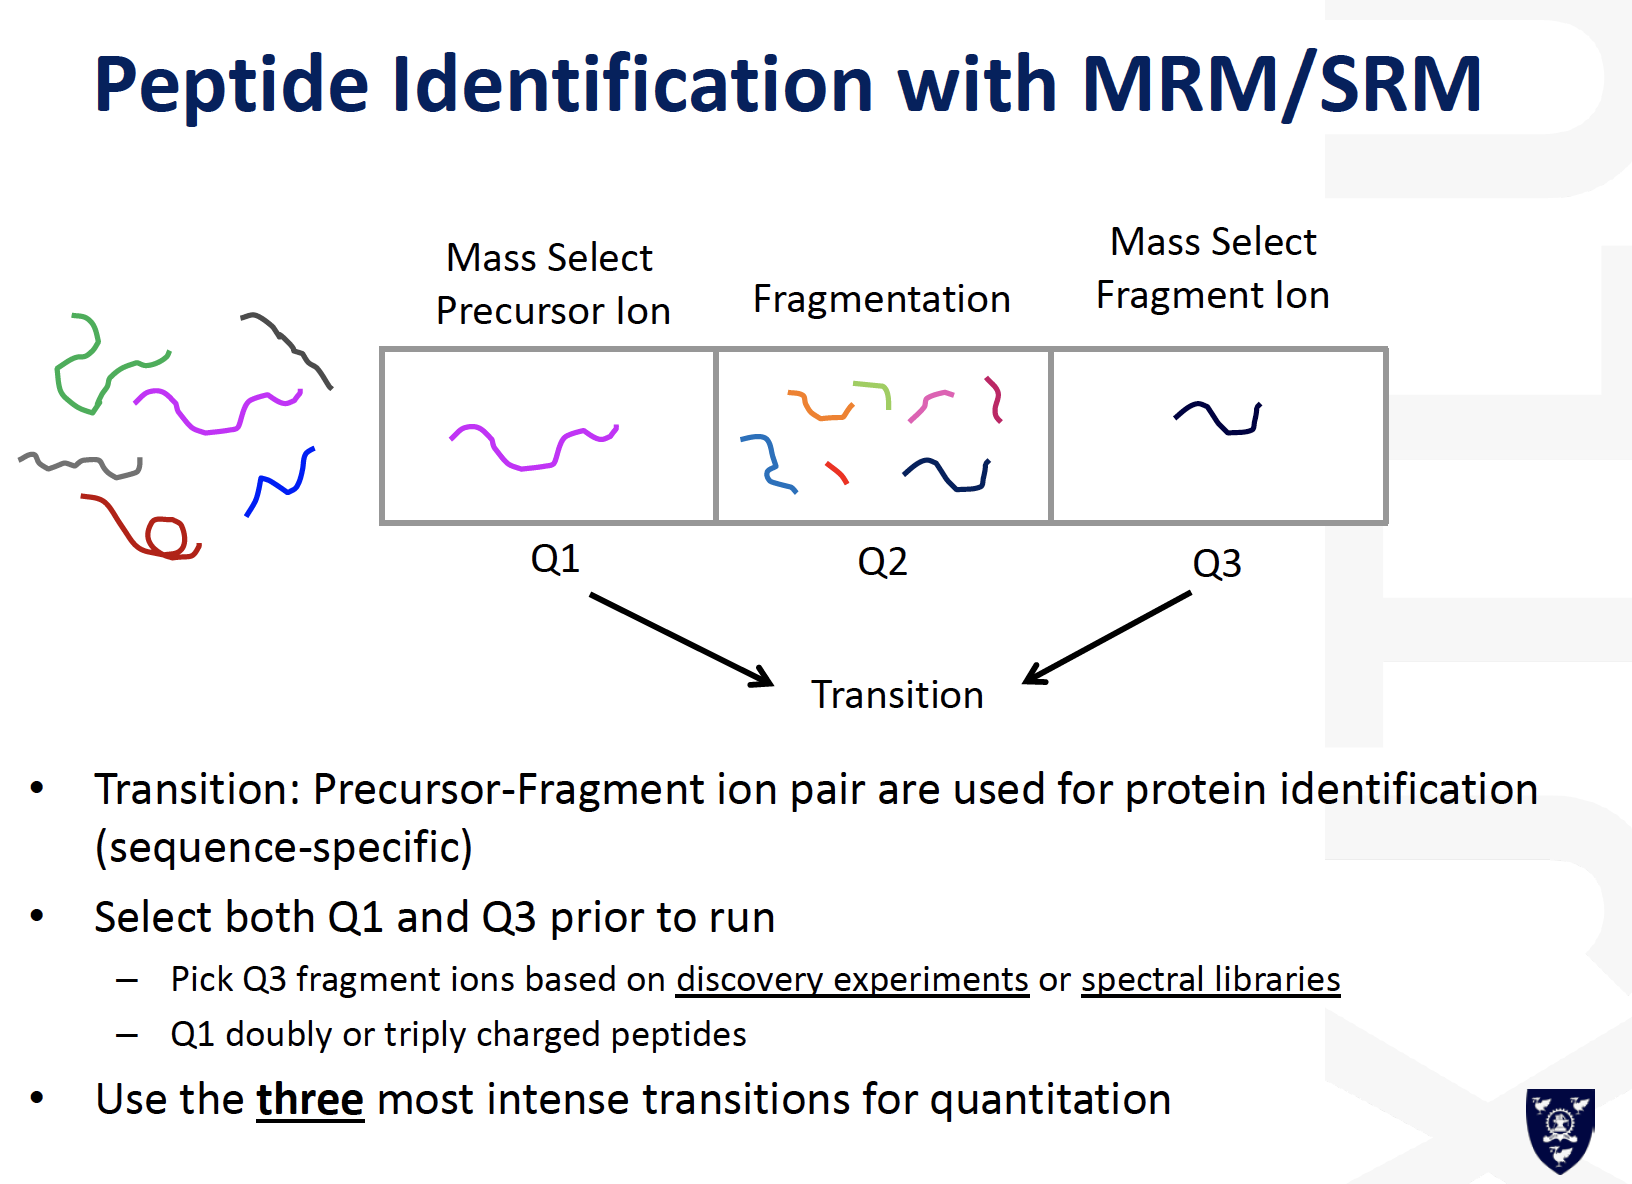
MRM / SRM
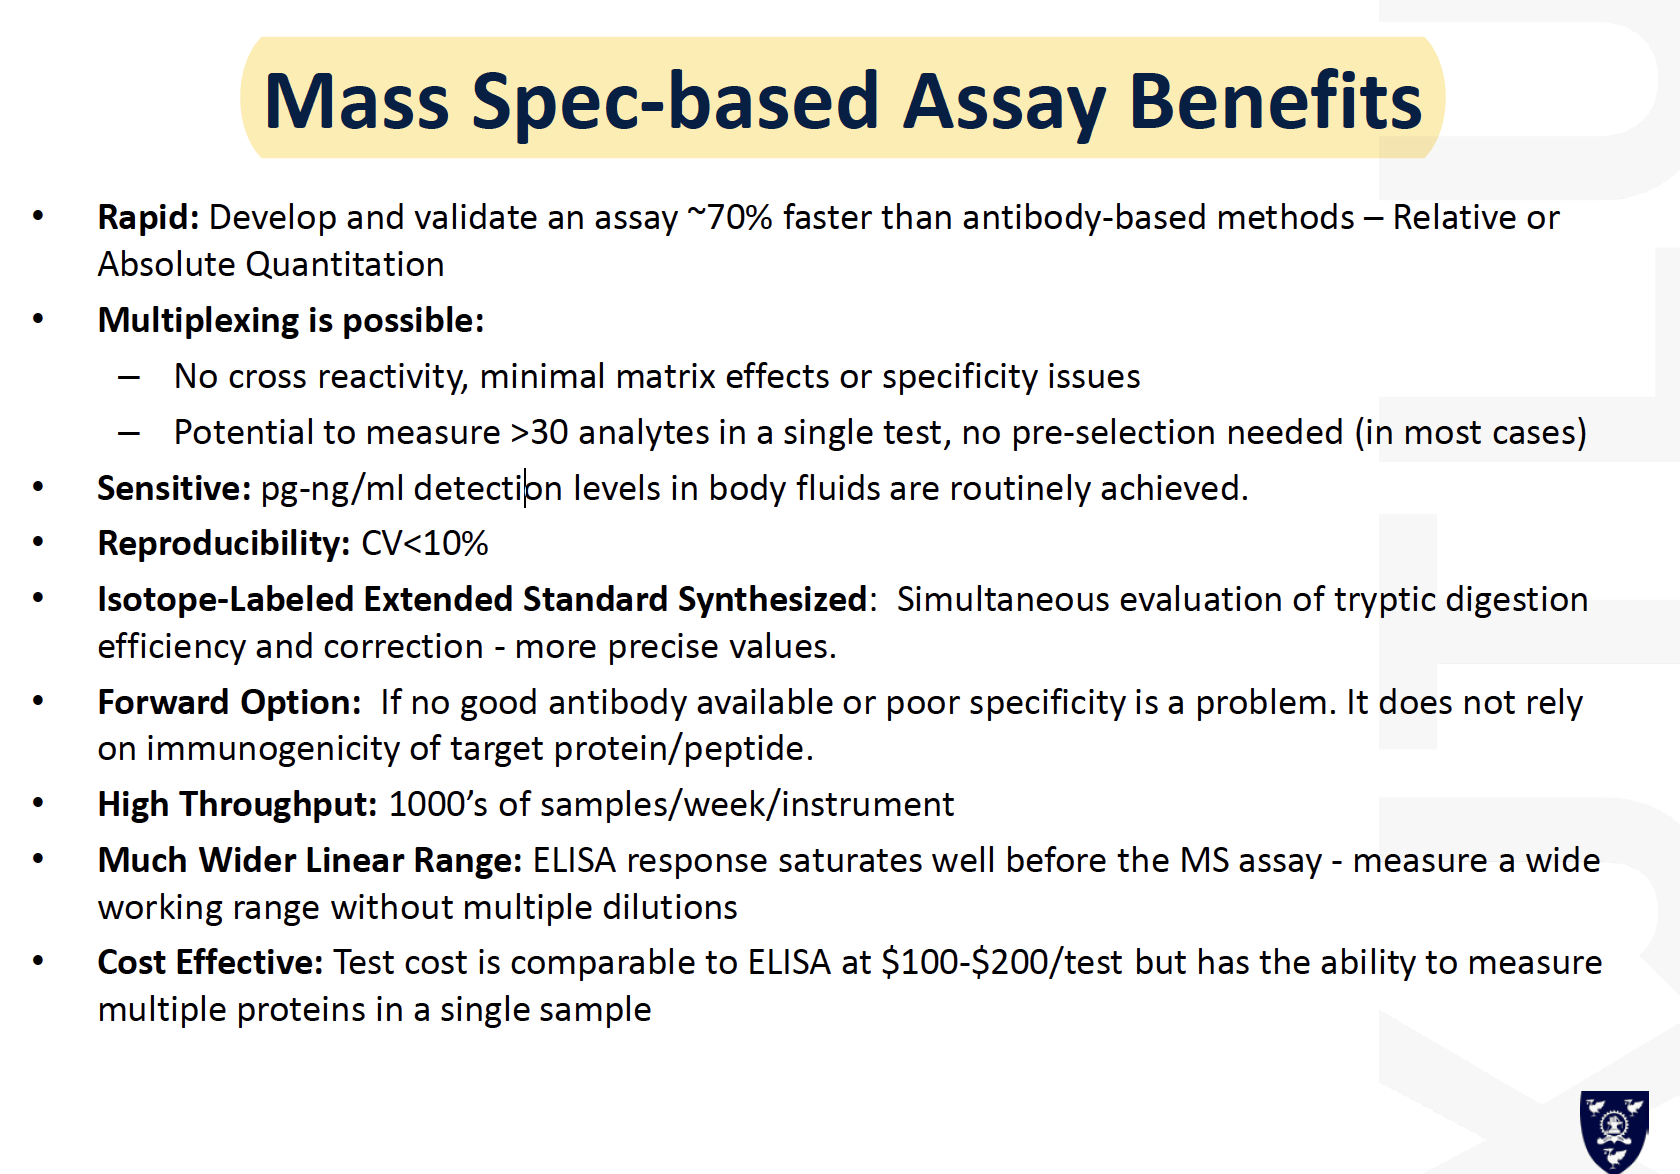
Mass Spec-based Assay Benefits
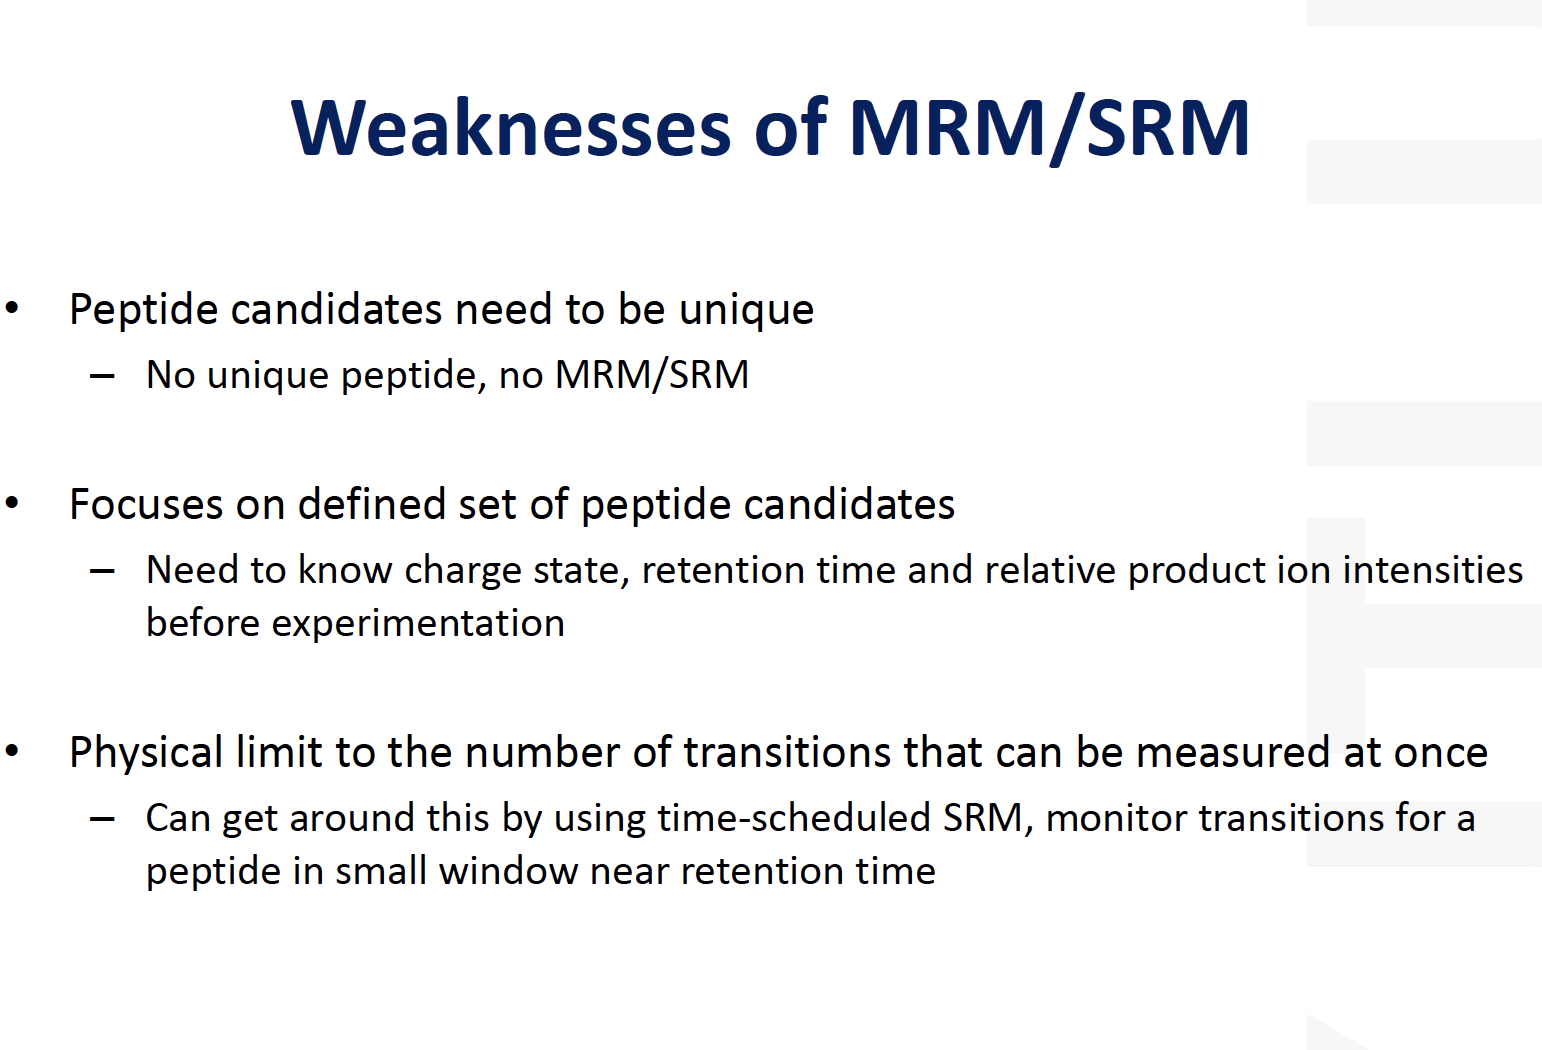
Weakness of MRM/SRM
- Post title:BIO312 Wang's part
- Post author:Yuxuan Wu
- Create time:2021-03-02 06:44:01
- Post link:yuxuanwu17.github.io2021/03/02/2021-03-02-BIO312-Wangs-part/
- Copyright Notice:All articles in this blog are licensed under BY-NC-SA unless stating additionally.